Dobridge, Hooper and Slok in “Jobless Recovery III Seems Unlikely” Global Economic Perspectives (April 21, 2010) [not online]:
The sluggish performance of payroll employment and
jobless claims in recent months despite well-above-trend
growth in output has raised the specter of another jobless
recovery. …
… Various high-frequency indicators of labor demand, as well as labor market policies and historical trends within the labor market, show a mixed picture, with
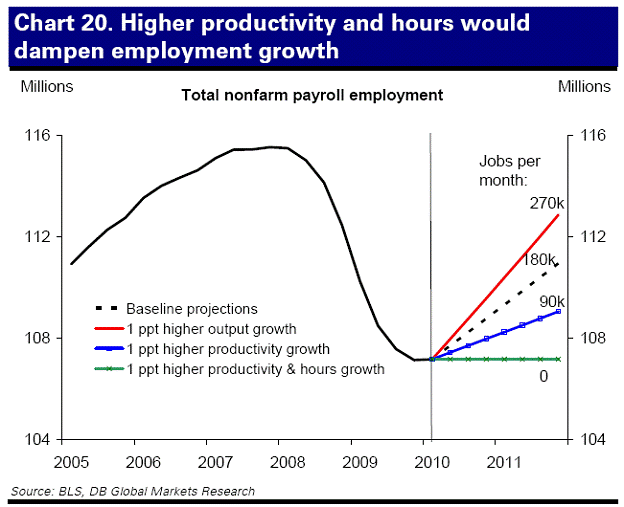
some pointing in a positive direction and others in a negative direction. We judge the balance of evidence to fall modestly in favor of a strengthening of payroll employment growth in the months ahead. Under our central scenario, we see monthly payroll employment growth average near 200k per month for the balance of 2010. This outlook assumes 4% GDP growth, a rapid drop in productivity growth to an underlying trend rate of around 1.5%, and a moderate recovery in the hourly workweek. Key uncertainties include the assumed paths of labor productivity and hours worked. There are risks to these assumptions on both sides of the central scenario, but they appear to us to be balanced more to the downside than the upside.
This forecast, plus alternate scenarios, are presented in Chart 20.

Chart 20 from Dobridge et al., “Jobless Recovery III Seems Unlikely” Global Economic Perspectives (April 21, 2010). Note figures are for private nonfarm payroll employment.
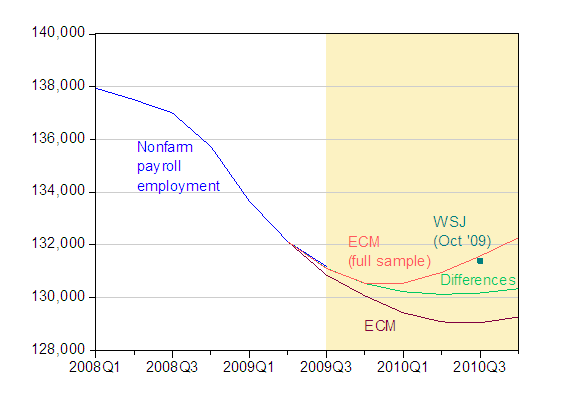
I thought it of interest to see how this estimate fits into the econometric-based conditional forecasts presented in this post from last November.

Figure 1: Nonfarm payroll employment, SA, in thousands, (blue), dynamic forecast from error correction model (purple), dynamic forecast from first differences specification (light green), and from error correction model estimated over 1967Q1-09Q3 period (salmon). WSJ forecast for October 2010 (teal square). Shaded regions denote forecasting periods. Source: BLS via FREDII, WSJ October survey, and author’s calculations. See this Nov. ’09 post for details.
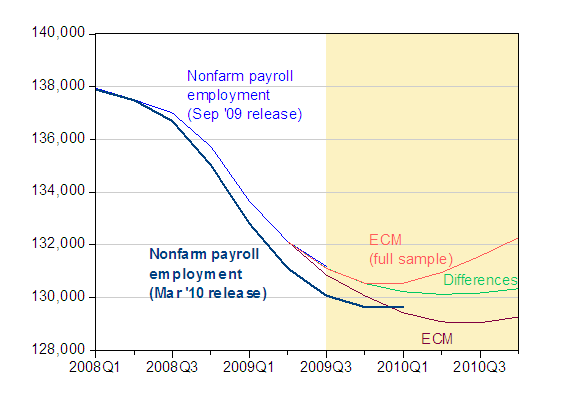
To see how things have played out since last November, I superimpose the latest nonfarm payroll employment series in dark blue. Note that the level has been shifted down, due to the benchmark revision associated with the January 2010 release.

Figure 2: Nonfarm payroll employment, Sept. ’09 release (blue), and Mar ’10 release (dark blue bold line), in thousands, seasonally adjusted; and dynamic forecast from error correction model (purple), dynamic forecast from first differences specification (light green), and from error correction model estimated over 1967Q1-09Q3 period (salmon); all forecasts based on October 2009 data. WSJ forecast for October 2010 (teal square). Shaded regions denote forecasting periods. Source: BLS via FREDII, WSJ October 2009 survey, and author’s calculations. See this Nov. ’09 post for details.
What I find interesting is that the pattern (although not the level) most closely matches the conditional forecast associated with the full sample error correction model (and not the one estimated over the last two jobless recoveries). The key conditioning variable is GDP. It turns out that GDP in 09Q4 was only 0.5% (log terms) higher than the October WSJ mean forecasted level I used to conduct the forecast. This suggests that differences in GDP are not central to the difference in forecasted growth in employment.
The Dobridge et al. forecast 180 thousand jobs created on net per month is quite close to my estimate of 192.5 thousand per month. One difference is that the DB forecast (3.8% q4/q4 in 2010) is substantially higher than the October 2009 WSJ mean forecast. (Update: There is a slight difference in measures; Dobridge et al. are forecasting private employment growth, while I forecasted total nonfarm payroll employment growth. If there is little change in government employment going forward, then the figures are comparable.)
Somewhat less optimistic implications can be drawn from the IMF’s recent assessment of output-employment linkages in Ch. 3 of the WEO, which indicates a 6 quarter lag between trough in output and resumption in employment growth, in the wake of recessions accompanied by financial crises (Figure 3.10).
Update, 11:45am Pacific Reader tj writes:
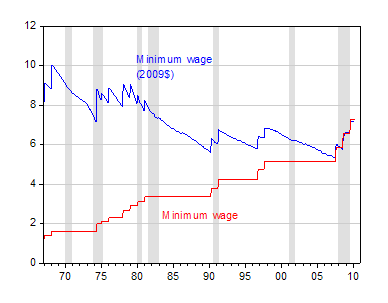
“At the low end of the wage scale, we have a minimum wage that jumped 3 times from 2007 – 2009. This is our first recovery in which hiring decisions are impacted by the new minimum wage.”
This is factually incorrect:

Figure 3: Minimum wage in dollars per hour (red) and 2009$ per hour, deflated by CPI-all. NBER recession dates shaded gray. Source: St. Louis Fed FREDII, NBER and author’s calculations.
Whatever the rate of job growth turns out to be, it will surely be muted by the state of flux regarding government policies, ie, health care, cap and trade and new payroll taxes. New taxes will permanently dampen consumer and business spending growth and thus employment growth.
At the low end of the wage scale, we have a minimum wage that jumped 3 times from 2007 – 2009. This is our first recovery in which hiring decisions are impacted by the new minimum wage.
While the number of workers at the minimum wage is relatively small, it grows as the minimum wage rises and impacts some vunerable groups, eg, single mothers and inner-city teens.
tj: See my addition to the post.
The high unemployment rate indicates that the real factors in our economy are still in decline. That being the case such things as an increasing GDP and stock market are clear signs of the monetary “stimulus” artifically propping up the statistics while the real economy remains in distress.
We are facing a similar situation as the real estate bubble only because of the contraction the bubble appears to be a recovery.
It is almost a forgone conclusion that taxes will increase significantly in 2011 and the initial costs of the health care bill will begin to phase in in 2011 as current health care providers increase their prices to cover the new expenses the nationalized health care plan will impose on the economy.
While statistics in 2010 may hint at a recovery it is an illusion hidden by aggregate accounting.
I find this claim odd: changing government policies will inevitably dampen employment growth. I guess if the argument is that increased taxes will restrain growth, there is certainly a good theoretical case to be made. But the empirical research I know of does not tend to support a negative tax impact, in isolation of how the additional revenue is used. Tax increases that support government transfer payments do tend to reduce growth. But tax increases that support government consumption and investments tend to enhance economic growth. Given the widespread claim that increased taxes invevitably retard growth, hoping we could see a future post from MC or JH that addresses the economic research on this issue.
Menzie – I am not sure why I worded it like that. What I meant was that this is the first recovery we’ve had since the 3 new changes occurred. Sorry for the confusion and thanks for the nice chart. 🙂
Mark,
By ‘state of flux’ I mean uncertainty. Firms are uncertain how health care policy, changes to payroll taxes, new taxes on carbon emissions and potentially others, will impact the marginal value product generated by hiring an additional worker. (Assuming business owners are risk averse and/or expect new taxes and policy to reduce after tax marginal value product.)
Regarding the impact of new taxes on employment growth. Are you implying that new payroll taxes, or other new business taxes will increase employment growth? It has the potential to increase the demand for borrowed funds and interest rates becasue business will have less cash. If government takes an extra $1 in tax from a business and distributes it to households then what is the net effect? Some of that $1 is drained from the U.S. economy to pay interest on foreign held debt. (Admittedly a small fraction of total government spending). Some net multiplier effect between the increase in government spending and the reduction in spending from smaller dividend payments. There could be a negative impact on Saving and Investment. Lots of things to keep track of.
Given the increase in the number of government agencies that are being created, I suppose the tax increases could be associated with an increase in government employment growth.
I guess the question is: Do we have any evidence, one way or the other, how a specific tax change effects employment growth. It also matters where the tax shows up on the income statement. Income tax comes after all other expenses, interest expense comes before income tax, and payroll tax comes before both of those.
There are numerous studies on changes in personal income taxes. There must be some on payroll taxes. I doubt there are any on carbon taxes. I think there is usually some doubt as to whether a given study has adequately controlled for all the other changes that occur (in addition to the tax change), during the study period. If tax increases stimulate employment growth then we should raise the tax rates to 100%. I always hate those kinds of arguements 😉
The US has just gone through 2 of the largest bubbles in economic history over the last 500 years. There is no reason at all to expect a bounceback.
1) The bubbles were inflated to mask underlying weaknesses that will now be revealed, or 2) they caused malinvestment in capital and labor that will take years and years to work through.