In an interesting post a couple weeks ago, Keith Hennessey critiques the President’s recent speech about employment growth, and presents the following graph, to highlight the gap between where employment is and where it “should” be.
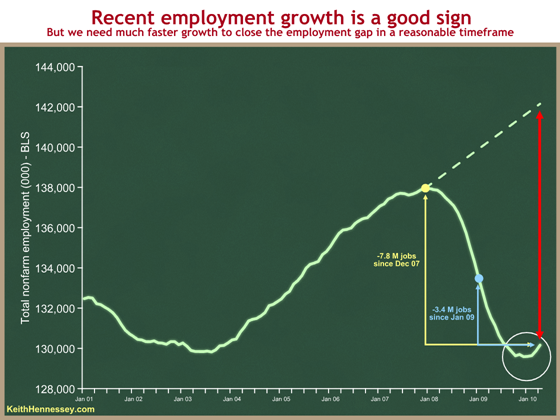
Figure from Hennessey (May 20, 2010).
I’m not sure what the trend is in his graph; it appears to be estimated on the level of nonfarm payroll employment. I “eyeball” the length of the red line at about 11.7 jobs. The graph explicitly lists 3.4 million net job loss going from January 2009 to April 2010.
I thought it interesting to costruct a similar graph corresponding to the administration of Mr. Hennessey’s boss, President Bush (actually, he was my boss, too, for 5 months). The graph below incorporates the May employment release.
Figure 2: Log nonfarm payroll employment, in thousands (blue line), linear trend estimated over 1947M01-2001M01 period (red line). Gray shaded areas are NBER defined recession dates, assuming last recession ended 2009M06. Vertical line at beginning of Bush Administration (2001M01); vertical dashed line at April 2002 (corresponds in timing to Hennessey comparison); vertical dashed line at end of Bush Administration (2008M12). Source: BLS, May 2010 release, via FREDII, NBER, and author’s calculations.
At the corresponding point in his Administration, President Bush was down by 5.5 million from the 1947M01-2001M01 linear deterministic trend. Interestingly, by the end of his Administration, in December 2008, it was 22.4 million below trend. By the way, the estimated trend is 0.0018 per month; the shortfall would look worse if one used the 1991M04-2001M01 period to estimate the trend, since the estimated monthly rate of increase in log NFP is 0.0020).
The graph also highlights another interesting point: NFP only started rising on a sustained basis in September 2003, some 32 months after 2001M01.
A caveat: Log nonfarm payroll employment (NFP) does not appear to be trend stationary. In fact the ADF test with optimal lag length selected by AIC or BIC fails to reject the unit root null over the 1947M01-2010M05 period. Similarly for the Elliott-Rothenberg-Stock DF test. A Kwiatkowski-Phillips-Schmidt-Shin (KPSS) test with trend stationarity null does reject at conventional levels. Estimating a very simple difference stationary process (i.e., an ARIMA(0,1,0) )yields similar rate of increase, 0.0017 per month, versus the 0.0018 for a linear trend.
The point that log NFP is not well characterized as trend stationary is well known. In fact, this is true for most macroeconomic time series — although for a long enough sample, one can find trend stationarity for US real GDP (see discussion of some very simple time series econometrics [1] [2] [3] [4]).
One can still do projections, either assuming difference stationarity (which, if Mr. Hennessey wanted to stay in the univariate context, would be more appropriate), or one could appeal to a multivariate approach, such as in a cointegration framework. This alternative would require taking a stand on what variables were cointegrated, and the stability of that relationship, but at least then one could talk about reversion — although then the reversion is to close the error correction term defined by the cointegrating relationship. For an example, see this post, which relies upon a GDP-employment cointegrating relationship.
That being said, I agree with Mr. Hennessey:
Instead, I’m trying to show that, while +290K jobs in April is a good number, and it is the most jobs created in any single month in four years, we need a much more rapid pace of net job creation for the foreseeable future to close the employment gap in a reasonable time frame. And the “best in four years” shouldn’t surprise you, as we should expect more jobs to be created during a recovery than when the economy is at or near full employment.
But I would add that we should probably move beyond simple univariate characterizations of trends in our policy discussions.
I agree. While I still stick with my qualitative conclusions, in retrospect my trendline was way too simplistic for this exercise. Rather than try to develop my own employment model, if I were doing it over I would have simply left out the dotted and red lines.
Majority of job growth are government positions. Plain and simple. Also, the unemployment rate is much higher than what “official” government statistics are telling us. If the government weatherman tells me it’s sunny outside but I see it raining, I’m going to bring an umbrella.
The latest New York Times unemployment number tells us something else here. The real unemployment rate is about 20% because of all the people who have quit looking for work, those who are working part-time, students who graduated from school and have not found jobs, etc.
Both graphs are shocking. What is the relationship between employment growth and GDP growth? If we assume employment growth over the next 50 years will be slower than over the last, will GDP growth likely also be slower?
MikeR: According to my estimates in this post, the long run elasticity of employment with respect to real (Ch.05$) GDP is 0.37, over the 1986-09 period. I recall that this point estimate is lower than than obtained over the previous 20 year period.
I look at the employment-population ratio 16 years and up.
It has been rising fairly consistently as families get smaller, more women work increasingly full time professional jobs, and as people have longer healthier lives allowing longer work.
The peak for non-farm was in 2000 for the data series; I wonder what the rate was during WWII with so many men in the war, if military were counted as employed.
“Everyone” says the retirement age needs to be raised, which to me says that this ratio needs to increase even more. The drastc reduction in the ratio has caused the SS surplus to reach break even a decade earlier than forecast a decade ago – ~2010 vs ~2020.
So, the peak in 2000 is not high enough for future expansion peaks. Using the 2000 ratio of 64.5%, the short fall at the expansion peak in 2006 was 1% of the over 16 non-institution population, or 2.3 million employed. Today, the short fall is about 64.5%-58.5% -> 6% of 237 million or 14 million.
But that is the number for the solid middle of the expansion, but the population increases, so must the target. To get to 2000 levels by the 2012 elections, 17 million more people must be employed, to reach 2000 by 2016 elections, 23 million.
Clinton saw and increase in employment of 23 million, which wasn’t that high a rate, it was slightly higher that Reagan, but lower than Carter, to pick the president know for a terrible economy. 10 million more people were employed when Carter left office from a much smaller population, about 160 million 16 and over, vs 235 million today.
The rate of employment now is lower today than when Carter left office. In the four years of Carter’s term, the rate increased from 57% to 59% (with a peak of 60%), in the eight years of Reagan from 59% to 63% (with a low of 57%), for Clinton, from 61.5% to 64.5%. Both Bush’s saw the rate fall during their terms, -1.5% and -3%.
I note that the lowest rate occurs before tax hikes, not after tax hikes, for Carter, Reagan, Bush, Clinton, and Obama, counting health reform as a tax hike. Bush didn’t hike taxes.
In any case, at least 23 million more working people by the time Obama leaves office is required, but very reasonable.
Mr. Hennessey needs to retract more than his trend-line. The assertion that Obama’s “celebration” was premature links to the text of a speech in which Obama notes that GDP rose (it did) and that job loss had slowed to about half the pace of loss at the time of his inauguration. The only in accuracy was that job loss had fallen by well more than half. Hennessey’s comment reads as little more than snide carping, and seems to assume few readers will bother to hit the link and read the speech.
So, the trend-line was wrong in a way that can be read as unfair to Obama. The assertion that Obama “celebrated” prematurely looks a bit like spin aimed against Obama, and this Hennessey character worked for Bush. Think there may be a pattern, as well as an explanation for the pattern, developing here.
Andrew,
The government actually publishes a number of unemployment rates. The narrowest rate is the one that the press picks up. If you check the “part-time and marginal” rate, you’ll see it stood at 16.6% in May, down from a high of 17.4% in October of last year. The low for this series prior to the recession was 8.0%. It had risen to around 8.8% by the official onset of recession. Turns out, the jobless rates was(were) a pretty good indicator of impending recession this time. If I were in charge of fudging data, I certainly wouldn’t put in a hint of recession until I had to. BLS data are on the up-and-up, but you have to know how to read them.
There’s a natural “trend” here: measure jobs relative to the adult population.
Hi Min. Back in 06 I sent a long an article (that later appeared on Angry Bear) of mine that included a mark up of a graph showing the gap of 03 at some 7 million.
On 330 April, Larrry Summers @ the Center for American Progress, Discussion on Jobs said:
.
40 yrs ago, at any given time, 1 in 20 adult males were out of work
Today, at any given time, 1 in 5 adult males are out of work
5 yrs from now, after the recovery, at any given time, we can expect 1 in 6 adult males to be out of work, and 1 in 10 of those with college.
Causes:
Technology (automation) less labor required to produce more
Off shoring of low tech jobs due to globalization.
I, too, think that the gap is now some 11 million plus; I suspect it is on the order of 15 million, may well be 17 million. More, they need be good jobs, of which a there are very few on the horizon.
Thanks for the reference to your earlier post. As I play with the data, I am finding lagged changes in employment levels do not help much in predicting changes in GDP after I include a measure of the gap as suggested in the Morley paper referenced in the post below. I am concerned that “this time is different” because employment levels have never grown this slowly and unemployment rates have never increased this sharply. Since they are “high leverage points” in the model, we need to be more cautious about model predictions based on these data.
https://econbrowser.com/archives/2009/07/a_vshaped_reces.html
MikeR: I don’t see a particular reason why GDP ex inventory investment (final demand) should be well predicted by lagged NFP. More fundamentally, just because log GDP and log NFP are cointegrated does not mean the error correction term would well predict the change in GDP (I think in the jargon, GDP might be exogenous for the cointegrating vector).
In any case, I look forward to seeing your results (by the way, one could use robust regression methods if one is worried about leverage from outliers).
Keith Hennessey: Thanks for the comment. I think we agree that trends, particularly these days, have to be “handled with care”.
This would make a good post for The Onion.
Menzie,
I have no theory as to why past changes in employment might predict future changes in GDP. I was trying to use the weak employment numbers to justify my view that GDP growth will be 2% over the long term, rather than 3% we had in the past. I was thinking that there should be a link between employment and capital formation and future growth.
The above post was by me. Wally, seeing as The Onion was started at UW Madison, for all we know Menzie might be a contributing editor! Joking…
Figure 2 Your trend line as applied to the modern post-9/11 era is meaningless, shading into obfuscation. It merely confuses the interested reader of this blog, and is an anti-Bush political red herring and polemic. No forecasting economist worth his salt would use a trendline originating out of WWII for the global economic era starting after the fall of the Berlin Wall which opened the global economy to 1.3 billion heretofore non-competitive Chinese workers.
Mike R June 8 Assuming employment growth will be x% and asking about economic growth has the cart before the horse, Mike. Economic growth prospects drive employment, not the other way around.
Menzie Chinn June 8 A long-run elasticity of employment wrt GDP of .37 is a sensible estimate. If GDP growth is 2.6%, employment will grow at a 1 percent rate. The more pregnant and informative notion is that with population growth at 1%, the unemployment rate will be stuck at whatever level it’s at if GDP growth isn’t faster than 2.6%.
Mike R June 9 Lagged employment can never predict GDP (except in second- or third-order ways in which we have little interest). Causality is the other way around. A worthwhile exercise would be to statistically prove this to yourself. Moreover, regarding the unemployment rate it is indeed so that this time is different because of: (a) China and (b) baby boomers whose decimated 401k’s are deciding them to stay in the workforce. The unemployment rate is going to stay unconscionably high, creating rising social stress and open strife. The answer to this is: grow the economy.