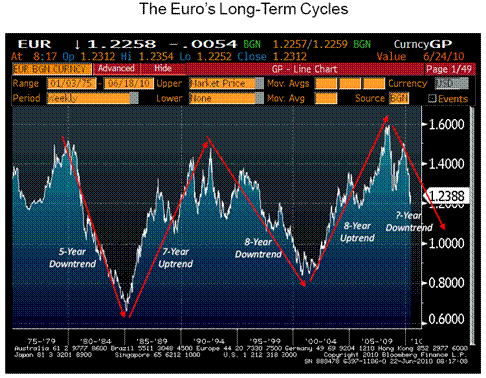
From Bloomberg’s Mike Rosenberg, in FX Market Insights (June 28):
The euro is now two years into what might be another
long-term downtrend. …

From M. Rosenberg, FX Market Insights, June 28, 2010.
…If the historical pattern of long-term
swings were to continue, we might see the euro gripped
in a major bear-market cycle for the next 3-5 years; one
that could conceivably take the euro into deeply undervalued
territory versus the dollar.
Sustained euro weakness will, in my view, complicate gobal rebalancing, but in itself will not halt it. However, to the extent that fiscal retrenchment induces much slower Euro area growth relative to US growth (where question big question marks reside), then successful rebalancing will be much more difficult.
Excuse me, but there was no
Euro 30 years ago
mstahl In the text he says that he used a simulated euro that was constructed from mark, franc, lire, etc. exchange rates.
One may have to include carries trades (euro is in the candidates list for currencies carries trades as it bears low interest rates) Equities,capital investments outflows and inflows (Econbrowser previous posts) are not to be neglected.
It is to be noticed from BIS reports, volumes and nature of the forex operations are far from being in line with trade of goods and services, as currencies swaps are roughly 71 % of the forex activities themselves being eventually one leg of the interest rates swaps.
Daily forex (spot forward FX swaps) in the USA have grown from a daily average of USD 254 billion in 2004 to USD 664 billions usd in 2007 (2010 stats updates are on process) Please see P2 BIS statistics
http://www.newyorkfed.org/markets/triennial/fx_survey.pdf
The daily forex market in UK during the same period has grown to 1389 billion usd per day +80% compared to 2004,where the currencies swaps are predominant, roughly 71 % of the forex activities.
http://www.bankofengland.co.uk/statistics/bis-survey/fxotcsum07.pdf
Is the theory of general equilibrium in troubles ?
The US balance on current account is improving (From ~ – 220 billions usd in 2006/2007 to actual less than – 120 billions usd)
http://research.stlouisfed.org/fred2/series/BOPBCAN
But
The trade weighed dollar index is not a reflection of the CA trend (there are no past correlations between the USA CA and the usd. The usd was appreciating from 1996 to 2002 when C/A was worsening).
Trade Weighted Exchange Index: Broad
http://research.stlouisfed.org/fred2/series/DTWEXB?cid=105
Time to send greetings to the softwares programmers and to the hardwares manufacturers.
Hoping that all back up are in place.
Or we could draw the lines differently and come to different conclusions. The logic has to run something like “if we draw the lines just as I have, and if we assume that the lines represent cyclical rather than structural changes, and if we then bother to come up with some rule describing the cycles so that we can anticipate their period and extent, then we might have some reason to believe my premise, which is that the euro is more likely than not to weaken a good bit more.” Other than serving as an excuse to ponder an earlier stated view about rebalancing, what is noteworthy about eye-balling some lines onto a chart of the euro?
I cannot replicate the relative productivity chart in the Rosenberg presentation. Using real seasonally adjusted GDP and seasonally adjusted total employment for both the US and the euro area I don’t get anything like the profile Rosenberg shows.
Second, although the euroarea is embarking on a fiscal consolidation, surely, so is the US and the US consolidation should be much larger than the euro area’s. The euro area’s deficit is 6% of GDP programmed to fall to 3% of GDP over the next three years (yes, Greece and Spain have larger deficits, but they are a very small portion of the euro area). In contrast, the US has a roughly 11% of GDP fiscal deficit that needs to fall to 3%.