Some people use the end of December as an opportunity for a retrospective on the year. But I decided to take a look back at the last three years, by way of updating some comparisons I made in April 2009 between the Great Recession and the average characteristics of other postwar recessions.
My inspiration at the time came from Bill McBride (as my better inspirations often do). Bill had commented on a typical pattern in recessions that I summarized using the figure below.
|
The horizontal axis indicates the number of quarters since the start of the recession. The vertical axis gives the average percentage change (measured logarithmically) in real GDP or its components from the value at the business cycle peak, with the average calculated across the 10 U.S. recessions between 1947 and 2001. GDP reached a low point on average in the third quarter of the recession, at a value 1.6% below the peak, and was back to its pre-recession value after 5 quarters. Consumption spending tended to be more stable, often showing no dip at all. Investment spending has always been one of the more volatile components of real GDP, with housing construction
down 8% at the trough, but typically rebounding to make a positive contribution a year after the recession began. Business purchases of structures and equipment were on average still 7% below peak even after GDP had returned to pre-recession levels.
The corresponding magnitudes are reported for the most recent recession in the figure below. Note that a change in scale is necessary for both the horizontal and vertical axis in order to accommodate the fact that the last recession was significantly longer and deeper than normal. Real GDP was down more than 4% at the low point and had still not returned to its pre-recession value after 2-3/4 years, though presumably the 2010:Q4 numbers to be reported at the end of January will finally put us back to a new high. The substantial and prolonged decline in overall consumption spending was also unusual. But the real outlier was housing, which was still making a new low 11 quarters after the recession started at a value almost 50% (logarithmically) below its level when the recession started.
|
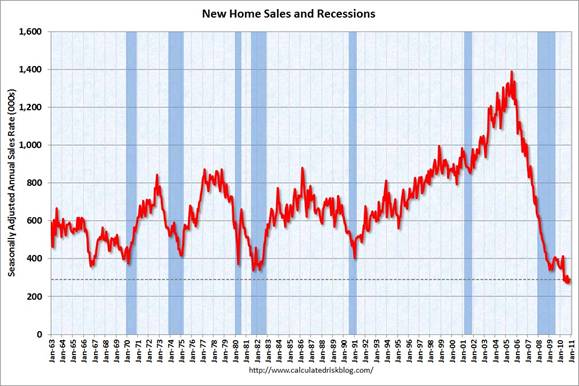
This is not to say that housing alone was responsible for the recession. Although the drop in percentage terms has been pretty spectacular, new home construction had been a relatively modest share of total spending to begin with. Home construction (quoted at a real annual rate) fell by $190 billion between 2007:Q4 and 2009:Q2, whereas real GDP fell by $554 billion.
With home sales bumping along the lowest levels on record, it’s hard to believe they could keep going lower. And any improvement, even to almost-but-not-quite record lows, would allow this sector to start making a positive contribution to GDP growth.
|
Of course, that’s also what I thought last summer.
But fortunately, this time I see that Bill McBride agrees with me.
|
Truly an inspired post.
Don’t supposed you’d like to take a look just for the three oil shock recessions? (’74, ’79 to ’83 (treated as a single recession), and ’08)?
One may assume,the last charts to have already received attention from a cardiologist.
It shouldn’t be hard to imagine housing prices continuing to fall, and if they do, it seems less likely that more new houses will be built.
Calculated Risk would caution you about overhanging foreclosures and the large shadow inventory in housing. Also take a look at his “Distressing Gap” graph which shows that existing homes are outperforming new homes to an unusual degree. Given the size of the inventory after the massive building binge of earlier this decade, it’s easy to imagine this continuing for some time, and so I find it easy to imagine that new home sales could continue to fall.
What disturbs me about his graph here is that new home construction is said to be roughly twice the new home sales figure shown. That doesn’t seem like good news.
JDH wrote:
“This is not to say that housing alone was responsible for the recession. Although the drop in percentage terms has been pretty spectacular, new home construction had been a relatively modest share of total spending to begin with. Home construction (quoted at a real annual rate) fell by $190 billion between 2007:Q4 and 2009:Q2, whereas real GDP fell by $554 billion.”
This point is strengthened when one goes back a couple of years. Home construction at a real annual rate fell by $260 billion between 2005:Q4 and 2007:Q4, whereas real GDP increased by about $620 billion. Most of the massive decline in residential investment occurred before the recession and, notably, without a recession occurring.
Interesting estimates from the IMF,the banking sector in the USA would have written off 55% of the estimated total loss of the world banking sector (P14),its share up to 42% of the total capital funds raised.The banking sector in UK would have written off 12% of the recognized losses in the banking sector, when its share of the total pool of capital raised is 13%. The same study does not specify the total amount of the capital required,save the fact that Basle 3 will only be fully applicable in year 2018.
Source IMF French Banks amid the global financial crisis Yingbin Xiao
http://www.imf.org/external/pubs/ft/wp/2009/wp09201.pdf
My brother sees houses being under-built relative to population growth to such a degree that in the next several years we’ll see home-building pickup and accelerate recovery.
OT:
Uncle George, head of the fiscal watchdog in Hungary, made his speech to Parliament this past week. The government didn’t like it, and they want to get rid of the fiscal oversight function. They are trying to end freedom of the press, too.
The mood in Budapest is much the same as in the middle section of the musical, “The Sound of Music”, in which Captain von Trapp sees the assumptions underlying his world and place in society crumbling. He has begun the transformation from a respected member of society, in the end, to a refugee.
In the three ideology model, this represents the ascendance of a virulent form of social conservatism over a liberal (essentially free market) ideology. A new objective function comes to dominate society.
Economists have traditionally either ignored social conservatism, equating it with insanity (Rothbard), or derided it as ignorance and backwardness (“they get bitter, they cling to guns or religion or antipathy to people who aren’t like them”).
And yet, it is reasonably clear, I think, that social conservatives are on the median voter boundary–well beyond it in Hungary. So we have half the population for which there is no theoretical framework. We know what progressives want, and why. We know what liberals (fiscal conservatives) want, and why. What do conservatives want? Why? Are they all just mistaken? Does conservatism bring them no benefit? Is it all bad?
And when does conservatism cross the line into fascism? When is it just too much? Hungarian PM Orban provides some insight. He claims that key notions for him are “self-awareness” and “power”. By self-awareness, he means knowing one’s own values–national and religious values primarily–and that these are to be ascendant over values derived from market interactions. He’s tired of Hungarians “working for The Man”, in this case, the multinational corporations and financial institutions which dominate the Hungarian economy.
“Power” means that political power takes priority over individual, voluntary interaction. All contracts are ultimately contingent on on-going political approval. This represents the primacy of group rights, as expressed by political leadership, over individual property rights. Not for nothing has the German press labeled Orban the “Putin of the Puszta”.
If Orban is disciplined, then a kind of autarky is possible. More likely for a small, open and not-too-disciplined economy like Hungary is that it will find itself, poorer and weaker, back in the grasp of the IMF within a few years.
And how will the IMF treat it? Will it seek to change the societal objective function? Or will it merely provide additional funding and austerity to serve as a focal point for heightened resentment later? That’s what happened two years ago, when Hungary needed a bailout. A funding and austerity package was brought together with substantial input from an IMF veteran then working for the Hungarian central bank. Yes, it was Uncle George.
The main usefulness of the comparison is to show that the current malaise is not at all like the common postwar experience, and that that experience should not be used as a guide to what is to come. Something forecasters relying on regressions should take to heart.
We are only months away from ingesting another oil shock. We will bounce on and off the bottom for the next decade. The US consumer is debt fatigued and vulnerable to inevitable rate hikes.
Negative net worth (housing collapse) and spiking energy costs will loom heavy in the coming years.
We are not going back to the 1980’s anytime soon.
SpottyBush wrote:
“We are not going back to the 1980’s anytime soon.”
Which part of the 1980s are you most nostalgic about?
Is it the double digit inflation, the double dip recession (with the resulting double digit unemployment), the homelessness crisis (remember the “Black Plate Okies”?), the huge fiscal deficits, the massive trade deficit with Japan, or the S&L Crisis?
JDH,
The significance of the housing sector lies in prices and not construction activity. If new and existing home sales do not pick up materially, the resulting level of home inventory is associated with price declines.
The important thing about housing is not that, “it can’t go down much more,”, but instead that, “prices can go down much more.” The result would be rising credit costs, a falling consumer wealth effect, less access to small business credit/capital, and a headwind for the entire economy.
http://imperialeconomics.blogspot.com/2010/12/s-500-coppock-curve-comparison-to-1870s.html
http://imperialeconomics.blogspot.com/2010/12/s-500-secular-bear-market-coppock-curve.html
http://imperialeconomics.blogspot.com/2010/12/coppock-curves-around-world.html
If the historical self-similar secular debt-deflationary bear market pattern repeats (???), the US and global stock markets will commence another cyclical bear market within an ongoing secular bear market by no later than spring or early summer ’11.
Should the general projection for the S&P 500 conform to the self-similar secular bear pattern, the S&P 500 will fall to the 400s-500s by summer-fall ’13.
Moreover, the associated historical self-similar pattern in terms of economic activity implies that employment, payrolls, and industrial production will fall back to the levels of the mid- to late ’90s, resulting in the industrial production index falling back to the low to mid-70s and employment and payrolls falling 10-15 million, including Boomers leaving the labor force en masse voluntarily and otherwise. A disproportionately larger share of job losses will be in the public sector.
Depending upon how many Boomers are officially counted as unemployed and underemployed hereafter, the unemployment rate could rise as high as 15%+ and U-6 to 25%+.
Gov’t personal transfers (Social Security, Medicare, food stamps, unemployment payments, Supplemental Insurance Income, low-income housing subsidies, etc.) are set to rise from the current 24-25% of private GDP to 30-33% or higher over the next 2-3 to 8-9 years. US gov’t incremental borrowing and deficit spending of 14-15% of private GDP to keep the nominal GDP from contracting will overwhelmingly consist of the growth in transfer payments going primarily to aging, unemployed, unemployable, poor, and sickly Boomers. Thus, there will be little, if any, net incremental gov’t spending for infrastructure, R&D, “education”, etc.
Moreover, US sick care spending has been growing at 8% for over 20-30 years, whereas nominal GDP has grown at just 5% to post-’00 trend GDP of less than 4% and private GDP of less than 3%. There is no mathematical possibility that sick care spending can continue growing at 185% of private GDP. Sick care rationing by the gov’t AND the market is a certainty, reducing the growth of sick care industry revenues, profits, investment, and employment hereafter.
In fact, were sick care spending to regress to the post-’00 trend growth of private GDP, which it ultimately must, there will be no growth of sick care spending for 14-15 years. If the post-’00 trend rate of private GDP growth decelerates further, sick care spending will not grow for 15-20 years and contract along the way.
With sick care spending at 16% of GDP and 24-25% of private GDP, no growth of sick care spending will reduce the post-’00 trend GDP growth rate still further from ~3.9% to ~2.7%, increasing the likelihood that sick care spending will contract over the course of the decade ahead.
Then add the permanent structural effects of Peak Oil (including the continuing 3.2% decline in US domestic oil production per capita) to the debt-deflationary secular bear market, Boomer demographic drag, the associated loss of jobs and production, and the sick care sector ailing, and the US private GDP per capita will continue declining inexorably hereafter.
2011 is increasingly likely to be the year of the “point of mass-social recognition” that there is no “recovery”, there will be no return to the pre-’00 and pre-’07 economic trajectories, and the global economy is entering a permanent decline trajectory, including a path toward local, state, and federal fiscal insolvency and the prospects for declining standards of material consumption for 80-90% of the population.
In spite of all of this, wishing all a Happy New Year (at least for the bears).
Msrk A. Sadowski wrote;
“Which part of the 1980s are you most nostalgic about?”
For me it’s the big hair and super-stylish clothing.
What David Pearson said, with the addition that continuing falling house prices, and the effect on mortgage debt repudiation, will continue to pressure the still weak financial sector.
I recall when Leamer (a respected economist at UCLA) initially dismissed the effect of the crash in housing prices, saying something to the effect that the price was nothing more than a sign on a marquee. My bet at the time was that the effect on the rest of the economy was inevitable and would be big.
1/1/2001 ;;;;; 10165.1 ;;;;; 0.047
4/1/2001 ;;;;; 10301.3 ;;;;; 0.035
7/1/2001 ;;;;; 10305.2 ;;;;; 0.029
10/1/2001 ;;;;; 10373.1 ;;;;; 0.024
1/1/2002 ;;;;; 10498.7 ;;;;; 0.033
4/1/2002 ;;;;; 10601.9 ;;;;; 0.029
7/1/2002 ;;;;; 10701.7 ;;;;; 0.038
10/1/2002 ;;;;; 10766.9 ;;;;; 0.038
1/1/2003 ;;;;; 10888.4 ;;;;; 0.037
4/1/2003 ;;;;; 11008.1 ;;;;; 0.038
7/1/2003 ;;;;; 11255.7 ;;;;; 0.052
10/1/2003 ;;;;; 11416.5 ;;;;; 0.060
1/1/2004 ;;;;; 11597.2 ;;;;; 0.065
4/1/2004 ;;;;; 11778.4 ;;;;; 0.070
7/1/2004 ;;;;; 11950.5 ;;;;; 0.062
10/1/2004 ;;;;; 12144.9 ;;;;; 0.064
1/1/2005 ;;;;; 12379.5 ;;;;; 0.067
4/1/2005 ;;;;; 12516.8 ;;;;; 0.063
7/1/2005 ;;;;; 12741.6 ;;;;; 0.066
10/1/2005 ;;;;; 12915.6 ;;;;; 0.063
1/1/2006 ;;;;; 13183.5 ;;;;; 0.065
4/1/2006 ;;;;; 13347.8 ;;;;; 0.066
7/1/2006 ;;;;; 13452.9 ;;;;; 0.056
10/1/2006 ;;;;; 13611.5 ;;;;; 0.054
1/1/2007 ;;;;; 13789.5 ;;;;; 0.046
4/1/2007 ;;;;; 14008.2 ;;;;; 0.049
7/1/2007 ;;;;; 14158.2 ;;;;; 0.052
10/1/2007 ;;;;; 14291.3 ;;;;; 0.050
1/1/2008 ;;;;; 14328.4 ;;;;; 0.039
4/1/2008 ;;;;; 14471.8 ;;;;; 0.033
7/1/2008 ;;;;; 14484.9 ;;;;; 0.023
10/1/2008 ;;;;; 14191.2 ;;;;; -0.007
1/1/2009 ;;;;; 14049.7 ;;;;; -0.019
4/1/2009 ;;;;; 14034.5 ;;;;; -0.030
7/1/2009 ;;;;; 14114.7 ;;;;; -0.026
10/1/2009 ;;;;; 14277.3 ;;;;; 0.006
1/1/2010 ;;;;; 14446.4 ;;;;; 0.028
4/1/2010 ;;;;; 14578.7 ;;;;; 0.039
7/1/2010 ;;;;; 14745.1 ;;;;; 0.045
=====================
Aggregate monetary purchasing power (our means-of-payment money X’s its transactions rate-of-turnover), fell for 29 consecutive months (which caused the rate-of-change in nominal gDp to consistently fall in tandem during the same time period). I.e., the FED was deliberately (albeit unknowingly), draining liquidity.
Flow, couldn’t rising commodities be the cause of slowing money. It means higher operating cost, higher non-discretionary expenses, and smaller margins and incomes.
Drives up need for savings and risk for investment.