Paul Krugman observes that there are many real side factors that should drive oil prices higher (in an article that cites Jim’s 2009 paper). I certainly don’t have much to add in terms of thinking about oil prices and domestic macro implications, but Krugman’s note did impel me to examine more closely the international aspects of the underlying demand factors.
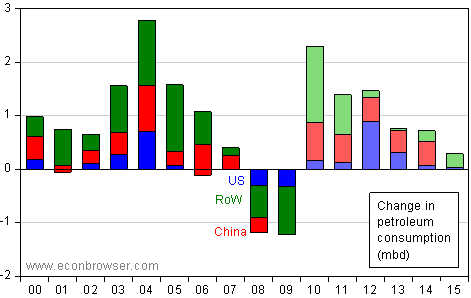
Figure 1 depicts the changes (not percent changes) in oil consumption in millions of barrels per day, by economy.

Figure 1: Changes in petroleum consumption, in millions of barrels per day. Actual data for 2000-2009 from EIA. Forecasts from 2010 onward, from EIA, Annual Energy Outlook, 2011 (preliminary version, December 15, 2010), and author’s calculations. Note: The definition of “rest-of-world” for forecast data is sum of OECD+non-OECD.
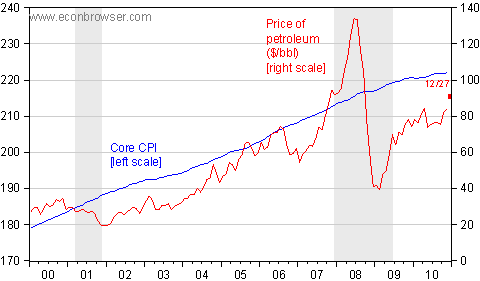
Clearly, in 2008 and 2009, due to the slowdown and then deep recession (which even in September 2008, Don Luskin was still disputing), oil consumption declined. As Figure 1 illustrates, 2010 is a year of rebound in petroleum consumption growth, with Chinese consumption resuming its growth. One interesting highlight is that the pattern that held before the Great Recession, of Chinese consumption growth exceeding US growth, has re-asserted itself. Given the resumption in world consumption, it’s no surprise that prices have re-established themselves since mid-2009, as shown in Figure 2. (For an earlier discussion of China’s role, see this CBO report from 2006).

Figure 2: CPI less food and energy, seasonally adjusted (blue, left scale), and price of petroleum, WTI, (red, right scale). December 2010 observation (red square, right scale) is nearest month futures price as of 12/27. NBER defined recession dates shaded gray. Source: FRED II for core CPI and price of petroleum, and Bloomberg.com for petroleum futures price, and NBER.
Figure 2 also plots core CPI. Clearly, since core CPI has been fairly level since late 2009, the relative price of oil has risen since the depths of the recession. No surprise there (except to note that rising oil prices have not been matched by rising actual cost of living indices, or expectations of accelerating inflation). This last observation is consistent with real side factors, rather than inflationary forces, driving oil prices. (Here’s Jim’s take from mid-2009, a time when people were also worrying about inflationary pressures, as well as his take on QE2’s effect on oil prices.)
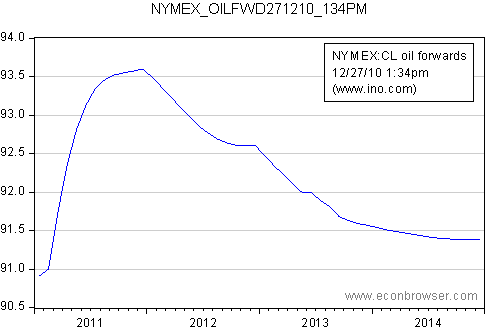
Oil futures do not point to ever higher oil prices. As of today, in fact, while the forward curve is in contango, the futures price three years ahead is only slightly above the nearest month futures price.

Figure 3: NYMEX petroleum futures, as of 12/27/2010, 1:34 PM. Source: NYMEX:CL, www.ino.com. Nearest month futures from Bloomberg.
There are many skeptics of futures as predictors of future commodity prices (or any given asset price). I won’t claim that futures are great predictors (they explain about 6% of the variation in changes in oil prices at the one year horizon); merely that they are, for petroleum, close to unbiased, and are rarely beaten by a typical estimated time series model. [1] [Chinn/Coibion, 2010].
The fact that China figures so prominently in the growth of world consumption is significant, because it highlights the fact that oil prices will depend on trends in Chinese GDP (as well as measures to decrease oil intensity) [1]. The PBoC’s Christmas Day increase in interest rates serves as a reminder of the fact that the Chinese authorities face a challenging task in deflating the asset bubbles and re-balancing the economy without overshooting.[2] (Interesting tangent, on how the yuan fits into the inferred policy mix, here).
It also highlights why one should expect lots of volatility in oil prices. In addition to the uncertainty surrounding the path of the Chinese economy, it’s useful to remember that the short run price elasticity of oil demand (as well as supply) is usually considered quite low. Then small shifts in the demand curve should induce relatively large movements.
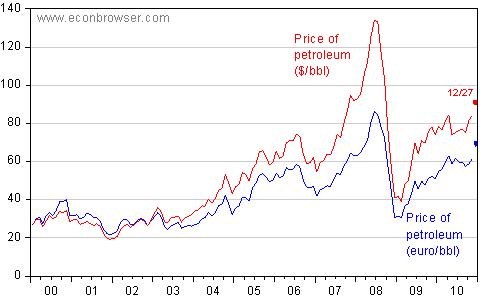
One last observation regarding the monetary/real debate over the oil price resurgence. If indeed oil prices were rising over the past month primarily because of monetary policies in the US, one would expect the oil price change in the US to diverge from that in other economies not undertaking another round of quantitative expansion. Figure 4 shows the price of oil expressed in dollars, and in euros.

Figure 4: Dollar price of petroleum (red), and euro price (blue). Euro price is WTI price adjusted by dollar/euro exchange rate. December 2010 observation pertains to 12/27/2010. Source” FRED II, and author’s calculations.
For the jump in prices during December, I don’t see a pronounced divergence.
Thanks for the informative article. It fits into the new reality of constrained supplies and limited means to adjust to them.
Keep in mind, the Chinese are likely buying crude on the cash market, the open interest in both crude exchanges is much less than 2008- 09.
Crude prices are probably going to keep rising until China imposes capital controls as the dollar carry trade is pushing dollars into China and thence into crude. Rising crude prices are inflationary in China; raising rates to control inflation amplifies the carry.
The thing to watch is the persistence of shortages in China. They are a precursor of shortages elsewhere.
Menzie:
I make a similar argument here.
Oil markets are normally fragmented to a considerable degree, by material and geography. However, it takes only two minutes for some “market rattling” news to spread around the world, and only ten seconds more for initial trades to be executed. So these fragmented markets can coalesce into one world market, almost before one can say “peak oil” !
As a result of the foregoing, crude-oil markets more often resemble a pack of rowdy hound dogs chasing each others’ tails than they do the stable, equilibrium-seeking markets of economic theory. And their future behavior is hard to predict.
If you are uncertain about Chinese oil demand, check out the car production numbers. China is on track to produce 18m cars in 2010 with very few scrapped. Compare that to the US that shrank from 16m to 12m. The scrap rate in the US is close to 12m per year. China already has 60m cars on the road and could reach parity with US in (250-60)/18=10 years! That means China would need 15-20mb of oil per day. Clearly that is not possible. Who will win the gas price war? China or the US? It must hit us sooner than ten years.
These curves are homothetics (see Econbrowser Trade and Credit, Again).IMF in its report “World economic recovery,risk and rebalancing”, underlines the 2010, liquidity driven recovery,where all fundamentals are yet to be in place.The forecast for growth remain sub par in the advanced economies,world growth was seen at 4.8 % in 2010 and seen at 4.2% in 2011.In the same document oil price,is not to outgrow the global economy in 2011 (P21)
http://www.imf.org/external/pubs/ft/weo/2010/02/pdf/text.pdf
The heating oil (a traditional Asian year end market play,usually initiated by July, August. September of each year,a little late this year but made it by November)
http://www.boilerjuice.com/heatingOilPrices.php
Two years heating oil chart
http://www.boilerjuice.com/heatingOilPrices.php
Menzie,
Is the data available to chart the historical contango/backwardation of the oil futures market? I believe the curve might have been similar to today’s in 2007.
Don’t forget that easy money policies by Fed are responded to by Asian central banks. As they in varying degrees endeavor to keep their currencies cheap vs. the US$ & the Euro, they import US loose money policy.
The loose money policies in Asia are undoubtedly adding to the demand for oil there. One should be diffident in any conclusions about oil prices being independent of monetary policy.
BS. Oil prices will drop. The only thing keeping them up is hoarding.
http://imperialeconomics.blogspot.com/2010/10/chinas-gdp-per-capita-global-gdp-and.html
See the link above, particularly charts 3 and 5.
China’s accelerating GDP growth since the ’80s-’90s has brought forward the structural effects of Peak Oil sooner than likely otherwise would have occurred, increasing the likelihood of worsening drag effects on global growth from the higher price of oil, as well as the end of China’s “miracle” sooner than most imagine.
As the US tries to increase exports, so as to increase jobs, there will be continuing downward pressure on wages/incomes, and so…rising energy costs will have a detrimental effect on discretionary spending.
In China on the other hand, wages and incomes can simply rise in step with rising energy costs.
Plus, for the past 30+ years the US has offset its energy costs by recycling petrodollars. This advantage though is waning and possibly coming to an end.
China, is essentially in a position now, because it wants to be free of dollar hegemony, that the dollars it spends on oil are dollars that it wants to be rid of. Stiglitz has described dollar related holdings as “buried” capital for developing nations, and, the Chinese have complained of the same issue regarding how few options they have in how their dollars can be spent. So, to a degree, the Chinese have an oil slush fund of otherwise dubious value.
The point is, as the cost of energy rises going forward, the developing nations are in a much better position than the developed nations due to their lower labor costs etc.. And, the nations that have become the most dependent on gains from lending are in an even worse predicament because the demand for cross-border capital is on a downward trend that must continue to contract as an increasing number of nations develop their banking sectors (see China, Brazil, etc.).
Basically, the demand for existing wealth is at odds with keyboard capital and the so-called advanced nations have hit a wall that is constructed of energy, labor, and health-care costs, and at a time when ‘paper’ solutions are increasingly less viable.
An informative post Menzie, but I have a technical objection. I don’t believe that your conclusion drawn from Figure 2 is valid, namely “note that rising oil prices have not been matched by rising actual cost of living indices, or expectations of accelerating inflation.”
My problem with Figure 2 is that Core CPI’s scale is from 170 to 240 while crude oil’s scale is from 0 to 140. This creates the illusion that the increase in CPI has been greater than the increase in oil prices. In actuality, CPI increased by less than 30% over the plotted time frame while oil has increased by approximately 300% (with a peak increase of approximately 500%).
The price of oil has increased at a faster rate than Core CPI over the last decade. Figure 2 implies the opposite and is misleading.
Fig.2 is intentionally misleading, Kosta is right.
Kosta and Ivars: Perhaps I was unclear, but my point pertained to the period since the end of the recession. So, convert both series to natural logs, and calculate the change since 2009M06. You will find that (in log terms), the core CPI has risen 1.2%, while the nominal dollar price of a barrel of oil has risen 18.9% (by 2010M11). Please refer to the text after Figure 2 which states:
I do not see how I could have been more precise, but if the text confused you, I apologize in advance.
David Beckworth: Thanks, excellent post, which complements the analysis in my post.
Bob_in_MA: I don’t have access to a Bloomberg terminal, so hard for me to generate historical versions of the forward curve on a daily basis (I could do monthly averages).
Bryce: My point was not that oil prices are independent of monetary policy; even if the oil price change is entirely relative, it still could be driven by monetary policy (driving up aggregate demand, for instance). Rather, I would have expected a divergence between oil prices denominated in a currency underoing QE2 and facing incipient inflationary pressures, versus oil prices denominated in a currency not undergoing quantitative easing. To the extent there is a “dollar zone”, I would expect oil prices denominated in currencies associated with the dollar zone to move as with dollar prices.
China, India and other energy intensive/export reliant countries face quite a conundrum.
Rapid growth leads to energy prices rising faster than incomes in the U.S. and Europe, which leaves fewer dollars and euros to drive export growth in China, India, etc.
Even if those countries can shift to a more domestic consumption driven economy, from export driven growth, rising incomes will increase demand for cars, homes and energy.
Either way, U.S. growth stagnates due to energy price inflation and the standard of living falls as a larger and larger share of disposable income is devoted energy. Any short run burst of U.S. economic activity in the next couple of years only makes the energy problem worse.
This has a direct impact on fiscal strategies in the U.S. and Europe. It will not be feasible to support an expansion of government social programs with higher taxes. The only avenue remaining is to reduce the growth rate of government spending to a level below the growth rate in GDP (at a minimum).
We will face some tough choices in the next decade+. I don’t think there is a viable way to increase tax revenue as a percent of GDP, given long term stagnant gdp growth. I expect we wil see cuts to government services at all levels of government.
Menzie,
Thank you for the prompt reply and for emphasizing that you were referring to the period since late 2009, I appreciate being corrected.
I still find Figure 2 troubling in that the choice of axes suggest similar rates of growth of for Core CPI and oil prices over the last decade. Now that I have reread what you wrote I understand that this is not your claim, but when I look at Figure 2, that’s the conclusion I draw. Perhaps I just need to read more carefully in the future. Thank you for responding to my comment.
tj This has a direct impact on fiscal strategies in the U.S. and Europe. It will not be feasible to support an expansion of government social programs with higher taxes. The only avenue remaining is to reduce the growth rate of government spending to a level below the growth rate in GDP (at a minimum).
Not following you here. Government spending is a rather large component of GDP, so if you “reduce the growth rate of government spending to a level below the growth rate in GDP” then you are also reducing the growth rate in GDP unless there is some offsetting increase in “C” or “I” or “NX.” Now if energy prices increase, then it’s a bit hard to argue that we should expect “NX” to increase. So do you think a rise in oil prices will stimulate an increase in real consumer or investment demand?
Look, what you’re talking about is a supply side shock and there is no particular reason to claim that supply side shocks must lead to lower government spending as a percent of GDP. You could argue that oil supply shocks are a good reason for govt subsidies in education, basic research, mobility infrastructure and energy conservation. The best strategy for dealing with supply shocks is to encourage investment strategies that emphasize elasticities of substitution.
“Bryce: My point was not that oil prices are independent of monetary policy; even if the oil price change is entirely relative, it still could be driven by monetary policy (driving up aggregate demand, for instance).”
How about low interest rates allowing for financial asset speculation? Or, as long as wages don’t go up but financial assets do for the rich and the bankers, the fed doesn’t care about anything else?
Peak Oil Anybody ???
Krugman’s piece wasn’t named “The Finite World” for nothing …
The IEA declared peak oil this year in fact and remarkably that it occurred in 2006, over 4 years ago …
Peak Oil Primer (well worth the read)
http://www.energybulletin.net/primer.php
Menzie wrote:
If indeed oil prices were rising over the past month primarily because of monetary policies in the US, one would expect the oil price change in the US to diverge from that in other economies not undertaking another round of quantitative expansion. Figure 4 shows the price of oil expressed in dollars, and in euros.
Oil is priced in dollars. Such a comparison as this graph factors in the price of oil and the exchange rate difference between euros and dollars. It is such a hodge podge of factors that is has little meaning.
Menzie wrote:
Figure 2 also plots core CPI. Clearly, since core CPI has been fairly level since late 2009, the relative price of oil has risen since the depths of the recession. No surprise there (except to note that rising oil prices have not been matched by rising actual cost of living indices, or expectations of accelerating inflation).
Actually the rising price of oil is no surprise if you understand that oil is a factor of dollar value. Most understand that prices have been held down by economic factors, especially related to unemployment and reduced demand. But as Menzie notes oil does not follow the trend.
Correlation of oil with Chinese GDP if not because of cause and effect between the two. It is because both are dependent on the US economic climate and the value of the dollar (renminbi virtual peg).
If you want to understand the price of oil study the price of gold.
Rising commodity prices decrease discretionary disposable income. This creates uncertainty and drives up the need for savings, slowing money down.
2slugs,
Sorry for the lack of clarity. All I am saying is that if Income growth is stagnant due to high levels of energy price inflation, then it will be very difficult (politically and economically) to raise taxes. In that scenario, any tax increase will run the risk of tipping the economy into recession. On the other hand, cutting government spending will be the politically and economically feasible choice, even though it also runs the risk of tipping the economy into recession.
This paper, http://www.economics.harvard.edu/faculty/alesina/files/Large%2Bchanges%2Bin%2Bfiscal%2Bpolicy_October_2009.pdf,
and a piece in today’s WSJ, http://www.aei.org/article/102945 ,
study international historical episodes of fiscal rebalancing and find strong support for the idea that the most successful approach to solving fiscal imbalances is to put most of the weight on spending cuts rather than tax increases.
Like it or not, I think that is the direction in which we are headed.
TJ,
I’ve read the Alberto Alesina and Silvia Ardagna paper and it seems to me to be not very relevant to our current situation for the following reason.
Of the 91 incidents of fiscal expansion it considered, only two occured during a financial crisis when fiscal expansion might be most effective: Japan in 1998 and Sweden in 1992. Reading how Alesina and Ardagna selected the countries, the time period and then identified episodes of fiscal expansion it seemed to me that they were cherry picking cases where fiscal expansion would be least effective.
Perhaps of greater relevance is an IMF study on the effect of banking crises on medium term output (seven years from the start of the crisis by their definition). It’s contained in chapter four of their April 2009 “World Economic Outlook.” In particular they examined medium term output performance following 88 banking crises that occurred over the past four decades across a wide range of economies, as well as the behavior of world output following major financial crises going back to the 19th century.
Among other things, they found that a stronger short term fiscal policy response (a larger increase in government spending) was significantly associated with smaller medium term output losses. In particular the results implied that raising government spending by 1 percent of GDP was associated with a reduction in the medium term output loss of about 1.5 percentage
points.
In short, the research suggests that fiscal austerity (cutting spending) in the wake of a financial crisis is highly counterproductive as it leads to reduced output, reduced revenue and even larger deficits.
I also find the evidence in support of a current or future negative supply side shock to the US economy to be incredibly wanting. Disinflation doesn’t usually accompany such shocks.
So political considerations aside, I think 2slugbaits is on pretty solid economic ground.
tj: I’ve previously noted the fragility of the Alesina-Ardagna results. See the IMF October 2010 WEO chapter on the subject of fiscal consolidation.
Krugman makes many valid points, but to say that our expansionary monetary policy does not impact commodity prices is rather misguided. Monetary growth has fueled the explosion of (largely) U.S. based futures markets. The continuous commodity index as well as the CRB RIND are both at record highs. While we have seen a structural shift in world demand to the developing world, U.S. monetary policy is one of the primary driver of base commodity prices. Earlier this year, when U.S. monetary growth was negative by many measures, commodity prices were falling. The structural issues don’t change, monetary policy does. Commodity prices react.
China is not only buying oil, it’s also buying Oil Assets, from US Oil companies as well as BP.
Speaking of Europe, Brent crude has been trading at a premium to WTI lately. Don’t know what this means, it’s hardly unprecedented, but it seems unusually persistent this time. It’s a bit reminiscent of 2007.
Menzie and Mark,
My point was that over the next few years the U.S. will go through a fiscal re-balancing. Your points regarding fiscal stimulus are another matter.
If I understand your stance, it sounds like you are advocating tax increases alone to solve our fiscal problems.
Correct?
Food prices might be pretty flat since last year, but they’re still up some, and more importantly they are up more than disposable income and inflation.
When I looked at the BEA data on personal income and consumption expenditures two months ago, this is what I observed:
Incomes were pretty flat for the broader population for quite a while and prices kept rising. We saw a big spike and prices dropped when everything melted down; however, I think we never returned to pre-2005 trend price levels or prices relative to disposable income after non-discretionary expenses.
tj: No, my point was a technical clarification — that contractionary expansions is not as widespread a phenomenon as one might think; and that the US in 2010 does not face the requisite pre-conditions.
Further, I suspect your question is rhetorical, as I made my points about fiscal sustainability in this post, which you commented on (7/6/2010, 10:33AM). Reductions in the trend growth rate of entitlements, particularly health-related, are essential.
—Reductions in the trend growth rate of entitlements, particularly health-related, are essential.—
Means cutting doctors pay, which then has to also correspond with a reduction in med school costs (or few will want to be a doctor). Which will mean pressure to reduce tuition and education costs across the board.
Unwinding the credit society is politically impossible at this point, though the credit society is a reflection of US competitive weakness relative to its position in 1948.
So, if developing markets’ (particularly Chinese) demand for liquids is going to grow substantially, and liquids supply is going to grow much more slowly, and the mechanism for making up the difference is liquids demand restraint by price in the OECD (particularly the U.S.), then:
How much would a rebated (per capita) gas tax reduce the drag on GDP of the inevitable price increase at the pump?