One of the economic indicators to which we frequently call attention is the Aruoba-Diebold-Scotti Business Conditions Index that is maintained by the Federal Reserve Bank of Philadelphia. This uses a number of important economic indicators immediately upon release to get an updated view of the overall level of economic activity. One question that arises in using this index is that the raw data from which the index is constructed can be subject to considerable revision in subsequent data releases. A new analysis by the authors takes a look at this issue.
The ADS index is constructed to have an average value of zero, and a value below -0.8 is a warning that a recession may have begun. It currently stands at 0.26, comfortably above average, though not as strong as we might expect and hope for at this point in the cycle.
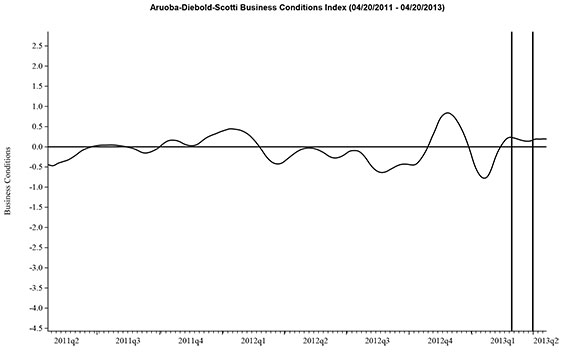 |
By the nature of the statistical inference, the more indicators are available, the more reliable the inference becomes. The ADS index uses whatever is known at the moment to construct a retrospective assessment of where the economy’s been over the last few years. The terminal point in the above graph corresponds to January 15, based on the initial unemployment claims for that week that were released last Thursday. Inferences for January 8 make use of both the most recent and the previous jobless claims reports. The right vertical line in the above graph is drawn at the date for which two different releases were available to form an inference. The left vertical line represents the date for which all the data series used by the index are now available to form an inference.
Although we say we have used “all the data” for the left vertical line, these are based on numbers such as the December nonfarm payroll employment estimate which we know is going to be revised at the beginning of February. How different is the inference if we use the data as originally released compared with the data as subsequently revised?
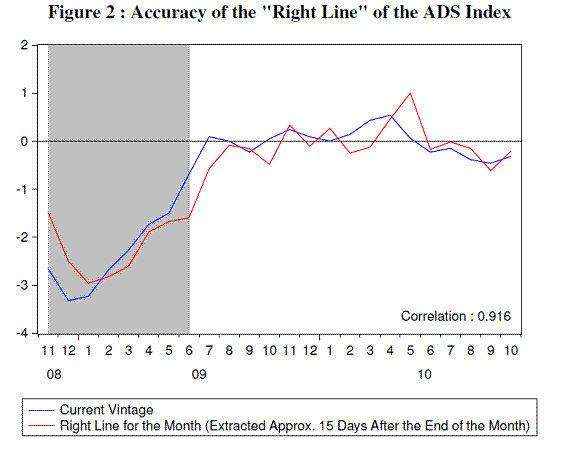
In a new note the authors looked at this question. The blue line in the graph below indicates the two-indicator inference (that is, the value of the ADS index corresponding to the right vertical line for any given date) using data as they have ended up subsequently being revised. The red line in the graph shows the two-indicator inference as it was actually reported by the Federal Reserve Bank of Philadelphia at the time. The result of this exercise suggests that the real-time inference (the red line) is actually pretty reliable, even though some of the raw data themselves are subject to significant revision.
 |
Assuming this chart is pretty reliable, it is still not real time as it is from 10 days ago, i.e. Jan 15th. When will it get updated next (at the website of Federal Reserve Bank of Philadelphia)? Do you know anyone who actually uses it?
Anonymous: Yes, it is real time. There is a difference between the date that data are released and the period in time to which the data refer. For example, the unemployment claims number that was announced to the public on Jan. 20 refer to the unemployment claims that were actually made the week ending Jan. 15. We have not had new data releases since the Jan. 20 unemployment claims. That is why even though the chart only goes through Jan.15, it is perfectly up to date, and is updated within an hour or so of any new important data release.
Seems to be a nice coincident indicator.
You squashed discussion by preemptively addressing the government-misinformation-by-continuous-downward-revision conspiracy theory.
Next time, sit on the second plot, so we have sufficient time for irrational discourse.
Correlation is close to perfect.The ADS missed the day, when the international trade broke down.
It is oblivious to the management of expectations.
In a normal world, the model should make a career.
From a trader’s point of view there are some worrying short-term divergences. But since the market isn’t watching this indicator, I suppose one can take it as an indication of the current state of knowledge about the current and past business environment (so is more useful as an indicator of newsflow than reality). It would be helpful if the chart on the FRP website had both the original and the revised lines, in order to capture in a simple way revisions to the past as well as changes in the present.
Does anyone know if it has a Bloomberg ticker?
Nice indicator indeed. Recently born economic indicators are approching real time more every day. I hope regulators and politicians use them wisely.
How I miss we had some like this in Europe!
John, I think its Bloomberg ticker is ADS BCI
Thanks Alberto — spot on. On a 6-month view it captures pretty much what the market seemed to think was happening.