I thought it useful to take a look at a few retrospective macro indicators pertaining the December 2010, three years after the beginning of what some term “the Great Recession”. In particular, recall that some observers were, even ten months into the recession, and a month after Lehman’s collapse, denying the possibility of a truly deep loss in employment, and the idea of a lack of credit availability.
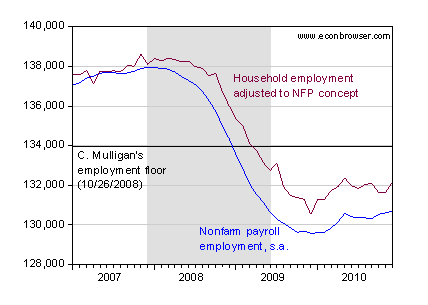
Figure 1 depicts the level of nonfarm payroll employment (blue line), and civilian employment series, adjusted to a nonfarm payroll employment concept (research series, not official).

Figure 1: Nonfarm payroll employment(blue line), and civilian employment series adjusted to NFP concept (purple line), both in ‘000s, seasonally adjusted. Casey Mulligan’s 10/26/2008 predicted floor at 134 million (solid black horizontal line). NBER defined recession dates shaded gray. Source: BEA, December employment situation release).
It’s clear we have only started to dig ourselves out of a very deep employment hole. This characterization applies even if one appeals to the civilian employment series adjusted to conform to the NFP concept that many conservatives thought was a better indicator of the labor market than that provided by the standard establishment survey. That series is higher by 2 million, and rising much more rapidly than the establishment series; however, due to the higher volatility of this research series, one would not want to make too much of this divergence in growth rate. In both cases, employment fell far below Professor Casey Mulligan’s 10/26/2008 declared floor on employment of 134 million.
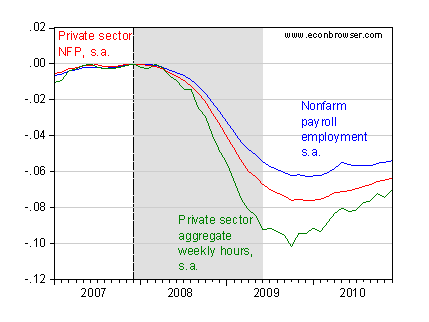
While nonfarm payroll employment growth is lackluster, it is notable that private sector employment is growing faster, and private sector aggregate hours even faster, albeit (both) from lower bases.

Figure 2: Log nonfarm payroll employment(blue line), private employment (red line), and aggregate weekly hours (green), seasonally adjusted, rebased to 0 at 2007M12. NBER defined recession dates shaded gray. Source: BEA, December employment situation release), NBER, and author’s calculations.
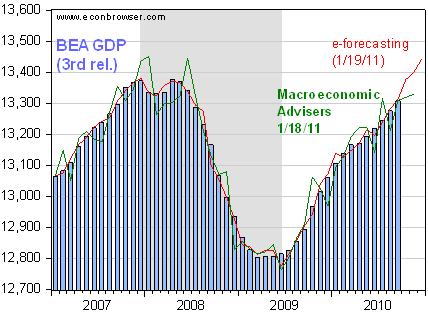
Finally, we shall get a snapshot of the overall economy on Friday, when the advance release for 4th quarter GDP is reported. High frequency indicators diverge.

Figure 3: Official quarterly GDP (blue bars), monthly GDP from e-forecasting (1/19 estimate, red line), and monthly GDP from Macroeconomic Advisers (1/18 estimate, green line), all in billions of Ch.2005$, SAAR. NBER defined recession dates shaded gray. Source: BEA, 2010Q3 3rd release, e-forecasting, Macroeconomic Advisers, and NBER.
GDP seem to continue growing, although at a slower rate than one might expect from such a deep recession (but probably in line with a recession coincident with a financial crisis). Of course, it would have been much worse without the stimulus package passed in February 2009. [0], according to the CBO. One mystery, alluded to in Leonhardt’s recent NYT article, is why GDP has grown at a pace so much faster than employment.
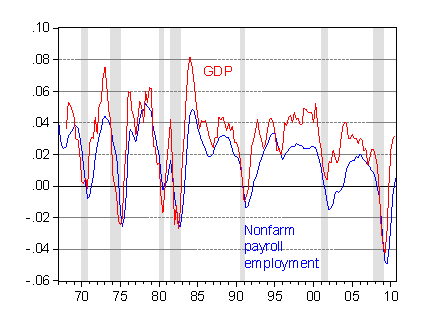
Those who cite this as a puzzle of the recent recovery are somewhat off the mark. A substantial divergence between employment and output growth has been the hallmark of the last three recovery (1990’s, 2000’s, and ther current episode).

Figure 4: 4 quarter growth rate of nonfarm payroll employment (blue), and 4 quarter growth rate of GDP (red), both calculated as log differences. NBER defined recession dates shaded gray. Source: BLS, BEA, and author’s calculations.
A more detailed look at this employment/gdp issue was provided by Jim a few weeks ago. The fact that this pattern shows up in previous US recoveries suggests that the phenomenon is not specific to policies adopted by the Obama Administration. The fact that the GDP-employment growth is not as pronounced in other countries with, arguably, greater unionization or labor power, further suggests that the ability of labor to wrest high wages is not the source of the divergence. So the puzzle remains; for some informed speculation, see [1] [2].
It is interesting to note that the recovery is a little over $500 billion and that the deficit has increased by $1 Trillion. According to the formula for GDP, a $1 of government spending adds a $1 to GDP. Without the increase in the deficit would we be below the low of the recession? In any case it more than accounts for the reason that GDP is not measuring the “real” recession; especially in the job market.
Indeed they were, and such commentators tended to substantiate such claims with actual real-world experiments, in which they applied for credit for their reasonable business expansion plans, and were told by their banks (which were smaller or credit unions) that it would be “no problem”, since such lenders “didn’t get involved in all that fancy stuff like the bigger banks”. These real world tests of credit availability — the ease with which *viable* businesses can get credit — were roundly ignored.
See, no one was denying that it was harder to get credit for shoddy, reckless business plans. But no one loses sleep over that. However, the economists bemoaning the drop in loans, the same ones who want to massively jack up the amount of lending going on, are indifferent to whether the lending oppportunities are any good — they just want to get that money lent, even if it’s to shoddy projects that will end up just wasting real resources.
Because we have to keep the metrics up, no matter how irrelelvent they’ve become.
So this is just a run of the mill recovery by most measures other than the starting point. Any predictions on future growth vs. double dip?
“substantial divergence between employment and output growth has been the hallmark of the last three recoveries” What did you expect?
Lending by commercial banks is inflationary. Lending by intermediaries is non-inflationary.
The DIDMCA created the legal framework for the addition of 38,000 more commercial banks to the 14,000 we already had, and in the process, the abolition of 38,000 intermediary financial institutions.
It is a fact, the FED’s technical staff thinks that the member banks pick up savings & pass them out the window. “Reserve requirements represent a cost to the banking system.” & “Current Estimates of the Reserve Tax”, etc.
The slowdown was predictable & it was predicted (in June 1980).
Menzie: “Of course, it would have been much worse without the stimulus package passed in February 2009”
ARRA was passed in February, but that is not that long after the passage of the TARP. Given that the two programs were of comparable size, but obviously were affecting the economy through different channels, is there any way to distinguish their putative effects on the recovery?
The Financial Crisis Inquiry Commission will release its conclusions on Thursday as a 576-page book.
But it is obvious that they will miss the most important error…the Keyneisan training of the FED’s technical staff that instructs economists that interest is the price of money, not the price of loan funds…whereby it was thus decided that the money supply should be controlled thru the manipulation of interest rates.
The Keynesian liquidity preference curve (the demand for money) is a false doctrine & was invalidated by Alfred Marshall, the Cambridge economist:
Money thus is truly a paradox – by wanting more, the public ends up with less, and by wanting less, it ends up with more. All motives which induce the holding of a larger volume of money will tend to increase the demand for money – and reduce its velocity.
Picking on Mulligan like this may be a “cheap shot”, but it is hard for me to come up with anyone more deserving of one.
“Money thus is truly a paradox – by wanting more, the public ends up with less, and by wanting less, it ends up with more. All motives which induce the holding of a larger volume of money will tend to increase the demand for money – and reduce its velocity”
Incorrect. By wanting more money, the public will either by nature or availability, seek that money. Hence, velocity cannot be reduced naturally. Your trying way to hard and your “training” is suspect.
Offshoring and Outsourcing!!
It would be interesting to see a version of Groshen and Potter (2003) (http://www.ny.frb.org/research/current_issues/ci9-8/ci9-8.html) updated for the most recent recovery; perhaps such work has already appeared. I wouldn’t be surprised if their key findings are confirmed by recent experience: (1) most job losses during the Great Recession turned out to be permanent job losses, as opposed to temporary layoffs; such that (2) most of the current (painfully slow) increases in employment are due to new positions, not rehiring. The predominant lack of temporary layoffs followed by rehiring appears to be a key common feature of the past three recessions; earlier post-WWII recessions were significantly different in this respect.
Is the GDP growth payroll growth a mystery at all? By plotting GDP and payroll growth on the same axis, one is implicitly assuming zero labour productivity growth. Put employment growth on the rhs axis, adjust the scale up by say 1.5% (assuming 1.5% labour productivity growth, thereby putting 1.5% GDP growth against 0% employment growth)and the relationship between private sector employment growth and GDP growth is very good and shows no obvious divergence. The fit can be improved. As GDP growth is more volatile than employment growth and tends to lead employment growth, it is worth plotting the % yoy griwth rate in employment against the qoq annualised growth in private sector employment. If this is done the relationship is excellent. In your view what is the mystery that requires explanation?
“Weekly Initial Unemployment Claims increase sharply to 454,000” From CR.
The 4% threshold for oil is currently $86, and we were above that most of December. Are we sure that we’re not energy-constrained on re-employment?
Better than dead wrong impacted indoctrination. I already cracked the code, what’s your excuse?
Alfred Marshall, Money, Credit, & Commerce (London: Macmillan, 1923), pp. 44-45. Among other British economists who have taken this approach are A.C. Pigou, & D. H. Roberttson. Leon Walras, founder of the “mathematical school,” based his monetary doctrines on the concept of the amount of cash people “wish” to hold.
Alfred Marshall, the Cambridge economists, is responsible for developing the cash-balances approach to money. For example, if individuals collectively desire expanding their cash balances (increasing the period over whose transactions purchasing power in the form of money is held), they will initiate a chain of events which will lead to a net reduction in their aggregate holdings of cash. That is, an over-all increase in the demand for money leads to falling prices, a decline in profit expectations, reduced borrowing from the banks — and therefore a smaller volume of cash balances.
Total hours worked are up 3% from the trough in October 2009. Real GDP is up nearly 4% from the trough. The difference can be accounted for by the rise in productivity. So employees are working longer and harder, which is not surprising given the severity of the downturn. Employers are reticent to hire, prefering to boost hours in case the recovery stalls.
Overtime hours worked are also up sharply, hovering close to pre-recession levels as of December 2010. Rising overtime hours usually presage rising employment. Look for m/m payroll gains to average closer to 200k in 2011.
Dr. Chinn,
Below is a post I ran across from Dr Randall Parker’s blog
(http://randallparker.blogspot.com/)
This gives an interesting analysis of the stimulus spending and its impact.
(http://www.commentarymagazine.com/viewarticle.cfm/where-did-the-stimulus-go–15610) .
I appreciate the time you and Dr. Hamilton put into econbrowser.
Silas Barta: Let me get this straight: you are saying that credit was not at all harder to get for firms that were going concerns? I would welcome some link to data sources, as opposed to mere recounting of unsourced anecdotes.
Robert Bell: It would be difficult to disentangle the effects. But you can see what Blinder and Zandi estimated here.
Phil Rothman: I agree that this would be interesting to see; maybe I can ask. These questions are so interesting, that we are having two conferences at UW this spring on the topic of long term unemployment.
Michael Biggs and Anonymous (7:53AM): I agree that there’s no mystery from an accounting standpoint. If dY = dN + dZ, dY is GDP growth, dN is employment growth, and dZ is productivity growth, then why has the share allocated to dN has shrunk during recessions and early in recoveries (this is related to the discussions by DeLong and Krugman).
Here is a loaded question for someone to research and answer that will make a thoughtful person pause.
What was the unemployment rate during Weimar Germany’s hyper-inflation?
Ricardo: Is this a serious question? Anybody who knows the Accelerationish hypothesis (i.e, read an intermediate macro textbook) would not be surprised at the unemployment rate during the Weimar Republic’s hyperinflation.
Anon,
Knowing that hours have not risen as fast as output does not, by itself, tell us that workers are working longer or harder. The composition of the employment could have changed. That is thought to be a significant component in the rise in US productivity in recent decades. Low productivity jobs are sent off shore, thereby raising US productivity in aggregate without any necessity for the productivity of individual jobs still in the US increasing. We simply lop off the low end of the sample to raise the average. Now, longer hours and technology and all the rest may certainly be at work, but we can’t conclude that just from looking at hours and output.
Menzie,
Your answer tells me that you assume you know the unemployment rate during the Weimar Germany hyper-inflation but you really don’t.
We tend to try to ascertain the big trend of the big picture and seem to miss the point that the U.S. economy is highly fragmented geographically and by state politics.
Here in Michigan, the nascent automotive recovery has barely dented the huge unemployment mass and the housing market remains non-existent. A new governor is attempting to float dozens of trial balloons hoping one or two might float the economy a little higher.
The fact seems to be that states such as Texas and North Dakota and Alaska have done fairly well by ignoring the politically-correct nonsense coming out of Washington and creating an energy-friendly, business friendly, lower tax environment for economic growth. I have to admit that Virginia has achieve a similar result by hitching its wagon to the growth of the federal government, but only in northern Virginia.
The indisputable fact is that tax policy, energy policy, trade policy, and billions of wasted tax dollars spent on temporary make-work jobs and subsidizing market losers has now taken the U.S. out of a recession [according to Washington] and into a Japanese-like lost decade.
Ricardo: 30% at peak inflation.
Based upon monetary flows HOUSING BOTTOMs in JAN. Of course the Case-Shiller index is a 3 month moving average – so its bottom will come a month or two later.
“This index family includes 20 metropolitan area indices and two composite indices as aggregates of the metropolitan areas. The composite and city indices are normalized to have a value of 100 in January 2000”
MVt peaked in Feb 2006. Case-Shiller then peaked in the 2nd qtr 2006 @ 189.93 (because of the 3 month average).
Options and futures based on Case–Shiller index are traded on the Chicago Mercantile Exchange.
“Knowing that hours have not risen as fast as output does not, by itself, tell us that workers are working longer or harder. The composition of the employment could have changed. That is thought to be a significant component in the rise in US productivity in recent decades. Low productivity jobs are sent off shore, thereby raising US productivity in aggregate without any necessity for the productivity of individual jobs still in the US increasing.”
If in aggregate people are selling too much rather than buying, it behooves others to follow course to sell more assets before the prices fall even further. This exacerbates the price-fall.
With real prices falling because the efficiency of holding liquidity is increasing, savings and investment both fall. This aggregate *inefficiency* causes the marginal product of labor to fall. When wages are sticky, this leads to unemployment, particularly of low-wage jobs that can be more easily out-sourced to countries with lower wage rates than ours. I therefore agree with Dr. Chin’s analysis about that. Layoffs and outsourcing can easily explain what appears to be statistical stability or even increases in labor productivity. So during a recession, first there is aggregate inefficiency and only *then* lay-offs.
During a recovery, as is beginning now, there is more buying than selling and prices begin to rise. (The turn-around occurs because prices have stopped falling, but instead have already fallen. Many assets are then bargains to buy relative to money availability. The efficiency of holding liquidity falls.
As real prices rise, it behooves people to buy more rather than sell, to buy things before the price has risen more. With prices rising, savings and investment again begin to increase because of decreased efficiency of holding liquidity. It is this increase of efficiency (people buying assets at lower average prices) that increases the marginal product of labor, with rises in real wages despite price increases. This increased efficiency subsequently leads to more hiring. So increases in aggregate real output (from increased efficiency) as we recover from a recession, then leads to more hiring.
So as we move into a recession, we would expect decreases in employment to follow (in time) falls in aggregate output. And as we move into a recovery (as is beginning to happen now), we would expect hiring to occur *after* increases in aggregate output.
Employment is a lagging indicator of economic recovery.
Anonymous,
Thanks for looking.
Unemployment in the Weimar was almost zero, below the rest of Europe, until the French invasion of the Ruhr. After that all hell broke lose.
But to fully understand you have to realized that, even though there was almost no unemployment before 1923, 20% to 25% of the people were in government employment. They were essentially paid with newly printed marks. Every year following the end of WWI, the mark fell in value so quickly that purchasing power was devastated.
My point is that the Keynesian obsession with unemployment is a blind obsession. Just as the Soviet Union had virtual unemployment, the Weimar Republic has virtual unemployment, but the expansion of the money supply in the Weimar Republic devastated people’s lives. They were working but they could not afford food. They were working but they had no coal to warm them from the drastic winters.
Unemployment must be considered at a much deeper level. A superficial aggregate analysis of unemployment is nothing more than a cute little exercise.
It seems to me that Keynes did a pretty good job of diagnosing the problems looming in the Weimar Republic, well before 1923.
http://www.gutenberg.org/files/15776/15776-h/15776-h.htm#CHAPTER_VI
Why exactly is “non-farm” employment the variable used in such analyses?