The December trade figures were released today. The trade deficit widened a bit, largely in line with the Bloomberg consensus, but a little less than assumed by BEA statisticians. This outcome meant a likely revision upward to 2010Q4 GDP. From Lahart/WSJ RTE.
The advance GDP report that came out last month estimated that the trade deficit would widen to somewhere around $43 billion in December from $38.3 billion. Friday’s reported trade gap was a bit narrower than that assumption — $40.6 billion. That in turn implies a stronger economy, since the U.S. produced more for its own consumption and export than the statisticians supposed.
How much? As a rule of thumb, for every $1 billion the trade deficit narrows, GDP goes up about 0.1 percentage point. So all else equal (and it never is) GDP likely grew at an annual pace of 3.3% or 3.4% in the fourth quarter, rather than 3.2%.
On a slightly different take, The Guardian observes:
The US trade deficit with China has hit a record high, fuelling tensions between the countries over currency imbalances.
The gap between US imports from China and what it sold to the country rose to $273.1bn (£170bn) last year, the largest trade imbalance the US has ever recorded with a single country.…
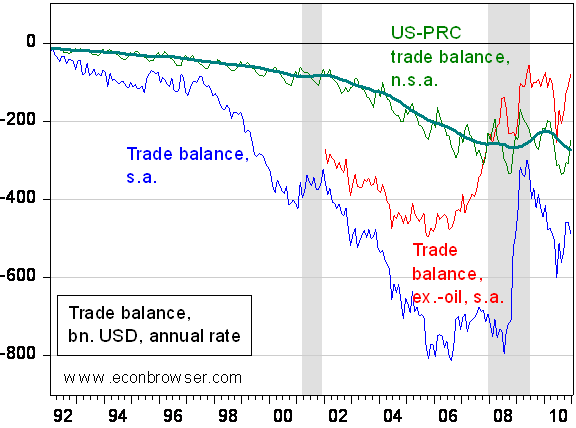
One of the things I learned writing memos was to beware the phrase “record high”. That’s because with economies growing, and price levels on average (although not always) rising, records as a natural matter of course would be regularly made. This places the US-China trade deficit in perspective:

Figure 1: US trade balance, seasonally adjusted (blue), trade balance ex.-oil, seasonally adjusted (red), US-China goods trade balance (green) not seasonally adjusted, and 12 month trailing moving average (teal bold), all annualized, in billions of USD. NBER defined recession dates shaded gray. Source: BEA, December 2010 trade release, and NBER.
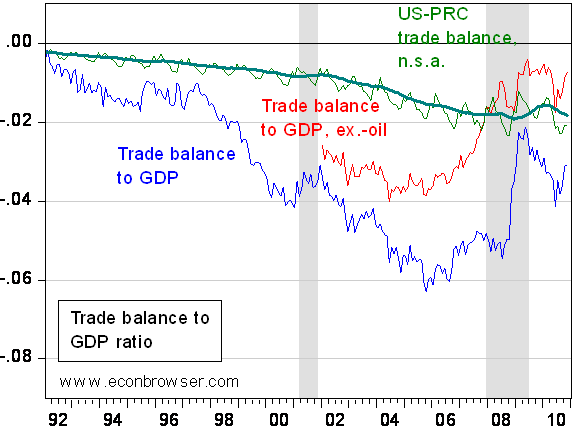
Normalize the trade balance by nominal GDP, then matters look slightly different.

Figure 2: US trade balance, seasonally adjusted (blue), trade balance ex.-oil, seasonally adjusted (red), US-China goods trade balance (green) not seasonally adjusted, and 12 month trailing moving average (teal bold), all divided by US nominal GDP, seasonally adjusted. NBER defined recession dates shaded gray. Source: BEA, December 2010 trade release, Macroeconomic Advisers (January 11 estimate), and NBER.
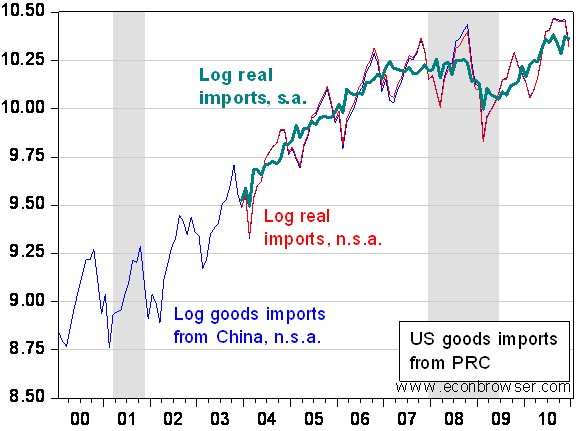
To me, what’s of interest is not just the trade balance, but what is the trend in real imports from China. For that, we need the price deflator; unfortunately, that series has only been calculated since 2003M12. After deflating the series, and applying the X-12 seasonal adjustment filter to the log series, one obtains the following:

Figure 3: Log goods imports from China, not seasonally adjusted (blue), real imports in 2003M12 dollars, not seasonally adjusted (red), and seasonally adjusted (bold teal). NBER defined recession dates shaded gray. Source: BEA, December 2010 trade release, BLS, Export/Import price release, NBER, and author’s calculations.
From 2003M12-2007M01, the growth rate of imports was 22.6%, while it has been only 3.7% over the 2007M02-2010M12 period. It remains to be seen what import prices do going forward. [1]
I suppose it’s comforting to know that the trade balance on a GDP percentage basis is no worse than it’s never been but I wonder what is an appropriate trade imbalance? (Temporally, by nation, or whatever…)
After events in Tunisia and Egypt, caused by 2008 Great recession crisis, and the ones that will follow, do You not see that the probability of a popular uprising in the USA against both Republican and Democratic elites , crony capitalism has increased? The model of informed youth and middle class popular uprising is so obvious for anyone to miss.
The immediate impulse will be economy, of course. The USA economy is over-leveraged to the supreme degree, and it can not continue to withstand external shocks that , of course will continue to come. Increasing USD value because of instability plus increasing oil prices due to instability in oil producing regions. The elites of the USA will not be able to stabilize it by printing more money, because the 2 above factors combined invalidate both export potential and increase trade deficit, eating GDP away.
Who will most likely lead such an uprising, or rather, be a figurehead since such uprisings do not need to be controlled by leaders, as we have seen? Sarah Palin, from where I sit. She has the fighting spirit. The common enemy will be the FED and Wall Street, and government in general. But, and again just look around, not the army and military. Not in increasingly volatile world.
It reads like an open book. The only thing missing is economy tanking, double dip, and Fiscal deficits and FED presses will see that it comes very soon, as well that inflation and instability is exported to the furthest places of American interests on this planet.
From then on, I see no problems for third party take over of Congress, Senate and Presidency.
Which is just in time for 2012 elections.
Excuse, this was political, but since I live in Latvia, am not American, I try to make quite dispassionate observation of rather obvious developments.
Ivars- You have the right idea. People rightfully recognize that our trade policy is lowering living standards and allowing American companies to not reinvest their huge profits on jobs in the U.S. Menzie can say that our trade deficit isn’t that deep, but it leaves out the deterioration of work standards and wages that unrestricted trade has resulted in. And buying a iPods for a few dollars less isn’t going to make up for that to most working-class people.
When you see the attacks on public workers combined with weak, tone-deaf responses to corporate crime and greed, and then see the attempted raid on Social Security, you know this coountry’s banana republic trend will have to be stopped. Now whether that’s at the ballot box in 2011-2012-2013, or in the streets, we’ll find out.
But it sure won’t be Sarah Palin leading it. No one with an IQ over 80 and/or under 40 respects that grifter, especially given that she has no solutions on either the economy or especially trade and plays the Jesus card. I’m guessing you only know small-towners from TV and D.C. pundits if you think she has any nationwide pull.
Think someone like Bernie Sanders or Russ Feingold, or a non-religious Ron Paul, except younger and more telegenic.
“informed youth”
…
“Who will most likely lead such an uprising, or rather, be a figurehead since such uprisings do not need to be controlled by leaders, as we have seen? Sarah Palin, from where I sit.”
This is a joke, right?
Jake,
I am not sure in populist ( popular)anti elite uprisings IQ plays the decisive role. Neither do intellectuals.
Second, once the conditions deteriorate, some of her insights might prove catchy ( drill here drill now) and even Jesus thing might be the American alternative to Islam as people need values to stick with when old ones are being bashed.
What she only needs, is a majority, not integral over voters IQs. A bit like Hitler, in some sense, when crisis hit Germany after 1929. Hitler almost won in free elections in a democratic formerly superpower state and than continued to exercise his popularity in low to middle IQ supporters- middle class in parliament until elected chancellor. Then he got support from big business as an alternative to socialism. Only afterwards he used non-democratic methods to take 100% of power. That was 4 years from crisis, which translates into about 12-20 years for current crisis.
@Igor: Youth is much more informed than ever before. Thanks to Facebook and Internet in general. As are pensioners and middle class. That we saw as decisive factor even in Egypt which has only 20% Internet penetration.
Yes, the trend is interesting. I’d be curious to know the trend in Chinese imports as a percentage of total imports and GDP (USA). Simply to get a better idea of what kind of political challenges these trends could pose.
Increased real Chinese imports should, in theory, increase political influence the USA enjoys over China. Discrete trade barriers tend to hurt producers more than consumers in the near-term. Special interests notwithstanding.
Speaking of unpopular trading partners, the Arabs should eventually experience less popular American wrathe as oil imports decline over the next few years. On the other hand, if the Chinese continue to improve quality control, lower production costs, and learn marketing, they could provoke American ire for years.
Growth in US exports to China looks impressive in this chart
US exports to China
What is this?? Econbrowser’s comments section Ukrainian comedy hour or have some people been watching too much Murdoch/FOX porn???
Bottom line is this: If China lets their currency float freely in the market the trade imbalance will slow down. It won’t stop, but it will slow down. But either way America needs to start rebuilding its non-existent manufacturing base.
How do we rebuild America’s manufacturing base??
#1 : Targeted fiscal spending on things we have advantage in and there is dire need for. You have extreme high unemployment in Nevada, and you have rare earth metals in Nevada. Start a half and half public private Quasi-corporation there so we have independence with our earth metal sources and don’t overpay China for them. Eventually supply our own earth metals and sell to other western democracies.
#2 America may have disadvantage in many things, but we still make clothes. Next time you go shopping at China-Mart (Wal-Mart) and you see a t-shirt or other apparel says made in Bangladesh or made in China, walk on until you find a label says made in USA. Eventually China-Mart (Wal-Mart) will get the idea. Just textiles alone would take off some of that trade deficit. You might laugh at that and say it’s “simpleton”. Maybe it is simpleton…. but at least you can say you did something instead of tell your grandkids you did nothing as your country went down the crapper.
The surprising part to me is how small the “ex-oil” deficit is. I guess I was aware that it was declining a few years ago (when the overall deficit was steady only due to rising oil prices), but I hadn’t looked closely in a while. Also interesting that “ex-oil, ex-China” we run a surplus with the rest of the world. I wouldn’t have guessed that.
Wrong,
the trade deficit which is used to calculate the GDP was $ 46 Billion per Bloomberg. thus, the GDP will be reduced not increased.
mje: Forgive me, but I am impelled to ask “sez who?”.
Hey Menzie-
How about reconstructing Figure 2 as the Trade Balance to Exportable Products ratio…. I’m not sure that the massive investment in the housing inventory from ’97 to ’08, or the pumping up of GDP by federal deficit spending from 2008 to 2011 has done anything to aid the country’s external trading position.
A corollary argument could be made for figure 3. There, the LOG transform lends to the appearance of trade attenuation without any actual reduction, while the price deflator normalization reduces slope of the “bad” trade deficit, while it obscures the obvious disadvantage of a dollar that is continually inflating.
The US-PRC trade balance is deteriorating, and will probably accelerate as China trades more of its exchange surplus for industrial assets in America.
“To me, what’s of interest is not just the trade balance, but what is the trend in real imports from China.”
To me, what’s of interest is not China’s bilateral trade balance with the U.S., but its global balance. Namely, why isn’t China running an overall deficit, since it is growing much faster than ROW?
The recent decline of the dollar has brought some shifting of China’s exports to the euro area, which now imports more from that source than does the U.S.
With the current global AD deficiency, China is behaving very badly, simultaneously taking AD from ROW through currency interventions while undertaking measures to reduce inflationary pressures at home.
to respond to “says who?”
Bloomberg was quoting the Commerce Dept-that agency that released the figures. You do not have to believe me. You can use a obscure tool called the internet to look the Bloomberg article.
mje: Forgive me, but I am looking at Table A of the Technical Notes Commerce’s 2010Q4 advance release, and cannot find reference to the $46 billion figure (not even by dividing the net exports figure by 12).
Nor can I find that figure in the Bloomberg site’s quote of the report. Please advise where you saw this assertion (which is contra the quote from Lahart in my post.
To Whom It May Concern:
Plesae copy the link below to find the $ 46 Billion figure, you shall find the figure in the middle of the article.
http://www.bloomberg.com/news/2011-02-11/trade-gap-in-u-s-widens-for-second-month-as-oil-imports-jump.html
mje: That $46 billion is apparently in Ch.2005$ (the article notes it is adjusted for prices, i.e., real). Lahart was citing a $40.6 billion in nominal dollars relative to the nominal figure assumed by BEA. Without knowing what the exact deflator to be used, I don’t know how you can say Lahart was “wrong”.
Menzie Chinn
You are misquoting the article. The $ 46 Billion figure states “…After eliminating the influence for pricess…” Also, I was arguing that the figure $ 46 Billion should be used not the reported $ 40.5 Billion.
Surprise, Surprise… the Govt REDUCED the GPD estimate from 3.2 to 2.8 %. I think some appology is warranted.