Like a moth to the flame, [1] [2] I am compelled to examine the peculiar aspects of the Heritage CDA forecasts of the economy under the Ryan plan.
Usually, when I look at something longer, I understand more what is going on. In the case of the Heritage CDA simulations of the Ryan plan, it just gets more and more incomprehensible. To illustrate this confusion, consider the following graphs of private employment, equipment investment, nonresidential structures investment and residential investment, under the baseline and as simulated under the Ryan plan.
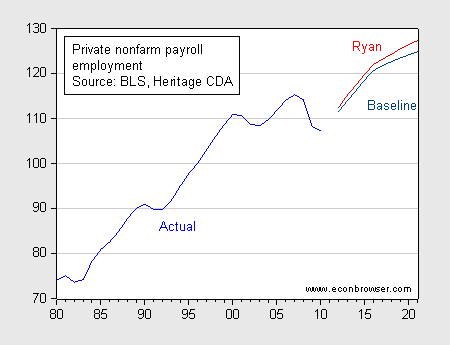
Figure 1: Private nonfarm payroll employment (blue), baseline (dark b lue) and simulated under Ryan plan (red), in millions. Source: BLS, Heritage CDA, Appendix 3.
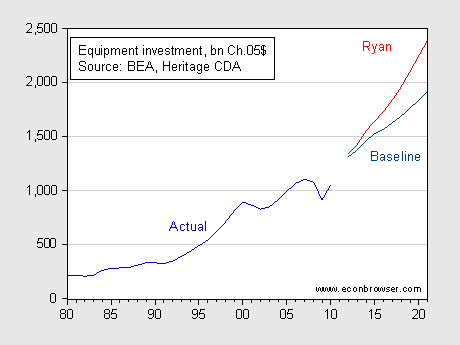
Figure 2: Real equipment investment (blue), baseline (dark blue) and simulated under Ryan plan (red), in bn Ch.05$. Source: BEA, Heritage CDA, Appendix 3.
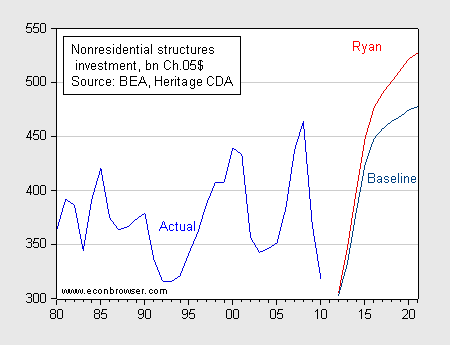
Figure 3: Real nonresidential structures investment (blue), baseline (dark blue) and simulated under Ryan plan (red), in bn Ch.05$. Source: BEA, Heritage CDA, Appendix 3.
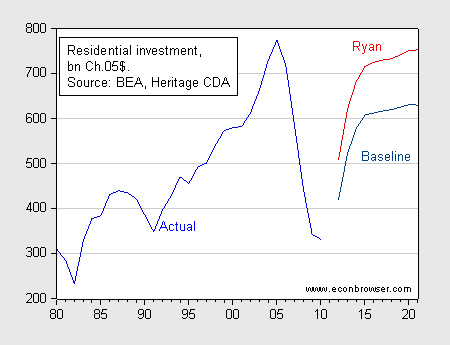
Figure 4: Real residential investment (blue), baseline (dark blue) and simulated under Ryan plan (red), in bn Ch.05$. Source: BEA, Heritage CDA, Appendix 3.
Red Flags! Super-High Implied Elasticities
In my previous post, I highlighted the fact that the implied elasticity was too high to be plausible, using the average simulation period values. After reading some of the documentation regarding the IHS-Global model, [1] in retrospect, I think it might be more appropriate to use the end-of-simulation values, rather than mean, since the elasticity calculations are more relevant in the long run. Essentially, the IHS Global Insight model is a conventional aggregate demand-aggregate supply model with short run price stickiness, but long run Classical characteristics. And so, in order to make the best case for the Heritage CDA simulations, the responses at end of the sample should be more plausible. So, unto the breach once more!
First consider the implied labor supply elasticity, shown in Figure 1. This elasticity is given by the following formula:
η = (∂N/∂ω) × (ω/N)
Where N is labor supply, and ω is the after tax real wage.
From Appendix Table 3 of the Heritage document (as revised 11am 4/6), we have end-of-period (last three years) baseline private nonfarm payrolls at 124.2 million, simulated at 126.5 million; the log difference is 0.0181. The end-of-period baseline personal tax rate is 0.194, and the simulated is 0.186. The log difference in implied real wage is 0.0067. Since I don’t have demand side elasticities, I can assume a perfectly elastic demand for labor to give me the minimum figure for the implied supply elasticity. Hence, substituting these figures into the formula leads to:
2.7 = (0.0186/0.0067)
This figure is still somewhat higher than the authors of the report indicate they are using (a value of 2), which is in turn in the mid-range of the estimates reported by Rogerson and Allenius. 2.7 is smaller than the 5.8 or so I found earlier, using period sample averages, so in that respect, the results are a little less implausible. Nonethelss, as I mentioned before, even this value of 2 is substantially above the CBO’s estimates of labor elasticities (even for second earners).
What about equipment investment. Figure 2 highlights the fact the Heritage CDA simulations imply an incredibly large jump in equipment and software investment. Repeating my analysis using a user-cost of capital analysis. Let log investment-to-capital equal:
ln(I/K) = γ rK
Where the rental cost is given by:
(1-u)rK = (i – πK – d)(1-z)PK
And where u is the corporate tax rate, rK is the rental cost of capital, i is the interest rate on corporate bonds, πK is the inflation rate for capital goods, d is the economic depreciation rate, z is the present discounted value of tax credits and accelerated depreciation allowances, and PK is the price of capital goods. I’ll assume πK, d, and z equals zero (which is okay since they don’t change in the simulation), and the relative price of capital goods at unity. After solving for the rental cost of capital, this leads to:
rK = (i)/(1-u)
The baseline 10 year interest rate is 0.05400 in the last three years of the simulation period, the alternative 0.04661. The current statutory corporate tax rate is 0.35, the rate under the Ryan plan is 0.25. Then the initial rental cost of capital is:
0.08310 = 0.05400/0.65
and under the Ryan plan:
0.06215 = 0.04661/0.75
(I’m assuming a percentage point for percentage point change in the effective corporate tax rate, which is an approximation). So the change in the rental cost of capital is 0.0210.
Now consider the change in equipment investment relative to the capital stock. Under the baseline, average equipment investment is 1.842 trillion Ch.05$, under the Ryan simulation, it is 2.251 trillion Ch.05$. I don’t have numbers for the real capital stock over this period, but for the sake of argument I’ll use the 2009 current cost (nominal) capital stock of 5.611 trillion. (Since the price index for equipment investment goods in 2010Q4 is about 0.975 for 2005=1, this is pretty close to a real magnitude, expressed in Ch.05$.)
Then the log change in the investment-to-capital ratio is = 0.200, (assuming the net capital stock grows by 1% per year in both cases). Solving out for the elasticity yields:
γ = (0.200)/(-0.0210) = -9.52.
This figure is now even more above (in absolute value terms) the short run elasticity of 0.50 cited by Gilchrist and Zakrajsek (2007) (their long run elasticity is about unity). The figure is also much, much larger (in absolute value) than the largest estimate I have found for equipment, of -1.64, obtained by Huntley Schaller (JME, May 2006) using cointegration techniques.
I haven’t worked out the implied elasticities for nonresidential structures, and residential structures, but my guess is similarly bizarre implied elasticities would arise. Figure 4 alone should give pause; it indicates by 2021, real investment in residential structures will be back to near peak levels of 2006.
An Explanation, and Laffer Redux
So, we return to the question of how these very large elasticities come about, when the simulations are from a model that is so conventional. The Heritage Foundation describes the Global Insight model thus:
The Global Insight (GI) short-term US macroeconomic model is a large-scale 10-year (44-quarter) macroeconometric model of the US economy. It is used primarily for commercial forecasting. However, over the years, analysts in The Heritage Foundation’s Center for Data Analysis (CDA) have worked with economists at Global Insight to adapt the GI model to do policy analysis. In simulations, CDA analysts use the GI model to evaluate the effects of policy changes on not just disposable income and consumption in the short run but also the economy’s long-run potential. They can do so because the Global Insight model imposes the long-run structure of a neo-classical growth model but makes short-run fluctuations in aggregate demand a focus of analysis.
Now that I think about the disjuncture between the sheer conventional AD-AS nature of the IHS Global Insight model, and the bizarre output, it seems obvious to me that these paragraphs from the Heritage CDA documentation of the Ryan plan simulations are key to understanding the simulation output:
Labor Participation Rates. Taxes on labor affect labor-market incentives. Aggregate labor elasticity is a measure of the response of aggregate hours to changes
in the after-tax wage rate. These are larger than estimated micro-labor elasticities because they
involve not only the intensive margin (more or fewer hours), but also, and even more so, the
extensive margin (expanding the labor force).
The change in the labor supply variables were adjusted by the macro-labor elasticity of two,
which is a middle estimate of the ranges. The adjustment to the add factors allowed the variable
to continue to be affected both positively and negatively by other indirect effects.
In the final stage of the simulations the add factors were endogenously recalculated in order to
take account of the new estimates of the average tax rates mentioned above.
…
Private Investment. Economic studies repeatedly find that government debt crowds-out private
investment although the degree to which it does so can be debated.26 The structure of the model
does not allow for this direct feedback between government spending and private investment
variables. Therefore, the add factors on private investment variables were also adjusted to reflect
percentage changes in publicly held debt. This can also put upward pressure on the cost of
capital (thus helping the model balance the demand and supply effects on the cost of capital).
To sum up, it’s clear that while the simulations are in part built on the IHS Global Insight model, the output differs so much from what a conventional macroeconometric model with long run Classical features delivers that one can only conclude that the add factors are critical. (This impression is buttressed by the fact that Heritage CDA re-adjusted the natural or structural rate of unemployment — and hence simulated unemployment — without having any reported impact on any of the other variables changing; any model with a standard Neoclassical long run structure like the IHS Global Insight model will not be able to accommodate such revisions.)
Given that the supply responses are implausible, then the tax revenue results must also be questioned. That is because the positive response of tax revenues to reductions in the effective personal tax rate must be driven by the output response, and this is conditioned by the sensitivity of both labor and capital investment to the relevant after tax factor costs in the long term.
In this context, the simulation result that tax revenues are higher relative to baseline at the end of the sample, despite the fact that the effective personal tax rate is lower (Figure 5) makes perfect sense. It is the ultimate manifestation of the supply-side fantasy.
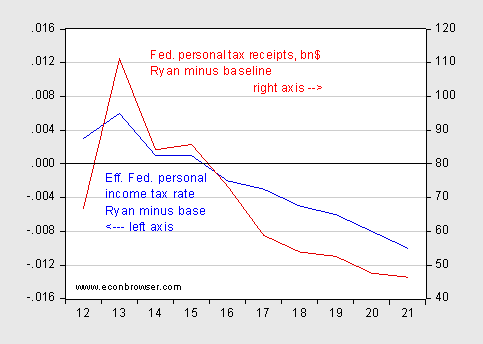
Figure 5: Difference between effective Federal personal income tax rate under Ryan plan and baseline (blue, left scale), and difference between Federal personal tax receipts, bn$, under Ryan plan and baseline (red, right scale). Source: Heritage CDA, Appendix 3.
Epilog: There have not been any really substantive responses to the various criticisms released directly by Heritage, except for this “pre-sponse” which does not address how the unemployment rate could be adjusted without any of the other forecast series being adjusted in a noticeable fashion. For quotes of William Beach’s responses, see: Slate1, Slate2 FrumForum. Here is a Bloomberg article quoting the (limited and skeptical) remarks of IHS Global Insight’s Nigel Gault who oversees the organization’s macro model, which Heritage CDA partly based their simulations on; similarly skeptical remarks in National Journal. Finally, EPI concludes, like me, that the key to understanding the Heritage CDA projections is to be found in the “add factors”. Chad Stone illustrates the original Heritage unemployment forecast (before they were revised into oblivion).
Update, 8:30am Pacific: Bruce Bartlett points me to a Macroeconomic Advisers analysis which documents their sense of incomprehension of the Heritage CDA assessment.
Update, 2:10pm Pacific: The Economist has its take on Paul Ryan’s intellectual hinterland.
This was neat. You sell your soul to do this work at Heritage.
I followed the link to the Bloomberg article that you cited and extracted the following:
“Powering that turnaround is a phenomenon known as an “expansionary fiscal contraction,” in which private-sector growth is unleashed by a reduction in public spending. The theory of expansionary contractions, which advocates say have occurred in countries such as Canada, Sweden and New Zealand, is now a cornerstone of Republican economic policy.
The idea that cutting government spending will so improve business and consumer confidence as to cause an immediate upswing in growth finds little support on Wall Street. “Realistically, most of the evidence leans toward an adverse impact on growth in the near term,” said Michael Feroli, chief U.S. economist at J.P. Morgan Securities in New York.
‘Hit on Growth’
Nigel Gault, chief U.S. economist for IHS Global Insight, the firm whose macroeconomic model was used in a Heritage Foundation analysis commissioned by Ryan, also played down expectations of a quick acceleration. “Normally, you would expect to take a hit on growth,” said Gault, who is based in Lexington, Massachusetts.”
I assume that these are the limited and skeptical remarks that you were referring to. My question is: when has Federal spending ever gone down, thus providing a test of Gault’s conjecture?
Also, unless the spending of the Obama administraion continues to be funded by borrowing, what other options are there other than (a) reduce government spending or (b) reduce private spending (through higher taxation)? Then the question becomes – what is better for growth, government spending or privately directed spending? Leaving aside, of course, the fact that freedom is destroyed by the additional confiscation of private income and wealth.
Rich Berger: The current Federal spending to GDP series (FGEXPND, GDP in the St. Louis Fed’s FRED2 if you are computer-literate) fell in 2010Q4, 2009Q3-Q4, 2008Q3, 2007Q3, 2006Q4, 2006Q1, 2005Q2, 2004Q, 2003Q2-2005Q2 excepting two quarters, 1998Q1-2000Q3, … Of course, other things are going on at the same time. So, man created multiple regression, which entails the minimization of the sum of squared errors defined as the deviation from a line fit through a set of points in hyperspace, of dimension k+1, when there are k right hand side variables. We extract the response of GDP from spending using methods such as OLS, or variations that incorporate multiple equations, such as VARs and SVARs.
Menzie-
Measuring spending to GDP is not the same as measuring spending in $. When you look at FRED quarterly data in $ there appear to be very small fluctuations that give the impression that govt spending is decreasing slightly (especially when you amplify the differences to create an annualized rate). I’m not buying that these fluctuations represent contraction in spending, not at all.
Rich Berger: You’ve got to scale by something. The economy in 2010 is not the same size as it was in 1776 (nor is the price level). What is your alternative? Everything is always to be measured in current dollars?
Agreed, but if you look at annual amounts, spending only goes up. I couldn’t find the constant dollar or % of GDP numbers on an annual basis, but I would be surprised if any of these declined in recent memory (say last 50-60 years).
I don’t care what wall street thinks. I want the market to come down to a level I’m comfortable investing at with the tiny savings I have. Their lack of confidence is what I’m hoping for.
Don’t waste your time, Menzie. Mr. Berger has demonstrated that his ignorance of elementary economics (e.g., the difference between real and nominal variables) stopped at the edge of the swamp when he made landfall.
aaron-
I don’t know how old you are, but if you have tiny savings, I would worry less about the return and more about adding more savings so that your amount is no longer tiny.
I expect a balanced portfolio (60 Equity/ 40 Fixed, e.g.) to earn about 7-8% over the long haul. Unless you want to roll the dice, I would not expect consistently more.
Rich, you’re incredibly optimistic.
http://www.nytimes.com/interactive/2011/01/02/business/20110102-metrics-graphic.html
Median stock markets returns in real terms is a tick over 4%. This is slightly over the median growth rate of the US economy, which is reasonable – in the end you expect the two to be heavily correlated.
So expecting more than 4% over the long haul is a high-stakes gamble (unless you’re thinking in nominal terms again, which are pretty useless).
Balancing your portfolio isn’t a bad idea, but fixed assets will only smooth the ride, not increase the average return.
In the WSJ today (“Obama’s Soak-the-Rich Tax Hikes Won’t Work”, Alan Reynolds 4/14/2011) the author points out that individual tax receipts has averaged around 8% of GDP over the past 50 years despite huge swings in tax rates. Your evidence of the “supply-side fantasy” boils down to the conclusion that the GDP pie is bigger under the Ryan plan (assuming it obeys the statistical regularity outlined). That should be the point of contention, not the result that the dollar value of tax receipts rises.
Menzie,
We don’t agree on politics, but your analysis of the Heritage projections is a valuable addition to the federal debt debate.
Have you been able to take the Obama debt reduction plan and figure out which programs he is cutting and where the actual spending reductions are coming from? It seems like a much more general plan than the Ryan plan. Is there a link that explains the assumptions he is making?
I am not asking for an economic impact study, just the details/assumptions behind the numbers.
I am just so thankful that the heritage foundation has come out with there economic models…
This is a big hit to the republicans… yes!
I have not seen or read much comment on the Ryan plan to privatize Medicare. Were I under 55, say 54, and having contributed the payroll taxes for over 30 years, I would definitely be seeing RED. To think I that I was going to be handed a shi_y voucher, while the wealthy get tax cuts! If the American people understand what Ryan is really proposing, this is the greatest gift since Newt shut the government down. Sorry to say there is so much subterfuge in this new media rich-intelligence poor world we now live in. It remains to be seen.
tj: I haven’t looked for details on where the cuts and revenue increases are located. But those would be tabulated by OMB in a fashion analogous to CBO — that is excluding feedback effects. So most meaningful comparison would be CBO’s assessment of the Ryan plan against the CBO assessment of President’s plan, to be comparing apples to apples. Comparing the Heritage scoring of the Ryan plan against the CBO scoring of the President’s plan would be comparing apples to oranges, since the Heritage scoring incorporates dynamic scoring, i.e., feedback effects — while the CBO scoring does not.
edgolb Several blogs have pointed out that Ryan’s plan is hopelessly naive because it assumes that those who are (say) 54 and have been paying into Medicare since they were teenagers will just passively accept some worthless voucher when they’re 65. And it further assumes that those angry folks won’t vote and demand an exemption. And then the next cohort will demand the same exemption. Same thing we have today with annual AMT adjustments and annual Doc fixes. And if Congress goes along with those exemptions then the Ryan plan completely collapses and it ends up adding $4T to the debt. I can’t believe Ryan is so politically naive that he doesn’t understand that this outcome is all but guaranteed, so the only thing I’m left with is concluding that Ryan is just trying to bamboozle folks long enough to kill Medicare and hope no one notices until it’s too late. And killing Medicare has been a goal of Republicans ever since 1965 (recall those Ronald Reagan adds calling Medicare “socialized medicine.”)
Rich Berger Look harder. Suggest you look at the OMB historical tables. There were plenty of times when government outlays as a percent of GDP fell. Sometimes just on the “on budget” side, sometimes just on the “off budget” side and sometimes “total” outlays. For example, total govt outlays as a percent of GDP fell under that big spender Jimmy Carter:
1976:…..21.4%
1976Q5: 21.0%
1977: 20.7%
1978: 20.7%
1979: 20.2%
1980: 21.7% (recession)
and under Reagan govt outlays rose as a percent of GDP and rarely fell below 22%.
And under Clinton govt outlays as a percent of GDP steadily fell from 22.3% to 18.4%. And don’t give us that “it was the Republican Congress” crap because the biggest falls occurred under Democratic control.
2slugs,
…naive because it assumes that those who are (say) 54 and have been paying into Medicare since they were teenagers will just passively accept some worthless voucher when they’re 65
C’mon man! You are smarter than that! You are confusing a payroll tax with a ‘lock box’.
Prior to the Bush/Obama years, I too, was naive like you and under the impression that payroll taxes went into a ‘lock box’ and that I was ‘entitled’ to a payout in the future.
It should now be obvious to everybody that payroll taxes are nothing more than a tax. Why would anyone who pays payroll taxes today(
Menzie You have to qualify things a little bit. CBO did do an analysis of Ryan’s Roadmap, but at the request of Ryan’s staff, CBO was directed to assume the tax cuts would not reduce revenues. In other words, even though CBO doesn’t formally do dynamic scoring, Ryan’s office did the dynamic scoring for CBO and then directed CBO to just take their word for it and go from there.
http://voices.washingtonpost.com/ezra-klein/2010/02/was_the_cbo_too_kind_to_paul_r.html
So in order to do an apples-to-apples comparison of Ryan’s plan with Obama’s plan, the CBO would have to redo their earlier scoring of Ryan’s plan.
2slugbaits: Yes, I agree. By a scoring, one would need CBO to do a formal assessment, such as when it goes through the President’s budget proposal, in conjunction with JCT, to figure out what happens. To date, the Ryan plan has not been subjected to that scrutiny.
I really enjoyed Macroeconomics Advisers takedown of the Heritage Foundation’s “analysis” of Rep. Ryan’s “plan”.
In addition to implied supply side elasticities that are 20 times that what are expected there is also:
Okun Overkill:
An Okun’s coefficient that is 20 fold greater than that by convention.
NAIRU Nonsense:
An immediate decline of 2 percentage points or so in the Non-Accelerating-Inflation Rate of Unemployment (NAIRU, which was not reported), which obviously led to a 2.8% unemployment rate (WTF?) in the initial, but now flushed down the memory hole, report.
Labor Force Fiasco:
An immediate 0.9 percentage-point decline in the labor force participation rate which didn’t square with the discussion of participation rates in the report.
Multiplier Mischief:
A short-run “fiscal multiplier” that is negative (huh?).
As well as:
“Crowding Out Credibility”
“Hilarious Housing”
“Foreign Foibles”
etc.
All in all, it makes for hilarious sarcastic reading, if it were not for that fact that the political party currently in control of the House actually thought this could pass for “serious” economic analysis.
This is what happens when you let a bunch of Neanderthaloids rework a macroeconomic model with a roadmap drawn in crayon.
Rich Berger,spending measured in dollars has decreased recently. It decreased in 2010.
Federal spending in 2009 was 3,517,677
Federal spending in 2010 was 3,456,212
These numbers come from the FY 2012 Historical tables published by the OMB.
Government spending as a share of GDP:
http://www.usgovernmentspending.com/us_20th_century_chart.html
See also, Table 2., Federal Outlays by Category, 1950 to 2075, CBO
http://www.cbo.gov/doc.cfm?index=3521&type=0
A great piece on the size of government in The Economist, over 40% of GDP if I read the charts right.
http://www.economist.com/node/15328727
Increasing the share of government in the economy is absolutely no guarantee of a balanced budget; to wit, Britain. Or the US. Government spending has seen a secular increase over the last century, largely with the exception of Clinton (and a bit, Carter). But we’re farther away from balancing the budget than we were 50 years ago.
Creating dependency makes a system that’s all that much harder to unravel later. Consider Portugal or Greece. Also US ethanol subsidies (or tax credits if you prefer). Do we really need these ag subsidies? Not today. But try cutting them.
For my money, the government has 32% of GDP to work with, all in (state, fed, local). Allocate accordingly in whatever fashion you like.
I am dismayed by the fundamental inability to read what I wrote with some attention to the actual words, and some intelligence in interpretation.
Berger states: “… what is better for growth, government spending or privately directed spending? Leaving aside, of course, the fact that freedom is destroyed by the additional confiscation of private income and wealth.”
Interesting. Bush junior squandered the Clinton balanced budget, started running up massive increases in government (military) spending, and initiated two wars. Not a peep of complaint from “conservatives” such as yourself about “confiscation of private income and wealth.” Your sainted Ronald Reagan likewise ran up massive deficits, and at the time (when I was getting my doctorate in economics) I very clearly recall “conservative” policy gurus stating that federal debt wasn’t a problem worth worrying about.
Both Bush junior and Reagan effectively implemented a massive Keynesian fiscal stimulus.
Now of course since the Democrats run the executive office, hypocrite conservatives like you serve up your anti-Keynesian and deficit-hawk baloney for the media to gobble up.
Win at any cost, eh Berger?
Rich Berger I am dismayed by the fundamental inability to read what I wrote with some attention to the actual words,
Well, let’s see. What did you say? Roll the tape… “I couldn’t find the constant dollar or % of GDP numbers on an annual basis, but I would be surprised if any of these declined in recent memory (say last 50-60 years).”
And so far folks here have provided you with constant dollar numbers and % of GDP numbers. So what part are we not understanding? Are you sure you understood what you wrote?
The difference between reading the Heritage Foundation’s analysis and that of Macroeconomic Advisors is like the difference between a sophomore term paper in an economics survey course and an advanced graduate level thesis submission. And Paul Ryan is now angry because someone with a third rate undergraduate education in economics is getting blown out of the water by actual economists. The sad thing is that there are so many voters and media pundits who don’t recognize that the Heritage Foundation’s only raison d’etre is to provide a thin veneer of intellectual respectability for crackpot ideas in the hope of fooling 51% of the voters.
Rich Berger: I think this is a salutory lesson which I will use in my undergraduate course tomorrow. If you cannot find a real series, you can take the nominal series, and divide by a deflator. There are several reasonable ones, which will give slightly different answers, but I would suggest a GDP deflator, or a PCE deflator. Division of the nominal series by the price deflator will yield a “real” or inflation-adjusted series. You will find numerous instances of declines on a q/q basis, and several on a y/y basis, when using the GDP deflator (FRED series GDPDEF).
Menzie-
I agree that a price deflator should be used over longer periods. But returning to the original point of your thread, the question at hand is sharp cutbacks in government spending, which I assume would occur very quickly and would be obvious even without adjustment.
As far as % of GDP measures, I would like these to go down, as government shrinks relative to the economy.
Was this the same Macro Advisers whose forecasts (snicker, snicker) proclaimed Obama’s stimulus would create millions of jobs (or did they do the sophomoric term paper unmeasurable jobs ‘saved’ bit)?
Tons of cred these Keynesian models have…….but with simulation models you get anything you want (….including the biggest lie of all, rampant man-made global warming).
Robert (or Bob): I am curious how you evaluate the impact of any policy measure. And relatedly, I assume you find the Heritage Foundation CDA model completely credible; is that supposition correct?
Nice timing huh?
http://www.zerohedge.com/article/obamas-budget-increases-deficit-41-over-cbo-baseline-over-next-decade
“And relatedly, I assume you find the Heritage Foundation CDA model completely credible; is that supposition correct?” Minzie.
As credible as you find the results from Keynesian ‘what you want is what you get’ SIMULATION models.
3 million jobs! What a hoot…….14 million unemployed Americans crucified on the Keynesian cross of Obama stimulus…and you keep peddling the same ole drivel.