Last week’s new economic data began with a personal income and outlays report which suggested slower consumption growth. But the numbers released Friday are a little more encouraging.
First there was the March employment report, which showed an average employment increase for the first quarter of 160,000 jobs per month according to the establishment survey and 219,000 per month according to the household survey. It would take many years of that kind of growth to get back to a labor market that anyone would describe as healthy. But at least at that pace we are finally making some actual progress. Menzie has more.
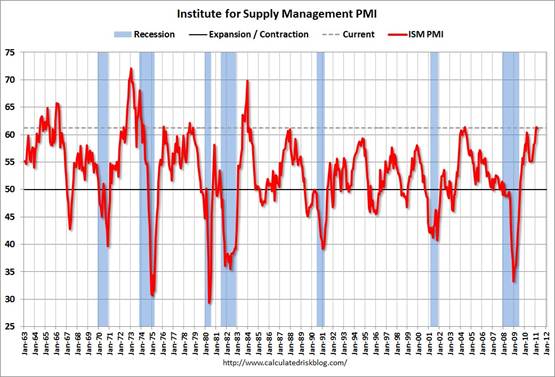
A stronger positive signal was provided by the March ISM manufacturing report, whose 61.2 reading reflects managers’ reports that new orders, production and employment were better in March than in February.
 |
Auto sales also continued to climb, up 17% from March 2010 and up 45% from March 2009.
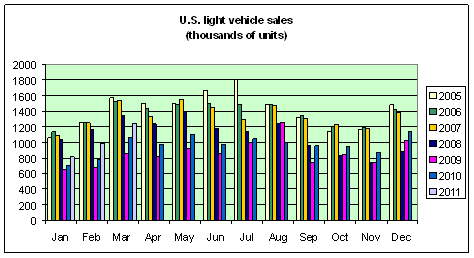 |
One worry is that gasoline prices are now about the level we saw at the end of April 2008. Interestingly, March 2011 light vehicle sales are also about the same levels as in April 2008. The big difference is, in April of 2008 we were describing those levels as a 14% drop from April of 2006. Now the car manufacturers count themselves lucky to be doing even that well.
|
|
| San Diego Historical Gas Price Charts Provided by GasBuddy.com |
Should GDP, be a benchmark for happiness, anything to be substracted is detrimental to well being, Anyone documenting the substraction is questionable.
Would the price deflator as of march 2011 be the same 111.141 no change since july 2010 source ( Gross Domestic Product: Please see Implicit Price Deflator U.S. Department of Commerce: Bureau of Economic Analysis)
Truth may “lie” somewhere in the middle of extreme,may I suggest reading the uper boundary.
http://www.shadowstats.com/alternate_data/inflation-charts
Narrowing the topic of improvement through financial prism is good justice,as applied to bad uses of funds.
Economies generating jobs must drive increasing commercial papers (Fred is not supplying long term charts)
Commercial Paper Outstanding (COMPOUT)
http://research.stlouisfed.org/fred2/series/COMPOUT
Commercial Paper of Nonfinancial Companies (COMPAPER)
http://research.stlouisfed.org/fred2/series/COMPAPER
The financial portion of the CPs is much larger than the commercial
Commercial Paper source BLS
http://www.federalreserve.gov/releases/cp/
Source ECB statistical data warehouse
Euro area (changing composition), Outstanding amounts at the end of the period (stocks), Monetary and Financial Institutions (MFIs) reporting sector – Loans [A20] and securities
http://sdw.ecb.europa.eu/quickview.do?SERIES_KEY=117.BSI.M.U2.Y.U.AT2.A.1.U2.2000.Z01.E
Short term european non financial papers 101 / 200 days (statistical data warehouse,Securities issuing sector non-financial corporations) CP are of lesser use than it used to be in the USA.
http://sdw.ecb.europa.eu/browseChart.do?node=8113925&MATURITY_CAT=DE&sfl6=3&sfl5=4&SEC_ISSUING_SECTOR=1100&sfl3=4&DATASET=0&SERIES_KEY=222.STP.B.A1.1100.A.XXXX.O.DE.R1.2.A.Z01.E
Only few, will complain that governments are too modest, when compared to their performances.
Euro area 17 (fixed composition) – Final consumption of general government, Current prices,
http://sdw.ecb.europa.eu/quickview.do?SERIES_KEY=119.ESA.Q.I6.Y.1300.P30000.0000.TTTT.V.U.A
May I suggest wandering in the data as supplied trough the ECB statistical warehouse.
The latest number once again remind me of the Great Depression. The Central Planners are patting themselves on the back because they were succeeding in maintaining a stable low level of economic activitiy and a stable high rate of unemployment.
“…the March employment report, which showed an average employment increase for the first quarter of 160,000 jobs per month according to the establishment survey and 219,000 per month according to the household survey. It would take many years of that kind of growth to get back to a labor market that anyone would describe as healthy.”
The US population has been growing at about 0.87%/yr for the last few decades, resulting in about 2.44 million new people entering the potential workforce per year (203,000 per month). From my perspective, the current rate of job creation is inadequate to adsorb the growth of people entering the job market, much less reduce the 22 million who are out of work or marginally employed right now.
The real bite will come when austerity in the Federal budget, and deficits in State and local governments result in reductions in government spending.
The last threat (oil prices) is the real one:
http://saposjoint.net/Forum/viewtopic.php?f=14&t=2626&start=0#p30486
Oil consumption/private GDP and /private final sales is currently at ~8%, with the price of oil and gasoline up ~27-28% yoy.
That implies that real private GDP growth will decelerate from the Q4 ’10 rate of 3% to near 0% to negative ~1% annualized by as soon Q3, repeating the pattern of late ’79 to early ’80 and winter-summer ’08 (the onset of the worst recessions since the Great Depression), including the risk of another stock market crash beginning at any time this spring (margin compression, decelerating earnings, and overvaluation).
The Fed has expanded the monetary base at a ruinous 34-35% annualized rate since the summer of ’08, nearly tripling the monetary base and growing the base at a cumulative differential rate to nominal GDP of an order of exponential magnitude, achieving just 2.3% avg. nominal GDP growth, 0.26% growth of private GDP, and ~0% avg. real private GDP, even as the federal gov’t will have borrowed and spent $4 trillion by this summer.
To keep nominal GDP growing at just 2%, the Fed would hereafter have to grow the monetary base at an accelerated rate of 48% compounded for ’12-’13 just to keep deficits funded, which projects the monetary base at nearly $4 trillion and then close to $6 trillion over the next 2 years, including the Fed effectively being required to fund 100% of US gov’t debt issuances over the period.
Clearly, this inevitable mathematical outcome for QEi (QEinfinity) is a course toward illegitimacy of runaway Keynesian deficit spending and central bank debt-money printing in the midst of a once-in-a-lifetime debt-deflationary slow-motion Long Wave Trough depression, as well as a once-in-history scale of global resource constraints from Peak Oil and population/ecological overshoot.
Real per capita private GDP can no longer grow at peak global oil production, peak debt levels, and falling net energy returns. There is no Keynesian, monetarist, supply-side, or socialist/communist solution to the end of growth.
We must adapt as quickly as possible to a post-Oil Age “contraction” regime in order to provide a socially acceptable well-being for as many as possible at a much lower standard of material consumption; otherwise, Nature will do it for us, and Oil Age civilization will eventually become Mad Max^2 or “The Road for Real”.
Of course, the Fed and economist minions will blame the imminent recession and bear market on Fukishuma, Libya, China’s currency manipulation, tight fiscal policy, a terrorist attack, commodities speculators, HFTing, and the like; but the proximate cause will be Peak Oil and overshoot which central banks and politicians can do nothing about, apart from exacerbating conditions.
The employment situation is indeed showing solid improvement – it appears that March was good month for most, but a very good month for young adults (Age 20-24).
The high and rising gas prices are a real concern – if their trend does indeed precede the trend in unemployment by two years, they’re suggesting that unemployment will rise in 2013 to go back above 9%. That would be after bottoming in the 8.2-8.6% range this year and holding there through most of 2012.
Auto sales will also be impacted by the Tohoku tsunami. It is not clear if all of the supply chain impacts of that event are known yet, nor has anyone established a path for recovery from the shock.
Also, food price inflation will continue to impact many of the LDCs. And may lead to civil unrest and other consequences.
The trend 2 years ago is irrevelant as all unemployment data was financial crisis influenced. Hence, when the next financial crisis comes whether in months or years(and it will come) it certainly will produce contraction.
I like higher gas prices because it forces dead brained Americans to use some creativity and self-control to handle their finances. It also cuts down on the idiots running around like monkey’s on the roads.
Hi, I’m James Hamilton, and I think the goal of an economy is to get people to buy more stuff, even if they don’t want that stuff.
MarkS, to buttress your point, take a look at per capita private employment since ’96-’97 and the onset of the post-Oil Age Greatest Depression in ’07-’08. You will not find a single mainstream e-CON-omist (not even the liberal types) who has addressed this evidence of the failure of the US economy.
The US has created no net new private sector employment per capita for more than 15 years.
Moreover, since the mid-’90s, the US has created more than three times more debt-money supply (and “asset” value) per capita to domestic oil production per capita, and two orders of exponential magnitude more since the secondary peak for US oil production in ’85.
IOW, in per capita terms, we have just 15% of domestic oil production capital stock and reserves to “perceived” debt-money supply. The mathematical reality is that we must slash oil consumption per capita vs. debt-money supply by 80-85%, requiring a near tripling up of individuals and households in terms of oil-related consumption.
Further, in industrial production per capita terms, we have just 20-25% of production-related capital stock to debt-money, requiring us to consume debt-money “wealth” at the per capita production rate indefinitely hereafter and for 30 years or more at the debt-money per capita rate; that is, real per capita US GDP growth will not occur for at least 30 years (all else equal) to ever for all practical purposes.
And this means that there will be very little, if any, net per capita increase in capital investment for “renewables”, smart grids, electric cars, etc., as we will consume a growing share of financial “wealth” accumulated over the past 25-30 years just to prevent outright decline and collapse of the Oil Age economy and infrastructure.
Imagine if Obummer or the next pResident in Thief, an oil company exec, Mad Hatter politico, e-CON-omist (besides yours truly), or opinion-shaping Foxy Noise media hottie dared tell us the truth about our precarious post-Oil Age net energy per capita situation and risk to civilization.
If you think Glenn Beck is perceived as a nutjob, the media and public attacks on that unfortunate person would make the attack on Jimmy Carter in the late ’70s look like a geriatric rumble in a comatose ward.
IOW, they aren’t going to tell us, and we aren’t going to know about the truth until we are standing in line all day for no gas, and the deliverance-type, roaming zombie inbreds are knocking down our doors to insist on inviting us to breakfast, lunch, and dinner, one limb at a time.
Tsunami Hits Home: Fewer Cars, Higher Prices For Months To Come. Surprised?
By Bertel Schmitt on April 12, 2011
http://www.thetruthaboutcars.com/2011/04/tsunami-hits-home-fewer-cars-higher-prices-for-months-to-come-surprised/