Core CPI: Blips or Trends
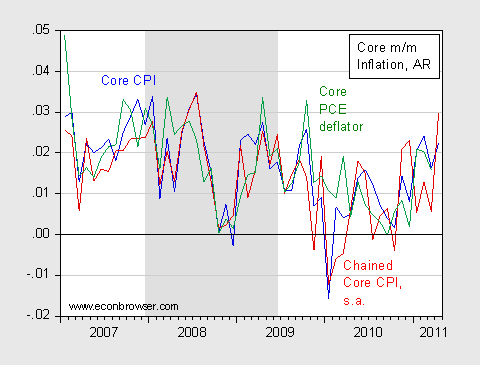
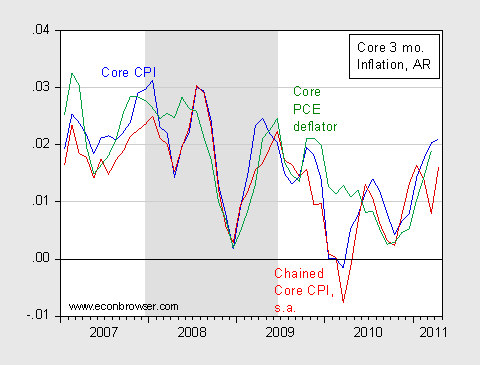
Here’s a plot of three measures of core m/m inflation. I don’t see hyper (or even high ) inflation on the horizon, as some do [0] [1]. Since one observation doesn’t make a trend, for good measure I include also 3 month inflation.

Figure 1: Month on month annualized inflation in Core CPI (blue), Chained Core CPI, seasonally adjusted (red), and Core personal consumption expenditure deflator (green). Chained Core CPI not-seasonally-adjusted series seasonally adjusted (on log values) using EViews X-12 routine (additive) over 1999M12-2011M04 period. NBER defined recession dates shaded gray. Source: BLS and BEA via FREDII, BLS, NBER and author’s calculations.

Figure 2: Three month annualized inflation in Core CPI (blue), Chained Core CPI, seasonally adjusted (red), and Core personal consumption expenditure deflator (green). Chained Core CPI not-seasonally-adjusted series seasonally adjusted (on log values) using EViews X-12 routine (additive) over 1999M12-2011M04 period. NBER defined recession dates shaded gray. Source: BLS and BEA via FREDII, BLS, NBER and author’s calculations.
I’ve included Core PCE as well as the BLS Chained Core CPI. It’s of interest that on the 3 month basis, both of these measures are below the official core CPI. As I’ve discussed before, the official CPI is a base-year (Laspeyres) index at the components level, so it tends to overstate the true price level [2]. The chain weighted series obviates this problem, as it approximates the Fisher price ideal index [3] (since the BLS chained series is not seasonally adjusted, I adjusted the log series using X-12; hence the graphed series is not the official series). Finally, the PCE is a chained series, but with different coverage (as discussed in [3]).
Daniel Thornton at St. Louis Fed has an interesting article where he investigates the rationale for focusing on the core measures. He observes that at the three year horizon, the forecasting performance of core is superior to lagged headline, but not statistically significantly so (at least after the mid-1980s).
I haven’t undertaken a formal analysis myself, but I do find that core CPI is weakly exogenous with respect of headline CPI, using a bivariate error correction model estimated over the 1985M01-2011M04 period:
(1) Δ pt = γ0 + ρ(pt-1 – core_pt-1) + γ1 Δ pt-1 + γ2 Δ pt-2 + γ3 Δ pt-3 γ4 Δ core_pt-1 + γ5 Δ core_pt-2 + γ6 Δ core_pt-3 + u1t
(2) Δ core_pt = θ0 + φ(pt-1 – core_pt-1) + θ1 Δ pt-1 + θ2 Δ pt-2 + θ3 Δ pt-3 + θ4 Δ core_pt-1 + θ5 Δ core_pt-2 + θ6 Δ core_pt-3 + u2t
Where p is log CPI, and core_p is log core CPI, and Δ is the first difference operator. This specification imposes long run cointegration between core and headline with unitary elasticity.
The adjusted-R2 from equation (1) is 0.22, and the estimate of ρ is -0.01 (p-value of 0.19). This coefficient estimate is consistent with headline responding to a statistical disequilibrium; it’s hard to calculate a half-life of a deviation given the short run dynamics. Ignoring those dynamics, the half life would be 5-3/4 years. In contrast, the adjusted-R2 from equation (2) is 0.36, and the estimate of φ is -0.002 (p-value of 0.62).
This finding is consistent with interpreting core as the object of interest; given the lack of statistical significance at conventional levels, it’s also consistent with finding the superior performance of core being statistically insignificant.
Market- and Survey-based Indicators of Expected Inflation
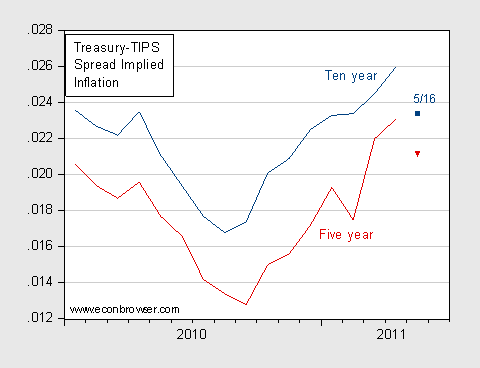
Even as headline and core measures rise (at least in the former case), the Treasury-TIPS spreads have fallen in the past half month.

Figure 3: Spread between ten year Treasurys and TIPS (dark blue), and five year (dark red), monthly averages of daily data. May observation for 5/16. Source: St. Louis Fed FREDII, author’s calculations.
It’s useful to remember what this graph implies: as of 5/16, over the ten year horizon, headline CPI is expected to average a little over 2.3%; over the next five years, it’s expected to average a bit over 2.1%.
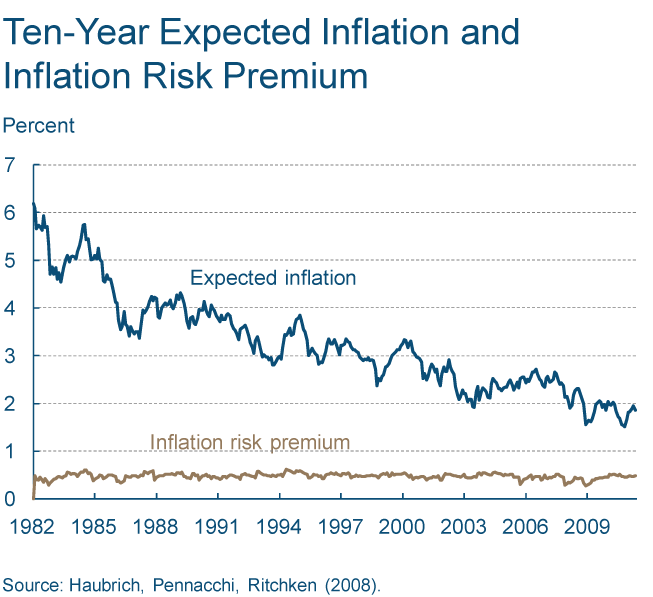
The Cleveland Fed has come out with its latest estimates (May 13) based upon inflation swaps, market data and survey data:
The Federal Reserve Bank of Cleveland reports that its latest estimate of 10-year expected inflation is 1.86 percent. In other words, the public currently expects the inflation rate to be less than 2 percent on average over the next decade.
The Cleveland Fed’s estimate of inflation expectations is based on a model that combines information from a number of sources to address the shortcomings of other, commonly used measures, such as the “break-even” rate derived from Treasury inflation protected securities (TIPS) or survey-based estimates. The Cleveland Fed model can produce estimates for many time horizons, and it isolates not only inflation expectations, but several other interesting variables, such as the real interest rate and the inflation risk premium. …
The estimates are presented in this graph:

Figure from Cleveland Fed (May 13, 2011), accessed May 19, 2011.
Concluding Thought
My answer to the question posed in the title: No.
Additional thoughts, regarding money base and inflation here. Money stock and inflation here. Jim’s views here and here.
When R. Avent posted this info, complete with references to the Cleveland Fed and TIPs, the very first comment asked if he was referring to TIPS and suggested that he was making up the methodology. You can’t argue with dumb.
You realize the rapture is 5/21 so none of this matters? LATimes has a great article about businesses that charge you to notify relatives after you’ve been taken away, including one service that for $135 will collect a pet and care for it, but only if the rapture occurs within 10 years of payment. You can’t argue with irrationality.
I keep saying this because we like to pretend the world is rational and it isn’t. It has bursts of enlightenment but when people want to believe inflation is going up then it must be going up. Belief trumps facts. If I may run on, it’s strange to reflect on how the GOP portrayed Obama’s positive message of change as naive when they are in the business of retailing the worst kind of hope, that which contradicts facts. Heck, after hearing how Ryan’s idiotic plan was about cutting spending, we’re then told it’s really not about numbers but about belief in growth spurred by lowering tax rates (on the richest Americans, of course).
I think – a belief easily changed by facts – that people want to believe in inflation, which is a bad thing, because they believe in the hope being sold by the GOP. That hope is that we go through these bad times and it gets better, that the problem is caused by someone else – meaning government, unions, teachers, someone else. They sell the hope message that returning to American principles means prosperity, even to the point that God intends this and will reward the believers. They pull this nonsense out of their and in complete disregard of fact. Contrast that irrational approach with “change we can believe in,” meaning change we can actually accomplish.
My PhD advisor once taught me “every time the title of an article or presentation is a question, the answer is always no”. You won’t believe how well this simple rule works 🙂
Hard to argue with that analysis, but directional changes matter. With 9.0 percent Ue (closer to 10 percent if you account for workers dropping out of the LF), core shouldn’t have even turned, right? Clearly if you believe CBO’s calculation of the NAIRU at 5.0 percent that would be correct. We’re not on the brink of high inflation, but structural unemployment has increased in the labor market. Sure, wages aren’t accelerating, but wages are just one component of labor costs; the ECI is a better measurement, which continues to show benefit costs rise. Just some food for thought.
Bullard of the St Louis Fed says forget core CPI, “The Core is Rotten“[.pdf]
Jim Glass: nice timely article by James Bullard.
The hyperinflationistas are right. Core inflation is wrong. It overstates inflation.
Since July 2008 the average annual rate of increase in CPI has been 0.9%. The average annual rate of increase in core CPI has been 1.3%.
Since July 2008 the average annual rate of increase in PCE has been 0.9%. The average annual rate of increase in core PCE has been 1.2%.
Have I been a trifle selective in dates?
Let’s try a different base date. How about exactly a quarter century ago?
Since April 1986 the average annual rate of increase in headline CPI has been 2.9%. The average annual rate of increase in core CPI has been 2.8%.
Since March 1986 the average annual rate of increase in headline PCE has been 2.5%. The average annual rate of increase in core PCE has been 2.4%.
Core inflation is clearly a conspiracy to overstate inflation.
Subjectively, ‘core’ seems like just another weasely dodge typical of govt to let them do what they want to do: inflate.
As Bullard says, “headline” CPI is the better measure in that it is designed to measure actual consumer inflation. Having said that, it definitely understates the inflation that I encounter in my main expenditures: food, fuel, my daughter’s college tuition, medical insurance, & cellphone/internet service, local taxes, utilities. These easily exceed 3%.
I put very little stock in the spreads as predictors of future inflation. Are the people buying these vehicles the same people who are buying 10 yr Tres. paying an interet rate equal to the current CPI & then paying taxes on their interest? Sagacity indeed.
The real inflation will be subsequent to QE3.
Would Shakeaspare statement be turned into more democratic and republican quotes, “the core is rotten” should keep its savor,meanwhile:
Bloomberg
U.K. inflation accelerated more than economists forecast in April to the fastest since October 2008, forcing Bank of England Governor Mervyn King to explain publicly why officials haven’t raised interest rates yet.
Interesting Article. The Bullard speech was interesting as well.
A couple of reactions:
1. Would your analysis change if you used the numbers from the MIT Prices project?
2. The Bullard piece is interesting in several different ways. To wit:
*He is right that there is a little disconnect between people who use the Core idea and people’s’ day to day experiences. One thing I think that is often missed about price changes is the extent to which they affect a household’s fixed or marginal costs. So the fact that real estate prices decline is less relevant to someone who owns their own on a montly basis, but the fact that food and gas are going up is VERY relevent. It’s why changes in these prices get so quickly reflected in things like consumer confidence.
Take the following hypothetical:
Family of four owns their house, one of whom is going to college in 4 years.
That family is seeing significant price increases in health care costs, expectations about education expenses, food and gasonline. Now it may be that the cost of durables like computers and TV’s are going down, but these are avoidable expenditures.
You will have a tough time arguing to that family that their cost of living isn’t going up significantly.
*But arguing you should include thinks like energy and food when making monetary policy really requires asking the question whether it makes sense to use monetary policy to deal with oil price increases. It strikes me that using monetary policy in this fashion doesn’t make a lot of sense given expectations around peak oil. Slowing the economy to avoid gas price increases strikes me as a fools errand.
Joe: The output gap or the unemployment gap is typically not the only determinant of inflation in the Phillips curve. Usually, there’s a supply factor (often modeled as the growth rate of log oil prices) included, as well as an expectations term. In other words, we typically use an expectations and supply augmented Phillips curve.
A political disconnect is that across the spectrum we want legislators to be more than straws in the wind. As the St. Louis Fed paper notes, headline inflation is meaningful to people when you shorten the time frame.
Your mathematical models look impressive, but aren’t you dismissing geopolitical headwinds? Where does fear play into your models in the case of say, Spain or a G3 country defaulting? Couldn’t a crises of that magnitude spread to the U.S.?
fladem: Can you explain to me the rational for using the growth rate of log oil prices as a supply factor in the Phillips curve? Both supply and demand factors determine the price of oil, and, moreover, it’s not exactly clear to me why the run of in oil prices (if it were a viable estimate of supply factors) would prove that issues in the labor market are more cyclical than structural. To me, it seems like the run-up in oil prices show increasing global demand, which is driven mostly by emerging market economics, and that demand hasn’t turned into more hiring in the US because there is a worker-employer skill mismatch occurring; the number of advanced degree holders in many emerging market economies is beginning to swamp those with similar degrees in the US.
Bryce Subjectively, ‘core’ seems like just another weasely dodge typical of govt to let them do what they want to do: inflate.
And what is it when core inflation is running higher than headline inflation? Sometimes that happens as well.
it definitely understates the inflation that I encounter in my main expenditures:
I’ll take your word for it, but you’re not the Fed and your interest in inflation is no doubt quite a bit different than the Fed’s. We have many different measures of inflation because we have many different purposes. Headline inflation is a pretty good way to compare your relative buying power from one month to the next; but it’s not a good predictor of next month’s inflation rate. When you compare this month’s buying power to last month’s buying power that is understandably important to you personally. Me too. But it’s also a retrospective metric. The Fed is in the business of predicting future inflation, and for that purpose a “core” measure is generally superior because it is not influenced by volatile outliers. The Fed is worried about inflation inertia…how much of this month’s inflation will be carried over into next month. That’s why they look at core measures.
fladem Would your analysis change if you used the numbers from the MIT Prices project?
Yes, somewhat. That’s because the MIT project is measuring different things. The MIT project is only measuring the prices of physical commodities like a loaf of bread, gallon of milk, pair of socks, etc. The MIT project excludes services. That’s important for two reasons. First, most of the US economy is service rather than goods based. Second, inflation in service industries tends to be dominated by wage inflation, and that has been flat as a pancake. It’s the presence of wage inflation that tends to drive inflation inertia, not so much the monthly bouncing around of coffee bean and wheat prices. In other words, the MIT project is a good index for measuring commodity inflation, but not necessarily a good measure of overall inflation.
http://bpp.mit.edu/usa/daily-price-indexes/?country=USA
Note that once conventional production peaks in a given region, there may not be a realistic oil price, and perhaps not any oil price, that will keep conventional crude oil production on an upward slope. Consider the Texas & North Sea case histories. Oil prices on vertical axes, production on horizontal axes:
http://i1095.photobucket.com/albums/i475/westexas/Slide1-1.jpg
Jeffrey
When trying to reach the references under photobucket,Google is offering a return to Econbrowser posts.
Any other links directing to your references would be welcome.
Joe: You are misattributing to fladem my comment regarding the Phillips curve. The math for including oil prices can be seen in this set of notes (caution, some math).
“…when people want to believe inflation is going up then it must be going up.”
When the majority of Americans’ standards of living are declining, when their net worth (housing, not stocks!) has fallen and can’t get up, when their tangible costs of living are rising but their incomes aren’t keeping up, when expectations of the future are diminishing, and when the last major period of economic malaise was the 70s… then people will blame “inflation”, largely because that’s what economists called it the last time so many people couldn’t make ends meet. (In 2009 when prices were falling they called it the Great Recession because salaries, home equity and employment were falling even faster.)
At some level, what you call the economic stress doesn’t matter. The economy sucks for the vast majority of the population, the corporations continue to play the negative-sum politics of “I got mine, you lose”, and their elected government does not appear to be constructively addressing any of the fundamental issues.
In terms of economic inflation, deflation or hyperinflation, I suspect the only question is which way the political wind is blowing when the tinder ignites and the firestorm goes off!
Until both parties start seeking and finding win-win compromise solutions, we are in a lose-lose economy.