On Thursday, we brought together an impressive array of scholars to discuss the causes and consequences of, and policy responses to, long term unemployment, including Prakash Loungani, Advisor in the IMF’s Research Department, Kenneth Scheve, Professor of Political Science at Yale, Phillip Swagel, Professor of Public Policy at the University of Maryland, and a former Assistant Secretary of Treasury for Economic Policy, Rob Valletta, Research Advisor at the Federal Reserve Bank of San Francisco, Dan Aaronson, Director of Microeconomic Research at the Chicago Fed, and Kenneth Troske, Professor of Economics from the University of Kentucky. And that was in addition to the researchers from the University of Wisconsin-Madison (more on them below). For me, this was a tremendous learning experience. But like all good conferences, by the end I understood that I knew less than I thought I knew about long term unemployment. In today’s post, I will discuss the presentations and papers by Prakash Loungani and Rob Valletta; in the next post, I’ll cover the findings of Ken Scheve and Phillip Swagel and Ken Troske.
Prakash Loungani’s paper (with Jinzhu Chen, Prakash Kannan, and Bharat Trehan) provided one approach to trying to determine the sources of long term unemployment. They proxy shifts in the structure of the economy with a measure of the dispersion of stock returns (Figure 4 from the paper). They then use a vector autoregression to identify impulse response functions for unemployment at various horizons. Long term unemployment responds positively to this index, as shown in Figure 6.
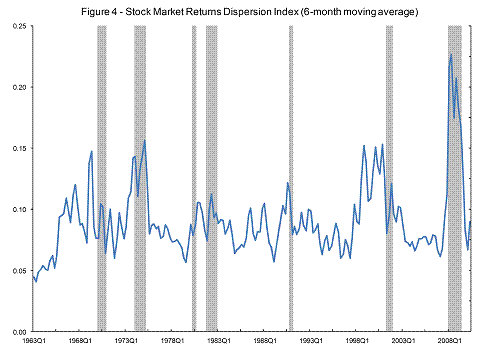
Figure 4 from Chen, Kannan, Loungani, Trehan (2011).
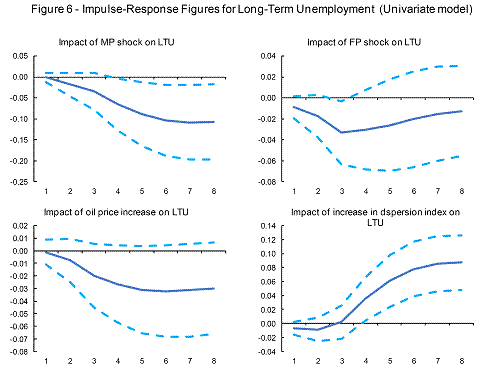
Figure 6 from Chen, Kannan, Loungani, Trehan (2011).
I’m always fascinated by empirical relationships that appear to be robust, and this one, at least so far, does not seem particularly fragile. Loungani observes that the results are robust to the inclusion of an alternative measure of dispersion (Bloom’s measure (Econometrica, 2009)). The results imply the following for the cyclical/structural components at various durations of unemployment (a slide from the morning presentation).
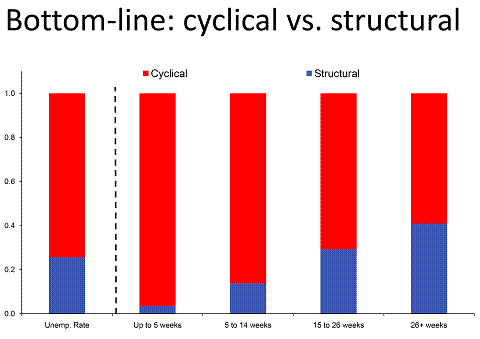
Figure from Loungani presentation.
I have two observations here: The first is that the cyclical structural component is larger for those with longer unemployment duration, which is consistent with intuition. The second is that even at the longest duration category, no more than 40 percent is structural.
Dan Aaronson, Director of Microeconomic Research at the Chicago Fed discussed the paper. He noted that it was remarkable that nearly half the rise in long term unemployment was explained by one variable. One of his key concerns was that the outliers in both series associated with the Great Recession naturally made the dispersion variable successful. I also wondered whether the strength of the identified relationship would persist in a sample truncated before the Great Recession. Dr. Loungani observed that the relationship still prevailed in a short subsample, although he had not conducted a formal out-of-sample forecasting exercise.
Dr. Aaronson also observed that in a Mortensen-Pissarides matching framework [lecture notes on MP model], with reasonable calibration, no more than two percentage points of the increase of the unemployment can be structural. He illustrates this point in this figure:
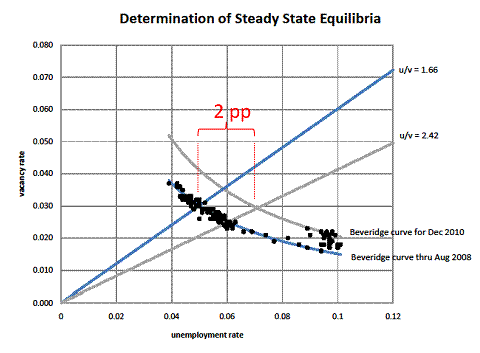
Slide 6, Aaronson discussion
He stressed that something closer to one percentage point was more likely an estimate.
Rob Valletta addressed the question of whether rising unemployment duration in the United States was due to a composition effect, or a change in behavior, over the long term. Carefully addressing the changes in the construction of the survey, he concluded
“…After accounting for changes in the [Current Population Survey] survey and using a more complete and appropriate set of conditioning variables than has been used in past work, the results suggest limited changes in unemployment duration over the past three decades. However, conditional durations have been longer during the recent severe recession and its aftermath than in the similar episode during the early 1980s, primarily due to higher labor force attachment for women and lower unemployment exit rates among the very long-term unemployed.”
This finding is illustrated in the paper’s Figure 1, which plots the unemployment rate against the unadjusted and adjusted duration. The key point is there is no pronounced trend in the adjusted series, until the Great Recession. This suggests the compositional effect dominates.
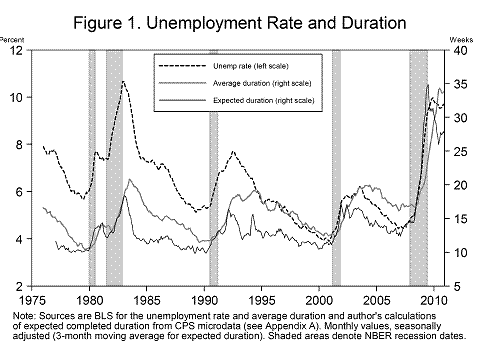
Figure 1 from Valletta (2011).
Dr. Valletta concludes:
The higher durations in the recent recession appear largely due to: (i) increased labor force attachment among women, as reflected in the patterns for female labor force entrants
(consistent with the arguments of Abraham and Shimer 2002); and (ii) lower unemployment exit rates among the very long-term unemployed (2 years or more). Both of these groups are generally ineligible for extended UI benefits. These findings suggest that there has been little or no change in the behavior of unemployed individuals over the past three decades, including a limited impact of the historically unprecedented extensions of unemployment insurance benefits over the past 3 years.
The discussant, UW Professor Rasmus Lentz, observed that typically, one would want to estimate the hazard rate of exiting unemployment, which is straightforward with a sample of the flow, whereas the CPS is a sample of the stock; the hazard rate can still be estimated if the proper adjustments are undertaken. The analysis of generated of synthetic cohorts that Valletta implements is another approach to estimating the hazard rate.
He also observed that one could obtain a more structural interpretation of the results by including the vacancy rate as a regressor — that is the structure of the market implies a covariance between job finding and tightness. However, if all one wants to do is to is to estimate how job finding has changed over time, it’s not clear that one needs to include a measure of unemployment or market tightness. [minor edits — mdc 11:40am]
In the discussion, I noted the fact that the mean duration figure did not completely convey the full story. In terms of the topic of the conference, I asked him to interpret further the lower exit rate out of the group unemployed over 99 weeks. Dr. Valletta agreed that this result was consistent with rising structural unemployment for those who have been unemployed for an extended period, but that this was quantitatively a small figure.
Summing Up
How to interpret these findings? I think it’s useful to recall the points that Dr. Valletta made in the morning session. In particular, there are at least three definitions of structural unemployment:
- often equated with persistent (long-term) unemployment; but this can be cyclical (disappears as economy recovers)
- mismatch between skills/location of workers and jobs (common
definition)
- sources of unemployment (other than “frictional”) that contribute to a higher equilibrium “natural rate of unemployment” or NAIRU (“nonaccelerating inflation rate of unemployment”).
So, my reading of the views at the meeting were that there was a consensus that most of the unemployment increase since the onset of the Great Recession was cyclical in nature. Even when one takes the higher estimates of structural unemployment, structural unemployment still does not account for more than two percentage points of the increased amount of unemployment. Citing joint research with Mary Daly and Bart Hobijn, Dr. Valletta puts the estimate at 1.25 ppts, while Dr. Aaronson thought 1 ppts was reasonable.
The entire agenda for the conference, organized by myself and Mark Copelovitch, and sponsored by the La Follette School and the UW Center for World Affairs and the Global Economy, is here, while a recent Institute for Research on Poverty conference agenda is here. Recent posts on the subject are here, here, and here. The Economist has a long article on male unemployment in the latest issue. And for a survey of the costs of high unemployment, see this November ILO-IMF report.
I think (in the first sentence after the bar graph) you have inadvertently stated the reverse of your intuition with respect to the slightly larger component of structural unemployment among the long-term unemployed. Forgive me if I have misunderstood you.
benamery21: No, you’ve got it exactly right — I wrote the wrong thing. Fixed now.
How much longer do we have to listen to this nonsense? talk about lecturing birds on flying. did any of the idiots on this panel have any idea about the risks that were being hidden below the surface. Give it 5 years and the economics profession will be regarded as a complete load of nonsense.
Hire 5M people at minimum wage to do things that don’t displace existing jobs. This would cost about $100B a year assuming about a 25% overhead for the program.
$100B financed at 0.7% is 700M dollars per year. There are 154M currently employed people. This is $4.50 per employee per year (in perpetuity) to drop unemployment down to 7% for a year.
Want to pay-go instead of taking on more debt?
FUTA (payroll) tax is typically 0.8%, but it’s capped at 28K per year (actually 7k per quarter technically). The cap was last raised in 1983. The law originally applied to 100% of wages, the first cap (in 1939) covered 98% of wages. The current cap covers about 14% of wages by my calculations. If we simply uncapped the 0.8% portion of FUTA (an employer tax), we would generate $50B additional per year. The $100B per year and declining cost of workfare, would be very sustainable.
For comparison, the FICA wage base has increased from 35,700 to 106,800 over the same period since 1983 that the FUTA wage base has remained unchanged.
After paying off the ~$300-500B needed for direct employment of the excess unemployed over the next few years, we could substantially decrease the FUTA tax rate, since the base would have been so broadened.
Thanks. I assume you’ll continue to get irrational posts about how everything is structural. As your post points out, that argument was made without any quantitative sense.
Computers and robots are the ultimate cause. Even conservatives realize that we will need some form of wealth redistribution. Corporations are benefiting from eliminating labor, it will only get worse (or better) depending on your point of view.
benamery21, employing people in zero-value or very low-value jobs (i.e. jobs that don’t displace existing jobs) is counter-productive. Much better to give them the money and leave them the time to improve or re-evaluate their abilities/knowledge. That is what unemployment support is for.
If you want to spend additional money to tackle a particularly vicious unemployment problem (like the one we have now), I would suggest bolstering projects that educate the unemployed and assist them in the process of finding a new job.
Menzie, what is the validity of the structural/cyclical unemployment split based on observations of normal recessions, when applied to a recession caused by a severe financial shock?
The globalization is the root cause of the structural problem of unemployment, even if producing in USA a company can achieve the same, or even lower cost to produce the goods than, lets say in China, this multinational company will produce in China, because they can use a lot of fiscal evasion methods to increase their profit. For example:
a) Re-invoicing
b) Transfer-pricing
c) Management of funds and investment through tax havens
etc…
The companies that produce inside USA cannot make such fiscal frauds and have to pay all the taxes, that really sustain the social nets, and that is (together with the slavery wages) the reason more and more companies outsource their operations, destroying all the industrial base of our countries, and making unsustainable our societies
The only way out for the government is to increase the tax pressure and decrease the social benefits, so the incentives to the explained process accelerates again
The welfare states is sustainable itself, but maintaining the industrial base is required, and the only way is tackling the tax havens and reverting the kind of globalization we have now
When a wise man points the moon the fool looks at the finger (attributed to Confucius)
Let me look at the finger:
Corporate
Is Debt Overhang Causing Firms to Underinvest?
http://www.clevelandfed.org/research/commentary/2010/2010-7.cfm
T Philippon The evolution of the financial industry from 1860 to 2007:Theory and evidence page 33….37
Private
Debt as percentage of percentage income
http://www.areppim.com/stats/stats_usdebtxincome.htm
Throughout this time frame equities markets,stockholders,board members have not always been efficient.May be, there is an overdose of circularity in the theory of stocks markets dispersion and unemployment.
Time will tell regarding the proportion of structural and cyclical components of unemployment in this situation. Modeling is helpful but challenging in the context of this atypical recession.
Full-time, private employment is no higher than in the mid-’90s. Take out private health care and education employment, and there has been no full-time, private employment growth since the early ’90s. Adjust for population growth, and full-time, private employment ex health care and education is no higher than the mid- to late ’80s.
This, friends, is structural; that is, a direct result of US peak crude oil production in ’70 and a secondary peak in ’85 and the resulting deindustrialization and financialization of the US economy, including a shift of value-add goods production to China-Asia by US supranational corporations beginning in earnest in the early to mid-’90s.
What we have called “growth” since the ’80s has been US supranational firms’ investment and subsidiaries’ production abroad returned to the US as “imports” and sold to consumers who ran up household debt at falling nominal interest rates with falling real wages.
The secular debt cycle has peaked and has begun to deflate coincident with accelerating decline of net energy, peak global oil production, and soon peak oil exports.
Diminishing net energy returns, the end of the reflationary effects of falling nominal interest rates, peak oil production, and China reaching the per capita GDP limit bound with accelerating inflation and the largest fixed investment and credit bubble in world history ensure that global real per capita GDP growth is over.
Interesting. The impacts of a severe asset-finance-crisis tend to be structural in nature. Previous overbuilds create persistent asset and input surpluses. The newly emerging economy must impose structural change or risk not growing.
Did anyone pick up on what was conspicuously missing from the analysis?
Here is a hint. Where do jobs come from?
Notice this from a 04/28/11 IBD editorial comparing the Reagan recovery to the Obama recovery.
Just a couple of notes, first there was no reagan recovery. There was a reagan depression. America has not recovered from the outsourcing and pillaging by the corporate raiders that started during the reagan regime. It has just accelerated as the economy has focused more and more on totally non productive activity like inflating housing prices and wall street stock flipping or other frauds.
Second, the economists will not start to focus on real causes or cures until they are affected by it. A lot of economists need to be incorporated into that structural, long term unemployed group. Any that failed to predict the economic collapse of 2008 should be bounced out. Having a Nobel Prize for economics is akin to having a Nobel Prize in Alchemy, Astrology or Phrenology. There has never been a more bogus, hopeless pseudo science being held afloat by infusion of tax dollars at state supported universities and government departments.
Harry,
You are spitting into the wind.
Reagan’s quarterly growth rate averaged 7.1% after the 1981-82 recession. Over the same period since Obama has been in office the growth rate is 2.8%.
Dig the stats out for yourself. Don’t let the partisans lead you around by the nose.
endorendil:Really?
You think there are no high-labor-intensity activities that the government could pay for, and which the market is not currently filling which are not (near) valueless? Ever heard the words ‘public good’ or ‘externality’ before?
BTW, job-training and education are NOT what unemployment support is for. That’s why my sister lost her unemployment when she went back to school. I do support those activities (as my previous comments on other threads show), I just don’t want you to think that’s why we have UI.
Just giving people money to lay on the couch or futilely pursue what few jobs exist, is not conducive to maintaining work skills/ethic/habits.
Interesting. I would like to see a regression of structural unemployment against the change in housing construction between 2000 and 2007.
My guess is you will find states with high relative housing starts will have higher rates of unemployment. A ton of the housing jobs in Florida were not high skill jobs – and there loss isn’t easily replacable. But would they count as structual in the analysis above?
Reagan had nothing to do with the recovery in ’82. I suggest anyone who doubts this look at the Monetary Supply numbers. The ’82 Recession was caused by the Fed as a remedy to cure inflation, and the recovery occured after the Fed loosened policy.
This post included in its background reading an interesting article from the Economist about “Decline of the Working Man” highlighting one of the details that is not focused on when the broader issue of unemployment trends are discussed – in this case, the fact that the recession has hit particularly hard certain demographic groups, namely young, uneducated men and older “dislocateds”, both facing a different set of issues and incentives and disincentives. There are certainly other demographic groups that are facing their unique recession pains as well. The point is that there are multiple losers when aggregate demand goes down for a long time, but their needs are often very different. In the case of young uneducated men, education or better retention programs would be suitable, whereas with older men, making sure the lure of disability insurance isn’t greater than working takes a different combination of policy changes. The bigger, broader programs being debated, like extending unemployment insurance, are easier targets for partisan debate, despite the fact that they often distort incentives and create huge deadweight losses. They also distract from the fact that the various groups that together are a big part of the unemployment bottom line – particularly the growing ranks of the long term unemployed, require different, targeted measures that are often overlooked by policy makers. Most are not willing to tackle the wide scale abuse of disability payments because it is politically unpalatable. And while the trend of fewer and fewer men graduating from high school or seeking higher education has gone on for some time, politicians have been slow to tackle it. I was raised by a mother who despite skipping two grades and was sharp as a tack, believed that boys were inherently smarter and better at everything and now have a son who based on his own observations believes the exact same thing – about girls. I can see how policymakers, most of whom are a little older than myself, are slow to realize that our country’s boys need more attention – needed it yesterday – and that our men, particularly those from poor, disadvantaged backgrounds, are at greater risk than ever. High school dropouts, deadbeat dads and convicted felons are not the favored causes for most politicians but as the economy moves inexorably away from manufacturing and other low-wage jobs traditionally absorbing this male labor(and attempting to buck that trend is all but futile), despite their substantial cost, targeted efforts like training programs provided they are focused on growing industries do more than just add to the pool of employed. Having these at risk groups of men working has more potential to reconfigure the deteriorating situation of working class and poor families and the streets on which they live than many of the pro-poor programs currently running, including many well-intentioned – and politically popular – programs focused on women and children.
Dear Prof. Chinn,
I was wondering how robust are the “structural” results, i.e. the IRFs, with respect to the identification scheme. I think I remember the authors employed the “traditional recursive scheme” to identify the system. From my own experience with VAr identification schemes, the qualitative outcome from IRF analysis ofentimes strongly hinges on the identification scheme.
Nonethless, I am very fond of the theory of uncertainty shocks to the economy and like the idea of bringing this to the data. I am also aware, however, of the misleading evidence from small-system VARs that typically suffer from pronounced omitted variable bias.
I’d probably suggest to at least estimate the system in a Bayesian fashion, maybe using some sort of stochastic search variable selection prior to arrive at a restricted VAR with less spurious correlation among variables. This would also provide some shrinkage to enhance efficiency and mitigate overfitting.
Just thoughts…
Ricardo: Strange, using the latest BEA data on GDP in Ch.2005$, I obtain an average growth rate (q/q, SAAR) of 6.27% in the eight quarters after the Reagan recession. Please recheck your math.
Reagan had low oil prices to feed the economic recovery. Now in the Peak Oil era robust economic recovery is no longer physically possible. Oil costs too much. We are in a zero sum game.
Partisans assign too much credit and blame to US presidents. Important other forces are at work.