A picture says a thousand words. From the NYT today:
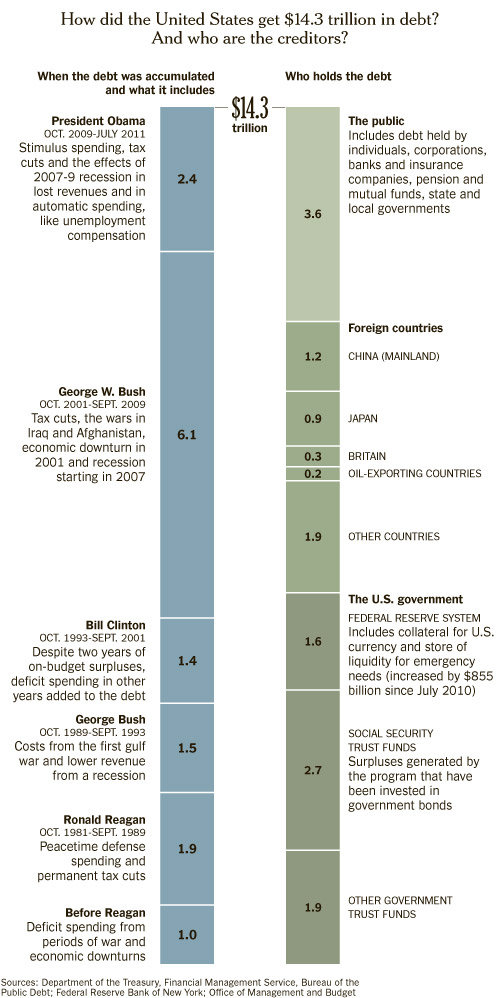
In particular, who racked up $6.1 trillion in debt?
For more graphs, see here and here.
Update 9:20am 7/29: Reader CoRev excoriates me for using a graphic along FY lines (well a lot of spending is baked in, so Presidents usually are more responsible for the FYs that the NY Times allocated). Well, since we have a set of magical instruments called the Internet, and Excel, we can easily see that there is little change using quarterly data, and timing the cumulations more tightly.
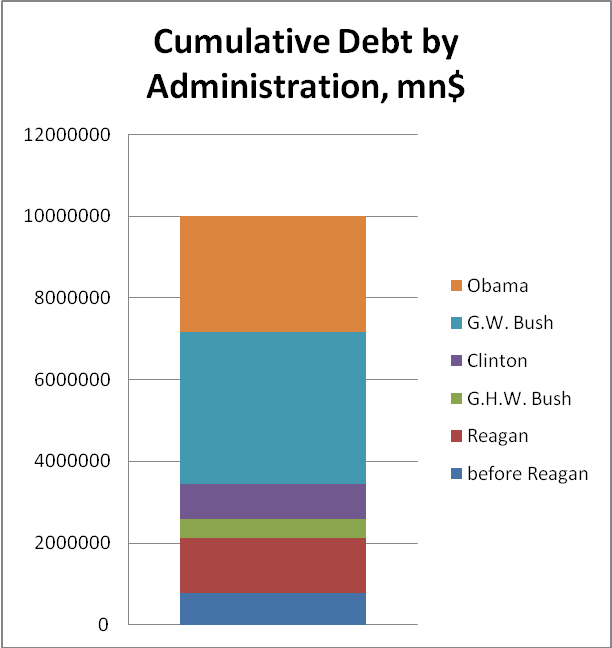
Figure 0: Cumulative changes in publicly held debt, by Presidential administrations, in millions of $, NSA. Source: Treasury via FREDII (series FYGFDPUN), and directly from Treasury for 2011Q1.
I don’t see a drastic revision to the stylized facts. Here is a corresponding graph normalized by GDP, which is more relevant.
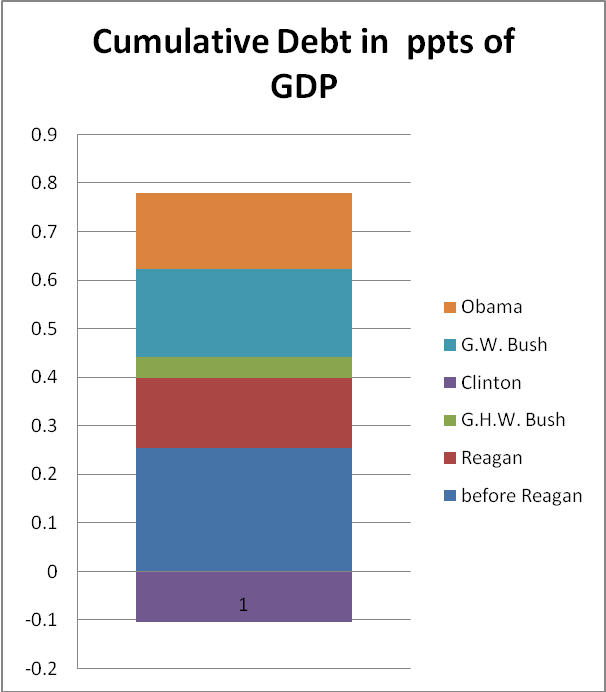
Figure 1: Cumulative changes in publicly held debt, by Presidential administrations, in millions of $, NSA, normalized by GDP, in billions of $, SAAR, all through 2011Q1. Source: Treasury via FREDII (series FYGFDPUN), Band directly from Treasury for 2011Q1, BEA 2011Q2 advance release, and author’s calculations.
Note that in this last graph, the “Clinton” block is below the zero line because publicly held debt was paid down during the Clinton Administration, in ppts of GDP terms. If we normalized by potential nominal GDP, the Obama block would look smaller. I also find of interest the debt accumulated during Reagan, GHW Bush, and Bush Administrations versus that during Clinton and Obama… (recalling Clinton paid down, as a share of GDP).
To see how much BHO has had to go to the well see page 9
http://www.worldometers.info/docs/Debt_Limit_CRS_April_2011.pdf
While I completely agree that 6.1 trillion was run up under Bush, the cost of runaway SPENDING is the culprit. Between wars, huge highway bills, and an unnecessary prescription drug program we spent far more than we should. All of which was an attempt by both parties to buy votes.
Does anyone else see the hypocrisy between this post and this post?
I agree with Damon:
Bush: $6.1tr / 8 years = $0.76tr/year
Obama: $2.4tr / 1.75 years = $1.37tr/year
Of course that’s current face-value and doesn’t fully account for the interest burden, but still…
I see 40 percent of the waste in 25% of the time.
“The other guy stunk worse” is a losing argument both ways.
Bush stunk.
Obama stinks.
Odds are pretty good that the next one will stink too.
Menzie says Bush’s $.7625T average per year isn’t being trumped by ‘O’s” $.8278T average per year.
Moreover, how did they establish the arbitrary start/end dates? How did they calculate the amounts? From the dates on the chart, they did not assign any of the spending in FY 2009 to Obama.
Using the Whitehouse budget numbers for FY2010 ($1293) and 10 months of FY2011 estimated deficit($1645) I still get ~$2.925T. And that’s without any FY 2009 $(1413) assigned to Obama? Since it was the year of Obama’s stimulus bill it should not just be ignored as it appears the NYT has done.
The FY2010 & 2011 numbers can be found here: http://www.whitehouse.gov/sites/default/files/omb/budget/fy2012/assets/tables.pdf
and the FY 2009 numbers are here: http://www.whitehouse.gov/sites/default/files/omb/budget/fy2011/assets/tables.pdf
“In particular, who racked up $6.1 trillion in debt?”
Simple answer. The top culprit is when the Democrats held both houses of Congress.
The next culprit is when the Democrats held one house of Congress.
The next culprit is when the Republicans held both houses of Congress with a Republican President.
And the least culpable is when the Republicans held both houses of Congress with a Democratic President.
And finally, tax cuts are not a cost, unless you are a Communist, King, Dictator, Socialist, or a Modern Keynesian.
And finally even if you are Modern Keynesian who thinks the President is a King and has all responsibility of the budget, (continuing to ignore the high correlation of Democrat Congresses) but claims high math skills.
6.1 / 8 = 0.76 trillion per year
2.4 / 1.75 = 1.37 trillion per year
I notice that a number of economics blogs are now being regularly loaded up with comments by the ‘spending is everything’ wackos. So much so, in fact, that I think it is planned action.
Man, Prof. Chinn really needs to start a separate blog to keep his stupid political sniping out of the interesting econ.
I find the divisions:
Bush: $6.1tr / 8 years = $0.76tr/year
Obama: $2.4tr / 1.75 years = $1.37tr/year
To be overly simplistic. I’m not even sure where the 1.75 comes from as it should be closer to 2.8 resulting in $0.8571tr/year for Obama.
What is more important is where the debts are from. In professor Chinn’s previous post on the origins of debt, the data for the new costs state very clearly that the costs of the new policies are $5.07tr and $1.44tr respectively, resulting in
Bush: $0.63tr/year
Obama: $0.51tr/year
A lot of that is stimulus spending which, no matter how you slice it and quibble about the ultimate effect, was necessary to restart the economy out from the ruinous 8 previous years over which Bush presided.
On another point, this is Professor Chinn and Professor Hamilton’s blog – nowhere on the blog does it state that the posts are to be apolitical. If anything, if the blog does not fit your palate there are a myriad of others to choose from.
I just wish Obama’s contribution to the debt would have been about $1T larger than it is. If it were, then chances are we wouldn’t be talking about it today and we wouldn’t be listening to clueless politicians spouting teabag-onomics.
To Mr Hanson, cutting taxes without off setting spending (ie dollar for dollar) is a cost. Your allowing the current generation to consume while passing on the cost to the next generation. You know the ole family budget cooncept you like to always bring up when talking about gov’t spending. Same applies here. I know with your one track mind your not capable of connecting the dots
Aeon
From the data of the 1000 word picture. Top of the scale, left hand side, next to the 2.4 trillion, begins;
“President Obama
Oct. 2009-July 20011”
I count that as 1 year 9 months or 1.75 year.
Most difficult thing in the world, not letting your bias keep a person from seeing facts.
Not to defend the profligate Bush, but his amount is swelled by the TARP, which has been somewhat paid back. & with Obama taking office Jan’09, he had the power not to spend 10 months of money you attribute to Bush. This doesn’t suggests real objectivity on the part of the NYT…not that I would expect it.
A different point: If memory serves me correctly, I’ve read that roughly half of all Federal debt is held by central banks [Fed, PBoC, Japanese central bank, UK, the Saudis, et al]. Furthermore, a significant portion of the Federal debt held by US banks was bought with money they get pretty much for free from the Fed or because of the Fed’s money creation depressing CD rates to 0.
The point being that our present low interest rates flow to a large extent from monetization of the debt. TANSTAFL
Nominal dollars, not even adjusted for inflation, let alone GDP. Dubya was gawd-awful, but not as bad as implied, even though he’s responsible for most of the amount attributed to Obama.
Who bought up the debt produced under Bush?
The main problem with this post is that it is juvenile. When faced with a mess, adults don’t absolve themselves of the responsibility for cleaning it up by claiming “I didn’t make the mess”. Is it an adult or a child posting to this blog? Do we have an adult or a child for President? The debt is a problem regardless of the president under which it originated. The people responsible *right now* knew what they were signing up for and promised to manage it. They haven’t. This applies to all of the parasitic sycophants in D.C. regardless of party affiliation.
“tax cuts are not a cost”
Foregoing revenue has a cost. Spending has grown at roughly the same rate for 30 years. Tax revenue has varied quite a bit. The years following the tax cuts of 1981 and 2001,2003 mark the periods where the greatest amount of debt was accumulated since national debt cracked 1 trillion in 1982.
Federal Government: Current Expenditures & Receipts – 1980-2011
Ed Hanson, if you read the text beneath the dates Oct. 2009-July 20011, you’ll see the contributors to that 2.4 trillion were
1) stimulus spending
2) tax cuts
3) the 2007-2009 recession that reduced revenue and triggered automatic stabilizers like unemployment compensation.
Since the only tax cut that Obama campaigned on was an extension of the Bush rates for households with an AGI of 250K, the graphic suggests most of that 2.4 trillion is a direct result of the Bush recession or policies enacted to deal with it. Most difficult thing in the world, not letting your bias keep a person from seeing facts.
That was a terrible mistake on my part. Not sure how I was counting.
The figures for the new policies are:
0.63tr/year (Bush) versus 0.82tr/year (Obama).
I’ll leave it a that and remain out of the debate on what the policies are actually constituted of and the costs/benefits.
For the calculations made in other comments, someone should account for the bail outs, quantitative easing etc etc …
These two graphic stacks are odious and smelly red herrings. Far more germane is a just explication of what actually happened and what is going on. Permit me to reframe.
For five decades through 2007, debt held by the public as a % of GDP – the operative variable of consequence – ranged between 25 and 50%. In this Bush’s 7th year, it was smack at mid-range at 36%.
Then the Great Recession struck. The havoc played out across Bush’s terminating year and Obama’s opening one, and set the debt ratio on a course of 40% in 2008, 53% in 2009, 62% in 2010, 74% this year, and close approaching 90% as now projected for 2021. Reinhart and Rogoff tell us this is a catastrophic course, since when this ratio reaches 90% GDP growth tends to fall significantly.
In its August 2007 Budget and Economic Outlook, right prior to the Titanic event and in full knowledge of all that had come before, what did the CBO forecast for the debt ratio? A steady decline to 25% by 2017! There is only one logical deduction: the Great Recession is the prime cause of the current debt trajectory. Let us look to it then.
The Great Recession is characterized by the historic housing boom and its companion longer-term credit cycle which imploded in 2008 into financial chaos and economic collapse. Who was responsible for this?
There can be only one answer, and this is important stack. In order of causal priority: (1st) the economics profession for not having had the foggiest clue, (2nd) Alan Greenspan and the Fed for flooding the globe with liquidity as they hewed to an inadequate Taylor Rule guideline from 2002 on, (3rd) Congress who made the rules and wrote the laws under which, (4th) Financial Regulators completely missed the growth of a massively overleveraged shadow banking system replete with innovative new securitizations and re-securitizations, and (5th) Wall Street banks who were only operating in line with the profit motive of free enterprise.
All this lashing of George Bush is doubly wrong. It bespeaks ignorance of the true causes of the fix we find ourselves in, and it is ideologically driven toward more of the same big government and academic ineptitude that got us here in the first place. There are forces across this land finally saying enough is enough … and this is what the debt ceiling argument is all about.
Anonymous you wrote in part;
“Your allowing the current generation to consume while passing on the cost to the next generation.”
I am not sure those you mean by the current generation, but what you say is certainly true for my generation, generally described as the “baby boomers”.
I would honestly describe my generation as the most self-indulgent, self-interested, self-ish generation this country has ever produced. When taxation by government reached the tax capacity the economy they reacted in two ways. One, they continued to attempt to breach that tax capacity quite unsuccessfully, of course, and two, ignoring this economic reality instead placed future economic demands on later generations by borrowing for current demands as well as creating ‘entitlements’ of future distributions to us.
My only advise, don’t fall into the same trap. Demand that you are better able to determine where and how the fruits of your production is spent, saved, and invested. Do not let an unknown and unknowing government authority to unreasonably usurp your wealth and income to be diverted to others whom you do not and cannot know.
Recognize that government can not create wealth. It can only take from the private economy for its own political purposes either through directly by taxation and borrowing, or by reducing your saving by printing.
The fight is huge. The political reality is that my generation still votes in large numbers and will continue to attempt to take from later generations. Organize, vote, and just say no.
Ed Hanson:
“Most difficult thing in the world, not letting your bias keep a person from seeing facts.”
That might be the most ironic statement yet written on this comment page.
Can anyone tell me what bad econoic policy of Bush Obama has reversed? Can anyone tell me what bad policy of Bush Obama has not made worse?
Nice try Menzie but the folks on here are smarter than you give them credit.
I detect a touch of defensiveness, when individuals characterize a particular graphic as “juvenile”. I’m happy that people discuss the context, but I would be even happier if the critics identified any factual or numerical errors in the graphics content.
I will note that if one converts to of dollars deficit per year, perhaps one should also adjust by GDP, and perhaps one should also take note of the fact that some deficits were racked up during years when GDP was near full employment levels (for people who believe in that concept).
Professor, no offense intended to you, but some of your commenters are blithering idiots.
I read the let’s divide the deficit by years comments and had to shut my laptop for a while. Maybe those were in response to your proddings about innumeracy and they’re demonstrating they know basic arithmetic word problems. Tommy has 10 things and $100, so what is each thing worth?
OK Menzie: “I’m happy that people discuss the context, but I would be even happier if the critics identified any factual or numerical errors in the graphics content.”
Where’s the eight months of FY2009? What part of FY2009 spending can be attributed to Obama’s policies, because is surely was not zero.
For those calculating in fractions of years, I am assuming two things.
1) Since the chart time frames coincide with FY start dates, the data are Based upon FYs.
2) The total 2011 data is Obama’s. Since 2011 is still not over, the data for 2011 is estimated, and also since it appears to be a fraction of the estimated $1.6+T FY2011 deficit.
Regardless, it is a NYT article and graph, and must be reviewed closely for bias, as we have been doing.
Menzie, you can do better than this!
CoRev, do you deny that it has not been a deliberate policy by republicans to create these deficits to force a cut in government programs that they can not achieve through direct political actions.
Sure, you can do your data nitpicking all you want, but you can not deny that the deficit is a deliberate republican policy.
May not be worth to argue about the culprits since they have already been pointed through an investigation.
Bloomberg
The congressionally appointed panel assigned to probe the origins of the 2008 credit crisis heaped blame on “reckless” Wall Street firms and “weak” federal regulators, concluding the meltdown could have been avoided.
A copy of the book obtained by Bloomberg News, a paperback emblazoned with a U.S. seal, faults the Securities and Exchange Commission and the Federal Reserve for failing to clamp down on the banks they supervised. It singles out former Fed Chairman Alan Greenspan for backing “30 years of deregulation.”
Time may be saved as well, the Federal reserves provides for the numbers.
FEDERAL RESERVE statistical release
Flow of Funds Summary Statistics First Quarter 2011
At the end of the first quarter of 2011, the level of
domestic non financial debt outstanding was $36.3
trillion; household debt was $13.3 trillion,
non financial business debt was just under $11
trillion, and total government debt was $12 trillion
Europe needs the same investigation and even more thorough as the numbers need more clarity in Euro area and even more in UK.
Spencer, do you deny that it has not been a deliberate policy by democrats to create these deficits to force an increase in tax rates that they cannot achieve through direct political actions?
Who controlled Congress from 2007 to 2011?
Given that government spending seems to go up regardless of who is president and regardless of who controls Congress, what will happen if we raise taxes considerably to balance the budget and to pay down debt and spending increases continue? It seems to me we will be in worse shape than now. If the left got what appears to be its wish to finally tax the rich out of existence, who will remain to pay increased taxes except the non-rich.
It is interesting to see how this chart overlays with republican vs. democrat control of congress. This seems to suggest a much different correlation.
http://en.wikipedia.org/wiki/File:US_Federal_Debt_as_Percent_of_GDP_Color_Coded_Congress_Control_and_Presidents_Highlighted.png
Indeed, who racked up $6.1 trillion in debt? More so, who racked up $14.3 trillion in debt? Any partisan can tell you.
Given that government spending seems to go up regardless of who is president and regardless of who controls Congress …
Empirical evidence suggests this is not the case. During the Reagan years, taxes were lowered and government spending increased dramatically. During the the Clinton years, taxes were raised and discretionary government spending decreased. Then again during the Bush years, taxes were lowered and government spending skyrocketed once again.
Evidence suggests that raising taxes lowers spending and lowering taxes raises spending. This might be explained by the simple fact that lowering the price of government increases the demand and raising the price of government lowers the demand.
Gee, Robert I have never heard of a democratic
“starve the beast” strategy.
Spencer asks: “CoRev, do you deny that it has not been a deliberate policy by republicans to create these deficits to force a cut in government programs that they can not achieve through direct political actions.”
Of course I can. Creating deficits? Sheesh!!!!
Because Republicans/conservatives believe the opposite as Democrats/liberals is no reason to get snarky. Both parties use political strategies to move their foundational policies forward and demagoguery to make political points against the other. A scholar of your age and experience should not be surprised. What’s going on up there? (You can take that question geographically, and otherwise? :-))
Gee Spencer, always knew you were a CFL instead of an incandescent.
Spencer, ans all the other political liberals, in case you didn’t notice, the political field changed dramatically last November. Will it last? For some time. How long? Who can tell. But, stop the complaining! The growth of conservative political poser is a direct reaction to your policies and your president.
The comments to this article are indicative of a deep distrust of liberal new sources and their motives. Menzie’s and other liberal obviously biased writing is being challenged.
Get over it! The pendulum will swing back. It always does, but at this point I think it will continue in its current direction.
Menzie says: I would be even happier if the critics identified any factual or numerical errors in the graphics content.
I’ve noticed that you have used this defense on more than one occasion. However, facts are only useful to the extent that they help make a point. Although not explicitly stated, your point here seems to be “Bush is the culprit behind our current debt troubles”. That point, not the facts used to support it, is the real issue. So, while you may disagree with a characterization of that point as “juvenile” or a “red herring”, those comments are certainly relevant.
If only spending commitments ended with each house, but alas, a house that did not vote to go to war can find itself having to fund the war a previous house left behind (this is the kind of thing that causes control to change.) To do this right you have to know who voted for what when, not just on who’s watch the chickens came home to roost. A house also usually doesn’t create a new tax code, but lives with the one already in place. But to generalize, “tax and spend” would seem less likely to generate large deficits compared to “borrow and spend” (deficits don’t matter.)
I love a parade. Do you love a parade? Leaders love a parade. The easiest way to be a leader is by getting in front of a parade. The race to own the inevitable coming fall in the deficit is quite impressive. All the non-reoccurring FDIC stuff (only 884 problem banks left,) the end of the wars, the end of stimulus, and of course the inevitable increase in local, state, and federal tax revenues associated with the end of a recession. It is such a big parade, and it, of course, comes with a big fight among our leaders over who gets to be in front.
The additional graphs are useful, although it is a big stretch to suggest there is little change in proportions to the original graph. How do these look using party in control of house and/or senate?
Menzie says: “Reader CoRev excoriates me for using a graphic along FY lines (well a lot of spending is baked in, so Presidents usually are more responsible for the FYs that the NY Times allocated).” Actually, I simple asked where was the FY2009 numbers, since Obama was president for eight months of the FY, and he passed and started spending his stimulus. To ignore FY2009 is making a claim that all spending was Bush’s. That is clearly not so. Some might have been already baked in, but not all.
BTW, why are you taking the blame for a NYT graph? Did you develop it for them? Taking personally comments aimed at the NYT seems a little strange. I do, however, understand your reaction to the politics of your selecting such a questionable graph (as indicated by the flurry of comments.)
So why didja?
CoRev, I’m not bothered by the political pendulum swinging.
Rather, I’m bothered by the basic dishonesty of the republican party and their willingness to ruin the economy for their political purposes.
Spencer, OK! We’ll just ignore the results of the past 2.5 Yrs of democratic economic policy. But, if we do we need to talk to those long term unemployed. We’ll ignore the apparent extreme bias of the article referenced by Menzie.
CoRev OK! We’ll just ignore the results of the past 2.5 Yrs of democratic economic policy
I’ll tell you what. Since the Nov 2010 electorate was disproportionately old, white and conservative, how about if old, white and conservative voters take most of the budget hits they seem to feel are so necessary? Why should grandma stand at the front of the line come 2 August if grandma voted for some Tea Party kook? Let the seniors reap what they sowed. Sound fair?
What is especially frustrating about this whole business is the dumbing down of our politicians, and we have dumber politicians because we have even dumber voters. There are intelligent conservative positions; but there are no intelligent Tea Party positions. It’s really shocking to see idiots like Michele Bachmann and Louie Gohmert and Rand Paul and Trey Gowdy, and Steven King etc. And believe me, Steven King is every bit as stupid in person as he appears to be on television. These people are dumb as fenceposts, so you’ve got to wonder how stupid the voters had to be to have elected these clowns? Some of them make Sarah Palin look like a scholar.
Spencer commented on their dishonesty. Interestingly enough, it seems that a disproportionate share of freshman Republicans have a lot of personal integity issues. Several owe a LOT of money. One from Texas owes over $160,000 in credit card bills. Several owe over $100K. And just today we learn that another one owes more than $100K in child support. But yet they have the chutzpah to lecture us all on fiscal responsibility. It’s enough to make a voter puke.
Since this is a never ending debate about facts that rarely if ever change I’ll repeat some past points:
1) What kind of party control contributes the most to fiscal responsibility:
In my opinion, fiscal responsibility mainly involves reducing the public debt as a percentage of GDP. (Anything less is unsustainable.) Since the end of WW II we’ve had 63 Federal budgets (FY 1947-FY 2009). If you consider the FY 2002 budget the product of a united Republican government (a Republican congress passed the tax cut) and FY 2003 the product of a divided government you have the following breakdown. Thirtynine budgets were the product of a divided government with 31 having Republican presidents and 8 having Democratic presidents. Twentyfour budgets were the product of united government with 19 having Democratic presidents and 5 having Republican presidents.
The Federal public debt increased as a percentage of GDP in 24 of those fiscal years.(It did not increase during the transitional quarter in 1977.) Eighteen of these budgets were the product of divided government and the remaining six were the product of united government. So although 38.1% of all of the budgets were a product of united governments only 25% of the budgets which resulted in an increase in the public debt were the product of a united government. It seems if reducing the public debt is your goal, then a united government is at least slightly preferable to a divided government.
The worst possible combination is a united Republican government. Three out of the five budgets passed by a united Republican government (60%), an admittedly small sample, resulted in an increase in the Federal public debt as a percent of GDP. The next worst combination was divided government with a Republican president. Eighteen out of 31 budgets passed (58.1%) increased the public debt. Only 3 out of the 19 budgets that were the product of united Democratic government (15.8%) increased the public debt. And none of the 8 budgets passed by a divided government with a Democratic president increased the public debt.
If there is a party of fiscal responsibility it sure ain’t the Republicans.
2) What was the fiscal situation that Obama actually inherited?
According to the CBO’s January 2009 estimate for FY 2009, outlays were projected to be $3,543 billion and revenues were projected to be $2,357 billion, leaving a deficit of $1,186 billion. These estimates were made before Obama took office, based on existing policy, and did not take into account any actions that Obama might implement:
http://www.cbo.gov/ftpdocs/106xx/doc10640/10-2009-MBR.pdf
Now fast forward to the end of FY 2009, which ended on September 30, 2009. According to CBO, it ended with spending at $3,515 billion and revenues of $2,106 billion for a deficit of $1,409 billion.
Thus the deficit came in $223 billion higher than projected, but spending was $28 billion and revenues were $251 billion less than expected. Thus more than 100 percent of the increase in the deficit between January 2009 and the end of FY 2009 is accounted for by lower revenues. Not one penny was due to higher spending.
The revenues were lower to a large extent because of tax cuts included in ARRA. According to the JCT, these tax cuts reduced revenues in FY 2009 by $98 billion over what would otherwise have been the case. This is important because your position has consistently been that tax cuts and only tax cuts are an appropriate response to the economic crisis.
3) What are the specific legislative changes that have contributed to our current fiscal situation and which administration was responsible for them?
FY 2001 was Clinton’s last budget. The surplus was $128 billion. Net interest was $230 billion. The effect of off budget items (SS and PS) was $161 billion. Thus the on-budget primary surplus was $128 billion + $230 billion – $161 billion = $197 billion.
Now EGTRRA (2001 tax cut) subtracted $61 billion from revenues in FY 2001 so Bush actually inherited a $258 billion on-budget primary surplus.
Now fast forward to FY 2009 (Bush’s last budget). The deficit was $1413 billion. Net interest was $187 billion. The effect of off budget items was $137 billion. Thus the on-budget primary deficit was $1413 billion – $187 billion + $137 billion = $1363 billion.
Now ARRA (the fiscal stimulus) added $84 billion to spending and subtracted $98 billion from revenues so Obama actually inherited a $1181 on-budget primary deficit.
So how much did our fiscal situation get worse under Bush? Well $1181 billion + $258 billion is $1439 billion. And how much of this was legislated changes? Well the Bush tax cuts (EGTRRA and JGTRRA) subtracted $364 billion from revenue in FY 2009. TARP (the financial bailout) and Fannie and Freddie added $249 billion to spending. The wars in Afghanistan and Iraq added $178 billion to spending. Medicare part D added $51 billion to spending. Homeland Security added $52 billion to spending. So all told legislated changes under Bush added $894 billion to the deficit in FY 2009. That’s nearly five times the contribution of ARRA to the FY 2009 deficit.
Now, let’s fast forward again to estimates of FY 2013 (the last budget of Obama’s first term). The CBO projects that the deficit will be $704 billion. The net interest is forecast to be $325 billion. And the effect of off budget items will be $88 billion. Thus the on-budget primary deficit is forecast to be $467 billion.
So how much is our fiscal situation projected to get better during Obama’s first term? Well $1181 billion – $467 billion is $714 billion.
It is interesting to note that Obama’s primary effect on the FY 2013 budget deficit comes from three things: 1) ARRA, 2) other recovery acts, and 3) PPACA (healthcare reform). What is the estimated effect of these three items? Well, ARRA is projected to add $53 billion to the deficit, other recovery acts are projected to add $11 billion to the deficit, and PPACA is projected to subtract $51 billion from the deficit. In short the major legislated changes under Obama will add a net of $13 billion.
In short, Obama’s projected contribution to the deficit in the last budget of his first term ($13 billion) is 1.5% of Bush’s contribution to his last budget ($894 billion).
This is why, when Republicans sound the alarms about a fiscal crisis I just have to laugh because if there is one, it was they who created it.
P.S. The on-budget primary deficit was $105 billion in FY 2007 (Bush’s best year). He never ran on on-budget primary surplus his entire presidency. In contrast, Clinton had an on-budget primary surplus every budget of his presidency save his first (FY 1994).
Thanks Mark. May I use this? (Will credit of course) Have read all of this before, but you put it together very nicely.
Steve
Steve,
Feel free to use the facts. They’re not mine, they’re everybody’s (the people’s). But I truly apppreciate any mention I get for the effort it took to assemble them. 🙂
CoRev: I used the graph because I don’t have infinite amounts of time to generate graphs, with a day job; so I took the short cut, knowing that using quarterly data (as I have in past posts, as you well know) would not change the basic result: that much more debt was run up during the GW Bush years than during the Obama administration to date. I don’t hear you disputing that point now, now that the additional graphs are up — merely carping about my choice of graphs.
When I hear you writing about bias, I just laugh and laugh and laugh.
Well, if we really want to play this game: Reagan and Bush II, +$8.0t in 16 years. Obama $2.4t in 1.83 years — that’s 2.6 times the Reagan/Bush rate. (And remember, Reagan had a recession with 11% unemployment.)
Yet that’s not so satisfactory, we really want a GDP measure.
The CBO Long Term Outlook historical and projected data give these % of GDP increases in the debt held by the public:
Reagan: +15 in eight years
Bush II: +22 in eight years
Obama: +23 in four years (projected)
Obama’s rate of increase is more than twice the rate of Bush and more than three times the rate of Reagan.
But we *shouldn’t* be playing this game. Today’s $10 trillion of debt owed to the public is something we’d easily manage if that was all we had to deal with. So all this partisan fingerwagging over who is to blame for past history is really pretty meaningless trying to blame people for what is not a problem.
Our problem is the $100 TRILLION+ present value unfunded liabilities going forward into the FUTURE, overwhelmingly for entitlements — as evidenced by CBO’s 75-year projection ending in only 26 years, 2037, when the projected debt goes over **200% of GDP**, compared to only 77% at the end of Obama’s (first?) term.
If we want to point at people to blame, let’s point at the ones responsible for NOT addressing this *going forward*.
On that score, there’s plenty — plenty — of *bipartisan* blame to go around.
So, I’d suggest, let’s try to be constructive and attend to what matters — the problems of the future.
Yup! Menzie, I admit to being a political/fiscal conservative, and try very hard to be objective about facts. I do not write multiple political articles (WI) then stop when results indicate the WI political experiment might actually have been beneficial for local governments.
I try not to submit disingenuous biased graphs, as the original included in this article. If/when I have it is to counter one already submitted.
I do not believe in a lot of over-hyped talking points, “tax cuts for the rich”, “Bush worse president on record”, and “Global Warming” solutions that add taxes. I believe in the inherent goodness of man to do the right thing and not government.
Having said all of that, my first and consistent point in my questions for this article have been why no FY2009 data? It was the first year of the Obama stimulus which clearly included spending that was not Bush’s.
CoRev: Believe me when I say the lower frequency of posts on Wisconsin is not due to the “benefits” accruing to local governments due to the current administrations policies. Just for you, I’ll work up something highlighting impending distress.
Over hype on AGW. OK. I,ll just ignore the record temps across the US as I swelter in Washington. Thank goodness you’ve assured me there’s nothing to worry about.
The NYT reported everything consistently, by Fiscal Year (I know — a hobgoblin of small minds — and that is why they did not have the first 8 months of 2009 associated with the Obama Admin. It would have been strange to adjust only that number, but none of the other Administration’s. After all, that same thing has occurred in other cases. But I know consistency is not of interest to you, so please feel free to post the adjusted graph on your blog.
CoRev You call yourself a fiscal conservative, but I honestly don’t know what that term means anymore. Back in the day fiscal conservatism used to mean that governments should run surpluses or deficits according to the degree to which the economy was running above or below trend. If the economy was running above slightly above trend, then run a small surplus. If running slightly below trend, then run a small deficit. But the key feature of fiscal conservatism was that government should target a balanced position over the long run and then passively accept surpluses or deficits. Personally I agree with the part about running a long run balanced position, but I support more active involvement in-between cycles…particularly if the recession is very deep. And I support a more activist monetary policy. So while I am not a fiscal conservative in the old-fashioned sense of the term, I at least understand it. But you seem to be all over the ballpark. You supported the 2003 tax cuts when the rules of Ike-style fiscal conservatism clearly called for running a surplus and not cutting taxes. You opposed raising taxes to fight either of the two big wars even when the economy was running above potential GDP. And just a few days ago you came out for a balanced budget amendment, which requires a very activist fiscal policy and precludes ever running a surplus. I don’t know, but Tea Party types seem to think that a “balanced budget” means it’s okay to run a deficit due to tax cuts, but it’s not okay to actually balance the budget with tax increases. All in all it’s just an intellectual muddle.
Menzie Off topic, but here goes anyway. Regarding global warming, in case you missed it there’s an interesting and short paper on NBER from last month (#17092) that looks at the impact of global warming on agricultural profits in the US and Africa. What’s different about this paper is that they look at a very wide range of results based on 20 different climate models rather than just one or two dominant models (e.g., the Hadley model). They incorporate two kinds of uncertainty; uncertainty about the economic relationships between temperature and profts as well as uncertainty about climate models themselves. Not surprisingly the magnitude of the uncertainty greatly increases, but what is surprising is that the range of uncertainty is pretty much the same for both the US and Africa. One reason is that US farmers show zero tendency to adapt.
Jim Glass,
Proper understanding of the historical facts is important because it tells us who legitimately can claim to be addressing the debt problem going forward. Once one realizes the Republicans have never worried about debt (except for Eisenhower, and based on how he was received by fellow Republicans, it’s questionable whether he was a “real” Republican) it’s easy to see the proposals they offer, especially now, are more about tax cuts than anything remotely resembling fiscal responsibility.
Case in point, part of the recent debt negotiations have included a discussion of a tax overhaul. As part of this discussion the Republicans insisted that a trigger be included so that if a tax reform act is not passed by 2012 then the individual mandate of PPACA will become null.
Everyone who read the original Heritage Foundation report on healthcare reform from 20 years ago knows that the individual mandate is essential to healthcare reform. Thus eliminating it is key to eliminating PPACA. And PPACA, unlike all the major legislative acts the Republicans passed in the last decade actually reduces the deficits, as well as the rate of growth in healthcare costs, which is the key to reducing the rate of growth in entitlement spending.
The point is, once you understand the Republican’s true motives it’s easy to peer behind their “fiscal responsibility” BS and see that they are the ones almost entirely responsible for our poor fiscal situation, past, present and future. Absolutely, nothing they are proposing right now will make our fiscal situation better once you take the time to really analyze it. They’re only concerned about three things: 1) tax cuts, 2) tax cuts and 3) tax cuts (in that order).
CoRev,
I would suggest that the $182 billion that ARRA added to the deficit in FY 2009 is chump change. If you subtract it from Bush’s contribution it only reduces his total by 3%. On the other hand if you subtract the amount EGTRRA added to the deficit in FY 2001 ($61 billion) it reduces Clinton’s contribution by about 4%. That kind of consistency (assuming you are really interested in consistency) is only going to make your case worse, not better.
Freshman Tea Party Conservatives: Do as a say, not as I do in my personal life.
http://politicalticker.blogs.cnn.com/2011/07/28/hardliners-in-debt-talks-have-debt-problems-of-their-own/
Jim Glass, Proper understanding of the historical facts is important because it tells us who legitimately can claim to be addressing the debt problem going forward. Once one realizes the Republicans have never worried about debt … it’s easy to see the proposals they offer, especially now, are more about tax cuts than anything remotely resembling fiscal responsibility.
And who is mostly — and proudly so — responsible for the $100 trillion present value in unfunded entitlements? Which will in the next 35 years add *double* the points of GDP to the debt as have been incurred in the last 200 years?
Why weren’t those entitlements actuarially funded from the start (as FDR wanted, *insisted* SS be, and as it was until his Democratic Congress turned it paygo post-1939 over his veto)?
What does that historical understanding indicate to you about that party’s willingess to fund them going forward?
What’s the bigger irresponsibility, being primarily responsible for $10 T of issued debt that we could easily handle by itself, or being primarily responsible for $100+ T of implicit debt that will very soon be rolling into issued debt in a big way, that we can’t imaginably handle without huge trauma to come? Today’s micro-trauma being only a little inkling of the future.
I have no problem whatsoever with calling one or the other political party “irresponsible”, very. I have a big problem with calling only *one* of them irresponsible, when they are both political organizations that respond to the same political incentives in the same self-interested, self-benefitting ways (#1, by calling the *other* one the source of all evil).
Now do you consider all this fingerwagging constructive? Shall we continue with it? Being that you have demonstrated the Republicans are inherently irresponsible on all public debt issues, do you have a constructive solution to this problem … such as removing them from having all the influence that goes with being one of the major political parties in a two-party system? Well, one could equally reasonably (at least, as 100 = 10 x 10) say that the party primarily responsible for $100 trillion of unfunded entitlements is congenitially incapable of fiscal responsibility, and so should be removed from the system. But then, who would be left? So neither is going to happen.
So let’s look for a more constructive approach. Or not, be as partisan as ye all want — I’ve been registered as a political Independent my entire voting-age life, so I’m not part of either side’s choir, it doesn’t matter to me.
I’d just like to see *some* of the effort being put into all this looking backward and going “you did this!”, “well, you did that!” into a forward looking “Yikes, 200pts of GDP coming! What should WE do about it?”
You think we have budget obstructionists now? Just wait until this day comes.
Jim Glass,
Sure, realpolitics invites real solutions.
Basically, my opinion is that one should ignore the obstructionists. The debt ceiling law is of course completely unconstitutional (we’ll probably find out in short order). And there are ways around this mess in the short run (including giant ten pound platinum coins).
And, according to the CBO if we simply do nothing:
1) Let all of the Bush tax cuts expire
2) Let the doc fix expire
3) Let PPACA go into effect
the budget more or less goes into primary balance by FY 2015 and stays that way for 70 years or more. (And the debt held by the public stays less than 100% of GDP.)
In short, send all the obstructionists home. The less they totally screw things up the better off we’ll all be. (I know that I for one will sleep soundly at night knowing the tin-foil hat wearing crowd are in their home districts and not wreaking mischief in Washington.)
Menzie, please hold off on that ole WI article, till I have time to respond. I’m away from my normal access.
I will not get into an CAGW discussion over weather. Last year it was it was Russia. A few years back it was Europe, and in the past century we’ve seen heat waves throughout various sections of the US ~4 times.
Now will I take this thread OT to CAGW.
Otherwise, do you think it disingenuous to discount major portions of the most recent president’s record from a very biased news Paper?
Mark,
Thanks for taking a serious stab at understanding the actuals.
Stop freakin’ spending so much money!
CoRev, “And finally, tax cuts are not a cost, unless you are a Communist, King, Dictator, Socialist, or a Modern Keynesian.”
That is one of the dumbest thing I’ve ever heard.
Reading the comments on economics blogs is one of the more frustrating things anyone who has a basic understanding of math can do.
Those graphs are rather hideous… I recommend reading some blogs about data visualization.
I wonder how much of that $3.6T the people actually wanted. Pity your version of democracy limits citizens to exactly two choices of how the government will be run. Time for major change there.