Or things got a lot worse in 2008Q4 than we thought
The 2011Q2 advance release and revised estimates [0] contained many unpleasant surprises (see Jim’s assessment; also [CR1] and [CR2] [John Taylor] [Izzo/WSJ RTE]). The below consensus growth rate, and downward revision in Q1 growth, have been discussed elsewhere. I want to focus on the implications of the revisions to the data going back to 2003 (with particular emphasis on data back to 2007).
Figure 1: GDP from 2011Q2 advance release (blue) and from 2011Q1 3rd release (red), all in billions of 2005$, SAAR. NBER defined recession dates shaded gray. Source: BEA.
Here are the points I take away from this new information:
- The output decline starting from 2008Q2 was much worse than originally estimated.
- The increase in GDP relative to 2009Q1 (when the ARRA was passed) is the same as before.
- The output gap is more negative than originally estimated (based on January 2011 CBO estimate of potential), and is now getting more negative.
- Consumption and fixed nonresidential investment account for the largest components of the downward revisions in final sales of domestic product.
- GDP per capita fell even more precipitously from 2008Q2 through 2009Q1 than originally estimated.
- The consumption decline is also more pronounced with new data.
- The recent employment-GDP relationship seems a little less mysterious.
- The exports story remains unrevised.
The output decline starting from 2008Q2 was much worse than originally estimated
Figure 2: Log GDP from 2011Q2 advance release (blue) and from 2011Q1 3rd release (red), all in billions of 2005$, SAAR, rescaled to 2008Q2 normalized to zero. NBER defined recession dates shaded gray. Source: BEA, NBER and author’s calculations.
Originally, GDP fell at a 7% SAAR rate in 2008Q4 (the quarter that Don Luskin conjectured in September 2008 might be the start of unprecedented prosperity); in the revised figures, the decline was 9.3% (rates calculated in log terms; 6.7% and 8.9% in levels terms). As an interesting aside, the advance estimate (released at the end of January 2009) for 2008Q4 growth was only -4.1% (-4.0% level terms). The 2008Q4 q/q ar change is now only rivaled by the 1958Q1 q/q change (-11.1%).
The increase in GDP relative to 2009Q1 (when the ARRA was passed) is the same as before
Figure 3: Log GDP from 2011Q2 advance release (blue) and from 2011Q1 3rd release (red), all in billions of 2005$, SAAR, rescaled to 2009Q1 normalized to zero. NBER defined recession dates shaded gray. Source: BEA, NBER and author’s calculations.
In making this assessment, it doesn’t matter if one normalizes on 2009Q1 or 2009Q2, as most of the negative growth took place before 2009Q1. In other words, the revisions do not alter the estimated growth trajectory of the economy. If one considers the effect of the stimulus as relative to where the economy started (recalling the ARRA only really started kicking in in 2009Q2), then one’s views should not be altered on the efficacy count. On the other hand, it is even more clear now that the size of the stimulus was wholly inadequate, as highlighted in the next graph.
The output gap is more negative than originally estimated (based on January 2011 CBO estimate of potential), and is now getting more negative
Figure 4: Log output gap from 2011Q2 advance release (blue) and from 2011Q1 3rd release (red), using CBO January 2011 version of potential GDP. NBER defined recession dates shaded gray. Source: BEA, CBO, NBER and author’s calculations.
Figure 4 is based on the CBO’s January 2011 estimates of potential GDP. Presumably, with additional information released by the BEA, the estimate of potential GDP will be revised downward over the last four years (the revisions are not substantial prior to 2007). Nonetheless, the implied output gap, at -6.9% in 2011Q1 versus the previously implied -5.3%, is daunting. The graph also highlights the fact that the output gap is widening, as fiscal stimulus is withdrawn, and the economy continues to encounter headwinds from high energy costs, faltering foreign demand for US goods, and uncertainty regarding future demand and fiscal policy.
It strikes me that this seems an odd time to embark upon fiscal consolidation that is front-loaded — i.e., has cutbacks in current or near-horizon spending. Certainly, this widening gap argues against tightening monetary policy, given the large amount of slack in the economy precludes a rapid acceleration in inflation.
Consumption and fixed nonresidential investment account for the largest components of the downward revisions in final sales of domestic product
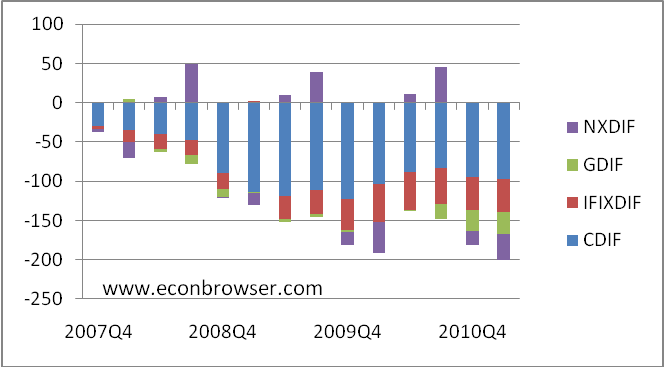
Figure 5: Difference between 2011Q2 advance and revision and 2011Q1 3rd release for real final sales. CDIF is consumption difference, IFIXDIF is fixed investment difference, GDIF is government spending difference, and NXDIF is net exports difference, all in billions of Ch.2005$. Source: BEA and author’s calculations.
The blue shaded areas highlight the large downward revisions in consumption, particularly in 2009, but also going through 2011Q1. The fixed investment revisions are almost entirely accounted for by fixed nonresidential – not a encouraging sign. While consumption, and to a lesser extent fixed investment, are the most important, in the preceding three quarters, government spending on goods and services accounted for large shares as well.
GDP per capita fell even more precipitously from 2008Q2 through 2009Q1 than originally estimated
Figure 6: Per capita GDP from 2011Q2 advance release (blue) and from 2011Q1 3rd release (red), all in billions of 2005$, SAAR, divided by population at midmonth (FREDII series POPTHM; June 2011 estimated using log first differences over 2009M01-11M05). NBER defined recession dates shaded gray. Vertical dashed lines at 2001Q1, 2009Q1. Source: BEA, FREDII, NBER, and author’s calculations.
Not only has real GDP, using revised data, not reattained pre-recession peak levels, per capita real GDP also remains below pre-recession levels.
The consumption decline is also more pronounced with new data
Figure 7: Per capita consumption from 2011Q2 advance release (blue) and from 2011Q1 3rd release (red), all in billions of 2005$, SAAR, divided by population at midmonth (FREDII series POPTHM; June 2011 estimated using log first differences over 2009M01-11M05). NBER defined recession dates shaded gray. Source: BEA, FREDII, NBER, and author’s calculations.
So here we have vividly illustrated the “consumption disaster” Professor Mulligan dismissed back in 2009. Not only is consumption flat in aggregate terms, in per capita terms it has turned downward in the latest quarter (advance) estimate.
Okun’s Law Re-estimated
The revisions have some implications for Okun’s law. Since there are a variety of Okun’s laws — some relate to levels (or more specifically gaps) and some relate to growth rates — one has to be specific. Below, I present a scatterplot of GDP growth rates from the latest and pre-revision series, against the growth rate of private employment.

Figure 8: Four quarter growth rates in GDP from 2011Q2 advance release and revision (blue circle), and from 2011Q1 3rd release (red +) against four quarter private employment growth, 1986Q1-2011Q2. Source: BEA, BLS via FREDII (June release), and author’s calculations.
Figure 9: Quarter on quarter annualized growth rates in GDP from 2011Q2 advance release and revision (blue circle), and from 2011Q1 3rd release (red +) against four quarter private employment growth, 1986Q1-2011Q2. Source: BEA, BLS via FREDII (June release), and author’s calculations.
The slope coefficient of a regression of employment growth on GDP growth is actually lower with the revised series over the 2009Q2-11Q1 period, which seems at odds with the perception that employment growth has been unnaturally low; this can be reconciled by the fact that the constant in such a regression is more negative.
Formal statistical tests indicate that the relationship between GDP growth and private employment growth has experienced breaks at each of the past two recessions, and strongly rejected stability (using 1-step-ahead recursive residual tests) in the last recession. This remains true regardless of whether one uses the pre-revision or post-revision data, although the rejection of stability is slightly less marked using the revised data.
To the extent that the Okun’s Law in growth rates is of interest, the mystery is not why current (post-recession) employment growth is so slow (given GDP growth), but rather why it was so low at the end of the recession (09Q1, 09Q2). Of course, this translates into a lower level of employment for given level of GDP at the moment, given that there was no underprediction of employment growth subsequent to the recession (as one might have expected on the basis of past experience, particularly after the 1990-91 recession).
Addition 8/3, 9am Pacific: Couple of items relevant to this from ESA: On revisions to employment; on employment change (not growth rate) and GDP growth. I’d also forgotten that I looked at this issue (abstracting from revisions) in this post.
Good News: Exports Unrevised
Figure 5 highlights that in recent quarters, the external sector has in a mechanical sense not been a big contributor to GDP growth. However, the diminished positive impact associated with the external sector over the 2010Q4 and 2011Q1 quarters has been due to upwardly revised import growth. Real exports were essentially unrevised.
Figure 10: Log exports of goods and services from 2011Q2 advance release (blue) and from 2011Q1 3rd release (red), all in billions of 2005$, SAAR. NBER defined recession dates shaded gray. Vertical dashed lines at 2001Q1, 2009Q1. Source: BEA, FREDII, NBER, and author’s calculations.
Real exports are 22.4% above 2009Q1 levels, and nominal exports are 37.7% (20.2% and 32.0% in log terms). Whether export growth can continue at this pace given uncertainty in Europe and a slowing Chinese economy remains to be seen.
Update, 8/1, 3:45pm Pacific: Reader Reidemandweep asserts that the growth rate during the recovery is slower using the revised data. Inspection of the growth rates 2009Q2 and thereafter show that conjecture is incorrect.
Figure 11: Annualized quarter on quarter growth rate of real GDP (calculated using log differences), from 2011Q2 advance release (blue), from 2011Q1 3rd release (red). NBER defined recession dates shaded gray. Source: BEA, NBER and author’s calculations.
Professor,
According to Bloomberg, the framework of the debt ceiling deal has already been worked out and will entail roughly $1 trillion in (immediate) cuts in federal spending.
Given the weak state of the economy, is it realistic to think that another recession can be averted?
What do you think of this estimate:
Debt ceiling proposal cuts spending $2.4 T for 10 years or $240 billion/year
Fed spending is $15 T
240/15,000 ~1.5%
That should depress GDP by 1.5% – 2.0% (e.g., Roemer in July 3 NYTimes says 1% cut => 1.5% GDP)
That should decrease employment 0.5% – 0.7% (Okun’s law)
Current employment is 150 million
So spending cuts result in losing 750,000 to 1 million jobs
That should have been GDP is $15 T, not fed spending at $15 T. Some have said lose 0.7% employ for 1% less GDP, rather than the 0.3% I suggest.
Raskolnikov: To answer your question, we need to know the time profile of spending cuts, and the distribution. Perhaps most importantly, we need to know how the cuts are measured against which baseline.
Yep, I’m assuming pro rata, while they are most likely back-loaded. Reportedly, these are actual cuts against existing spending, not cuts in assumed rates of growth.
Would you agree that a spending cut equal to 1% of GDP cuts GDP by 1% – 1.5% and that a 1% decrease in GDP cuts employment by 0.5%, give or take, in our current economy.
The world bank has an interesting website when comparing GDP deflators.It portrays a strange outcome when comparing GDP deflator for France and Germany and exhibit a European out lier when comparing France,USA and Germany. The plum on the cake is the UK deflator.
The most convenient thread is google GDP deflator then WB website GDP deflator change.
Only Menzie (and perhaps Paul Krugman) would come up with this lead sentence going into the third year of a president’s term with GDP so small you need a magnifying glass to see it.
Or things got a lot worse in 2008Q4 than we thought.
How about things got a lot worse after 2008Q4, duh.
Also, does anyone remember the most significant thing that happened in 2008Q4? Here is a hint. Its initials are TARP (or in Keynesian speak “stimulus”).
OK, so TARP or Keynesian stimulus coincided with the bottom in the economy.
That is the message you want to send, right Ricardo?
I’m starting to think Ricardo’s id has been hacked, the quality of his recent comments aren’t up to his normal high standards.
I would be interested in being directed to the Keynesian model that says loaning hundreds of billions of dollars to a handful of banks is Keynesian stimulus. If you want to post slams against economic theory you might at least pick the right example.
Ricardo: My reading of the pics above is that the trajectory of the recovery is little changed, but the base is much lower. So no, you can’t blame Obama. But nice try.
Mitch-
Maybe you are a better graph-reader than I am but it looks like GDP at the end of 2008 and current GDP have simply shifted downward. As John Taylor puts it – deeper recession, slower recovery. This recovery looks even worse when compared to the Recession That Dare Not Speak Its Name – the 81-82 Reagan recession. See Taylor’s link for the charts.
As a non economist, I have a question:
why aren’t the economists embarassed at how long it takes to reduce data ?
We are talking about 3 year old data here; surely, the many professionals who do this for a living can move a little faster.
Aren’t the legends between red and blue curves inverted?
thanks
Raskolnikov and foosion: I think the key issue is how much reduction is there relative to what spending was already anticipated (which is different from reduction relative to official baseline). From the Economist Free Exchange:
So, it seems that one bit of reduction is the fact that the continued reduction in payroll tax rates is not going to take place.
Some quantitative estimates run through a model are available from Macroeconomic Advisers, for the first and second Boehner plans, as well as the Reid plan. To the extent that the framework is similar to the Reid plan — if the triggers go into effect via only spending cuts — the drag is going to result in reduced growth of around 0.2 ppts per year over four years (extrapolating from MA figures).
ezra abrams: The economy is over $15 trillion — try tracking such a complex entity, with limited resources, and constant change.
raymond: I don’t think so; Figures 1-3 had the red series mislabeled as “2010Q1” instead of “2011Q1”, but otherwise are correct.
Reidandemweep: I have added Figure 11 for your benefit, which shows that the recovery (2009Q2 onward) is pretty much the same in growth rates, regardless of using pre-revision or post-revision data. (Of course, one knew this already because Figure 3 is essentially the cumulation of Figure 11…)
So much for the slowdown. Capital flows declined in the 2nd quarter and spending dried up. We did get a boost back with recovery from the “Jap-quake” and was the only reason the ISM was above 50.
The real question now is, will non-Bircher capital owners force the Birchers to relent and allow for major government mobilization of resources or does it take a national socialist uprising down the road after 1.00 dollar gas doesn’t do the trick? Of course that won’t be to after the banking system dies again and this time is allowed to stay dead.
My guess is to examine the economies of the Civil War and WWII period to see where we are going in a few years. Though government spending allocations during those years was influenced by the wars, this time by the need to rebuild. Though, in Asia’s mind, a industrially and infrastruturally rebuilding United States is a act of war to come, weather hot or cold. They have made their vast gains along with capital owners in this current global system, which is why the Birchers want to make sure the process isn’t stopped. The more extreme ones, like the Koch’s want to speed up the transfer from the middle class.
Alternate post title: Über-Keynesianism and QE ad nauseum not working; time for group-thinking academic economists to consider alternative theories?
Despite all of those charts showing some level of GDP recovery [immediately after Obama took office], one has to wonder why we continue to read articles like this:
http://online.wsj.com/article/SB10001424053111903520204576483882838360382.html
It just seems peculiar to the “average Joe” that economic data doesn’t translate into “street cred” … even Wall Street cred.
The obvious question is “whence the recovery?”
The most disturbing take away from the GDP revision is that more downward revisions are probably waiting for us at next year’s annual revision. Look at the signal of the economy in 2010 and 2011 from household surveys, like the CPS (the unemployment rate) and the Michigan survey (sentiment, income expectations). And ask yourself if the updated BEA estimates are in line with the household surveys. Maybe not. The BEA acknowledges that it’s revisions are cyclical. It is an interesting question why. It is possible that nonrandom survey responses…either via firm birth/death or choosing not to submit voluntary surveys is important. The BEA has really good source data for retail trade and services spending by households only through 2009. Personal income in particularly the interest and dividend income is only high quality in 2009 and early. The point…there is a lot of “made up” numbers for Household spending and income in 2010. This time next year we may very well be learning that the recovery was even weaker than we now know. Or maybe not….
W.C. Varones: Since the downward revision in GDP growth occurs in the quarters before the passage of ARRA, I’m not certain why you think this post should make us more (or less) skeptical of what you call Keynesian economics.