In our book Lost Decades, Jeffry Frieden and I tried to be as comprehensive as possible in documenting the history we described, the analytical results we reported, and the data we used. We had intended to rely to a greater degree on graphical depictions, but for a variety of reasons, not all the proposed graphs made it in. Hence, we present the graphs that didn’t make it into Lost Decades. (And, by virtue of the just-in-time nature of the web, updated!). The graphs are organized by chapters:
- Chapter 1. Welcome to Argentina: How America Borrowed Its Way into a Debt Crisis
- Chapter 2. Borrowing, Boom, and Bust: The Capital Flow Cycle
- Chapter 3. Risky Business Models
- Chapter 4. The Death Spiral
- Chapter 5. Bailout
- Chapter 6. Economy in Shock
- Chapter 7. The World’s Turn
- Chapter 8. What Is to Be Done?
- Chapter 9. Conclusion
Chapter 1: Welcome to Argentina: How America Borrowed Its Way into a Debt Crisis
The magnitude of the fiscal and external deficits the United States experienced over the last decade are displayed in Add-Figure 1.1. (The structural budget balance as of October 2010 is depicted here).
Add-Figure 1.1: Federal budget balance (blue) and current account balance (red), both as a share of GDP, seasonally adjusted. Source: BEA 2011Q2 2nd release for GDP. Federal budget balance is line 34 “Net government saving” for Federal government, Table 3.2. Current account is line 31 table 4.1.
Massive Federal dissaving in the early to mid-2000’s led, with a lag, to widening current account deficits in the mid to late-2000’s. Just like in the 1980’s.
The increase in Federal debt held by the public was to a great degree manifested in greater holdings by foreigners. Add-Figures 1.2 and 1.3 present long term Treasury (about 42% of total short- and long-term debt held by the public) and long-term Treasury and Agency debt holdings by foreigners, as of mid-2008, on the eve of the financial collapse.
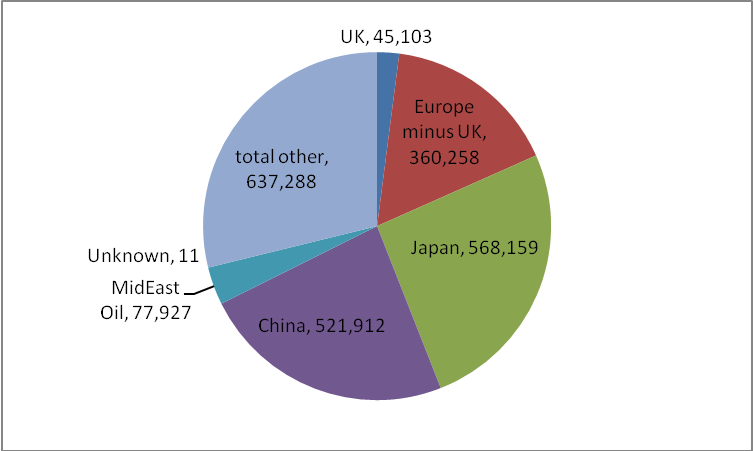
Figure Add-Figure 1.2: Shares of US Treasury long term securities held by foreigners, as of June 30, 2008. Figures are in millions of dollars. (Total held: $2,210,659 million). Source: TIC data.
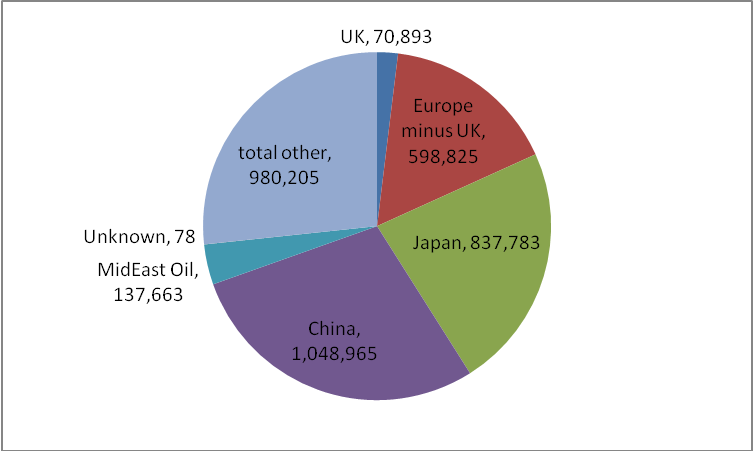
Figure Add-Figure 1.3: Shares of Long term Treasury and Agency securities, held by foreigners, as of June 30, 2008. Figures are in millions of dollars. (Total held: $2,210,659 million). Source: TIC data.
Half of the holdings of US Treasury securities and Treasury and Agency securities were held by China and Japan. While the Chinese and Japanese holdings were about the same size, China’s had caught up quickly, over the preceding five years.
Chapter 2: Borrowing, Boom, and Bust: The Capital Flow Cycle
As the slow recovery from the first G.W. Bush recession continued, the Fed dropped the policy rate to record lows. With positive inflation, the real interest rate (with expected inflation proxied by the previous year’s CPI inflation) dropped to record lows.
Add-Figure 2.1: Fed Funds effective rate minus lagged one year inflation rate (CPI); and household and nonprofit corporation liabilities as a ratio to disposable personal income. Source: St. Louis Fed FRED data as of September 25, 2011.
Even before negative real interest rates were realized, however, household debt to disposable personal income started its rise. In my view, negative real interest rates (especially at the medium to longer horizons) cannot be completely attributable to Fed policy [1] [2]; and real interest rates alone cannot explain the housing boom-bust cycle. [3]. (This doesn’t leave the Fed off the hook; it had the regulatory powers to rein in reckless bank lending.)
Chapter 4: The Death Spiral
Before describing the collapse, we needed to illustrate the boom in lending associated with mortgage backed derivatives. Add-Figure 4.1 shows the boom.
Add-Figure 4.1: Commercial paper, in billions of dollars, seasonally adjusted. Source: Federal Reserve Board, data releases.
The boom in the shadow financial system, as measured by asset backed commercial paper, started taking off in 2004, and peaked in 2007. The collapse in this market began over a year before the Lehman bankruptcy.
It’s important to remember there were “deniers” in the crisis area, just like in global climate change. The sunny assessment by Chari et al. (2008) (Minneapolis Fed WP 666), which pointed to the increase in bank lending as an indication that the crisis was not severe, is a memorable case in point. Credit spreads were signaling something else.
Add-Figure 4.2: Three month LIBOR-Treasury (TED) spread in percentage points, daily data. Source: IMF, WEO (September 2009), Figure 1.3.
The breakdown in global financial markets is highlighted by the TED spread, the gap between risky and riskless rates at the three month maturity. Clearly, financial markets were in crisis in the aftermath of Lehman. The reported TED spread likely understates the risk premium to the extent that there were almost no transactions at the time of the peak in the spread.
Chapter 5: Bailout
The response to the crisis occurred along several dimensions (fiscal, monetary, financial), and across countries. Add-Figures 5.1 and 5.2 highlight the fact that the fiscal [discretionary] stimulus in the US was rather modest, in relative terms.
Add-Figure 5.1 Stimulus package as share of GDP in percentage points, by fiscal years. Sum of spending and tax reductions. Source: CBO, Letter to Hon. Nancy Pelosi, regarding H.R. 1, American Recovery and Reinvestment Act of 2009 (February 13, 2009).
The decline in growth rates in mid-2010 was in some sense not so surprising. The stimulus was not very large as a share of GDP (and not particularly large relative to the output drop, as we now know, with revised GDP data [4]), and reduction in the growth rate of government spending and transfers was going to exert a drag on GDP in 2010 and 2011, even if GDP was higher than it otherwise would be [5].
Add-Figure 5.2: Discretionary Fiscal Measures in the G-20 countries, average over 2009-10, as share of GDP in percentage points. Source: Table 3.4, Staff of Fiscal Affairs Department, “Fiscal Implications of the Global Economic and Financial Crisis,” Staff Position Note SPN/09/13 (June 9, 2009).
Highlighting the fact that the US stimulus was not particularly large in comparison to what other countries did. The Chinese fiscal stimulus was a percentage point larger (and that figure did not include quasi-fiscal stimulus delivered through the banking system).
Chapter 6: Economy in Shock
One of the points we make in the book is that the concentration in income growth, and stagnation in median incomes, over the past decades led in part to policies that led to asset booms. With the deflation of these booms, the higher income groups still reap a very large share of income, as shown in this post. Add-Figure 6.1 shows how hourly wages have evolved.
Add-Figure 6.1: Wages for all workers by wage percentile, 1973-2009 (in 2009$). Source: EPI, State of Working America, 2011. [link]
By this measure, income inequality has deteriorated over the past forty years, but the deterioration has accelerated in the past decade and a half. Note the near constancy of real wages at the 20th and 50th percentiles.
It is not clear to me that reducing the tax rates on the highest income earners, reducing regulation, and cutting unemployment insurance and SNAP will address this issue.
Thanks for a nice summary of the study. It has been said, and I would agree, that US deficit problems could be solved by (1) ending the wars that are consuming so much money and (2) returning to the Clinton tax rates on income. But political interests may well prevent this. Sad.
Chris,
(2) returning to the Clinton tax rates on income.
How about returning to both Clinton tax rates AND Clinton spending rates?
Why be selective (and thus dishonest).
I will fully agree to a return to Clinton tax AND spending rates. Note that this is about a 33% cut in spending to get the same % of GDP.
‘Ending’ wars alone will not do it. A lot of Democrats employed in the public sector will have to be laid off to restore Clinton-era tax+spending.
Any takers? Come on, Chris, any takers?
Delighted to see that ‘median income’ – an economic descriptor – isn’t confused with ‘middleclass’ – a social descriptor. Progress?
Now if we can just get rid of the fatuous, worblespeak ‘metric’ for measurement…
The chart 4.1 is showing the same structure as the breakdown of the debt securities in Euro area 14.452 billions euros debts when the non financial sector share amounts to 702 billion euros.
(http://sdw.ecb.europa.eu/reports.do?node=100000286)
Anecdotic is the BOE “project Merlin” but it may not be so enchanting.
(http://www.bankofengland.co.uk/publications/other/monetary/additionaldata.htm)
2011 Q14 2011 Q25
Gross lending6 26.7 26.6
Net lending7 -2.8 -4.4
The British press has more volume.
May be of interest,the history of the great depression reveals that commercial paper was scarce.When allowed to print 3.5 billion usd against 40% gold and 60 % first grade paper,the Federal reserve did not find available commercial papers meeting with the criteria.
GK:
Chris talked about ending wars as one way to return to Clinton spending levels. Eliminating Medicare PartD would be another. And several months back, the President and Speaker Boehner proposed significant spending cuts coupled with revenue increases that would have gone a long way toward returning to Clinton-era taxes and spending. So there are plenty of takers for both tax increases and spending cuts (majority of Americans responding to recent surveys). Count me among them.
@GK- That would require a large cut in defense spending if you want to approximate how the money was spent. I suspect that would be filibustered. As to the rest, the number of federal employees has been relatively constant for nearly 40 years. It is not the number of workers, but rather what the govt spends, mostly Medicare, that is driving future debt. Cutting Medicare is our big dilemma.
Steve
@GK: Defense spending is at historic highs. And though it’s the same size, the same shape, and has the same abilities, the U.S. military costs 35 percent more than it did a decade ago. Read more: http://www.businessinsider.com/2012-us-defense-budget-largest-since-world-war-ii-2011-7#ixzz1ZAZhinBj. Defense including OCO averaged 50% of discretionary federal spending between 98 and 02, and increased to 55% by 2012.
So yes, Defense and OCO are the primary place to cut, as they have grown to the dominant element of discretionary federal spending.
We will go broke borrowing from the Chinese to fight endless overseas wars. So-called conservatives like GK would instead have us cut the legs off of our economy by cutting spending on the origins of economic growth — infrastructure and education. Not much “conservative” about that.
How was the stimulus in 2009 only 1.25% of GDP? ARRA was 800-900 billion, even if you tranche it over 2009-10, I’m not sure how you arrive at these data. Moreover, you have to include the budget deficit as stimulus for 2010-11. I never understood why economists who warn about impending ‘fiscal tightening’ subtracting 1-1.5% of aggregate GDP in the coming year somehow neglect the fiscal stimulus vis a vis the budget deficit since ARRA was passed. I would surmise that a fair chunk of ARRA has now been incorporated into future budgeting and appropriations, so how does that not count as stimulus?
lol GK, the growth in spending has been in “contracted” activities, the majority of which have been contracted out to Republican businesses, so what you meant to say is that “a lot of Republican businessmen will have to lose their government contracts.”
mark: To obtain your answers, read the CBO document that is hyperlinked in the notes to the figure (as well as subsequent CBO quarterly reports on ARRA). The figure notes also indicate that the data are by fiscal year. By the time ARRA was passed, a third of FY2009 had already gone by.
C Thomson: Regarding “metrics”; yes, we must ensure we retain purity of language for American speech, lest foreign words infiltrate the language, de facto if not de jure. Oops!
I any case, I look forward to reading my next issue of Economeasurement (not to mention Biomeasurement)!
New oil (Brent Crude 1M) price prediction 2011-2013:
http://saposjoint.net/Forum/viewtopic.php?f=14&t=2626&st=0&sk=t&sd=a&start=560#p34241
Ladies and Gentlemen.
The USA is in a catastrophic era that has no way out of due to ideology, governance, lobbyists, deregulation,financial theft on Wall St. The world has changed. Capitalism is in the hospital awaiting
surgery. No visitors allowed in.
I see the data on page 8 of the CBO document, but again you are not incorporating the extent to which the future deficits have now incorporated spending from ARRA. If 2010 tranche of ARRA was around 300bln net impact on deficit but then the FY 2010 total deficit was 1.5 trillion / 10% of GDP, then the fiscal stimulus was much larger than the numbers you present arguing that the fiscal stimulus was not that large relative to either GDP or the output gap. I still don’t understand how fiscal tightening is projected from a fall in the deficit (as economists are warning for 2012 currently), but then they do not count the fiscal thrust to deficits of 10% of GDP since ARRA was passed as part of the stimulus. The combined fiscal and monetary policy stimulus (including the QEs and now the stealth QE from $400 billion of duration taken out of the long yield curve) relative to the fall in real GDP is unprecedented compared to any period in modern history. Are we just going to keep borrowing and running negative real interest rates with a fiat currency forever to get us out of this? That works until it doesn’t, just like Bear Stearns financing its bloated balance sheet of RMBS in the repo market. They went from solvent and liquid to bankruptcy in about two weeks.
this is a lazy blog post, and you deserve, charitably, a D.
the pie chart for %, absolute values for foreign debt ? wtf??
mark: Perhaps we are having difficulty because of different language. I am speaking specfically of the discretionary measure called the ARRA. There are other bits of stimulus emanating from what are called in macroeconomics “automatic stabilizers”, including the marginal tax rate (which is mildly progressive), and transfers such as unemployment insurance and food stamps (SNAP) which do not necessarily require discretionary action on the part of the fiscal authorities.
I suggest you read the book to see the entire panoply of stimulus measures (both discretionary and via automatic stabilizers); I only mention the ones here that relate to the graphs. If I’d mentioned them all, that would be the entire book (and/or all the blogposts I’ve posted on the crisis — which you are free for you to read, and cover many of your questions).
ezra abrams: My apologies. I hope to rise to the high standards you have set. I regret you are unable to glean visually from the slices of the pie chart the rough percentages, and must resort to a calculator to do the exact calculations (which you could do with excel if you clicked through to the US Treasury TIC page).
I somehow doubt I will ever match your expectations, however, as you wrote on July 2, 2011 6:47PM:
Romer and Romer spent a lot of time on that project, and you weren’t satisfied (though I’m not certain, from your comment, you actually read and understood the paper). How am I to match that in a blogpost?
It has nothing to do with language or semantics; nowhere in the ‘bailout’ section of this blog post do you say that you are only alluding solely to ARRA. Instead you are proxying fiscal stimulus by the size and tranching of ARRA over time when in reality if you include the fiscal thrust of deficits, change in monetary policy, and contingent liabilities (bank-guaranteed bond issues, TALF, Fannie/Freddie capitalization and debt guarantees), then the aggregate size of stimulus to the economy is much larger relative to the fall in GDP than any other recession the country has had.
But as we are just discussing just the fiscal side of it, I’m just disputing your claim “the fact that the fiscal stimulus in the US was rather modest, in relative terms” neglects things like the swing in the budget deficit, the size of the budget deficit post-ARRA, and the extent to which ARRA has now been budgeted in future appropriations. The same people now who decry stealth austerity/tightening from normalization in the budget deficit are the same people who disregard FY 2009-11 budget deficits as part of the total fiscal stimulus undertaken. If tax revenues and nominal GDP have rebounded from 2009 levels when ARRA was passed, yet the budget deficit is still at the same level, then the budget deficit is indubitably fiscal stimulus and must be counted in your data in addition to ARRA.
mark: Well, actually, the word “Discretionary” is in the notes to Add-Figure 5.2, and it’s implicit in the notes to Add-Figure 5.1 (the noun “package” modified by the adjective “stimulus”). But if it would make you happy, I’ll put the word “discretionary” in there; I’ll be even happier if you reciprocate, and buy the book.
haha ok I’m a happy camper now, i’ll wait for the book reviews from amazon and academe before I buy. If it’s anywhere near reinhart and rogoff then I will definitely buy
The proper measure of fiscal stimulus is the budget deficit, no? Does it matter much what we call it?
The decline in growth rates in mid-2010 was in some sense not so surprising.
In what sense was it not surprising? Almost all the forecasters reduced their growth estimates during Q2 and Q3. Shouldn’t the decline of government spending–a predictable variable–already have been factored in? What was the surprise in comparison with that? What was it that macroeconomic models are not catching?
Steven Kopits The proper measure of fiscal stimulus is the budget deficit, no?
No. A better measure of fiscal stimulus is the log of the change in the deficit. Going from a $1.0T deficit to a $1.1T deficit with a $10.0T economy represents a stimulus of 1%. Going from a $1.0T deficit to $0.9T deficit represents a 1% fiscal drag.
Randall Parker (http://randallparker.blogspot.com/)
posted an interesting article on economic models:
http://johnbtaylorsblog.blogspot.com/2011/09/not-more-of-same-model-simulations.html
Steve,
@GK- That would require a large cut in defense spending if you want to approximate how the money was spent. I suspect that would be filibustered. As to the rest, the number of federal employees has been relatively constant for nearly 40 years. It is not the number of workers, but rather what the govt spends, mostly Medicare, that is driving future debt. Cutting Medicare is our big dilemma
I would happily agree to a return to Clinton-era tax rates if we can cut spending to Clinton-era levels.
But only then. Either all-Clinton or nothing.
Actually, public sector workers AND their paychecks have both risen in the last 12 years. Cutting that to the levels of 1999 would be a huge setback to the bureaucracy.
SH,
So-called conservatives like GK would instead have us cut the legs off of our economy by cutting spending on the origins of economic growth
Hypocrite. So you want the tax rates of Clinton but the same spending rates as Clinton would ‘cut the legs off our economy’?
Then tax rates cannot rise to Clinton levels either. No freebies for you (the statement a leftist most dreads to hear).
David Penwell Sorry, but it was just another one of John Taylor’s misbegotten electronic spasms. In case he doesn’t know this, the stimulus did in fact perform pretty much as advertised. The stimulus did in fact save or create 2-3 million jobs. The problem is that this was well short of anything needed to keep unemployment at bay. If John Taylor doesn’t know this, then he should give up his tenured position at Stanford because he is clearly not qualified to teach unsuspecting students. If John Taylor is familiar with the facts but chooses to ignore them because they are not a good fit with his political agenda, then he is being dishonest and should quit doing anymore research. I’m feeling charitable so I’ll assume that Prof. Taylor is just a busy man and hasn’t actually had time to follow the ARRA debate. He might find it news that Romer actually estimated that a stimulus of almost double what we got would be needed…and that calculation was made in Nov/Dec 2008, long before we knew just how bad the collapse really was. The rest of Taylor’s argument also shows that he hasn’t kept up with current events. All of that stuff about intertemporal effects is fine and dandy if you think economics is only about the long run view and people are indifferent about short run problems. What he says is irrelevant when the economy is in a liquidity trap and the Wicksellian clearing interest rate is negative. What he says is irrelevant when people are more concerned about just getting through the next few weeks than they are worried about taxes over the infinite horizon. Infinite horizon models might be compelling if you’re a well-heeled economist whose biggest worry is whether to buy the BMW or the Porsche, but the other 99.99% of us are more worried about the short-run.
GK: Another needlessly insulting comment on my comment. The fact that I did not mention spending hardly justified calling me “dishonest”. Again I find your manners obnoxious and as I said re a previous topic, since you like to hang out here I will go elsewhere. My last comment, this one.
Chris: Don’t be too hasty. GK is left in an endless loop of restating belligerently over and over this mantra that he is happy to have Clinton era tax rates as long as he gets Clinton era spending (about 6 times by my count), in his various guises as Heterosexual and David, but that’s merely a statement of his preferences. In fact, it might be optimal to have a higher level of spending given the aging of the population, and preference for health care, than during the Clinton era. In that case, we might also need a tax revenue intake higher than the Clinton era.
I’d also take Clinton tax rates and Clinton spending.
But then that would mean putting back on the tax rolls some of the roughly 50% of the population who pay no federal income tax (or even negative “income tax”) at all.
I am quite sure, however, that reversing the trend in the ratio of freeloaders to taxpayers is quite contrary to Obama’s re-election strategy. If a majority of voters are dependent on handouts from the welfare state, well, that’s a recipe for Democratic electoral dominance in perpetuity.
Which, I believe, is why our notedly partisan econ blogger seems perpetually devoted to more progressive redistribution schemes.
“Massive Federal dissaving in the early to mid-2000’s led, with a lag, to widening current account deficits in the mid to late-2000’s. Just like in the 1980’s.”
Um No, I can’t see that in the data at all.
Menzie –
You’re talking about aggregrate versus incremental stimulus, no?
If the government is running a deficit, we would say it is stimulating the economy, if I understand correctly. However, to create incremental stimulus, you have to increase the deficit. This is what the $447 bn jobs plan looks to do, as I understand it.
The risk of this approach is, of course, that it doesn’t really work. And it might not work because we’re constrained on the oil supply. If we don’t have enough oil, then we either need to i) increase efficiency, ii) decrease economic activity, or iii) increase the oil supply. Per capita US oil consumption is down 15% since 2005. That’s a fair bit of efficiency to find. If efficiency gains are capped at some rate (we need a study, please!–call it Claudia FSS #2), then incremental adjustment must come from either reducing economic activity or increasing the oil supply.
If we can’t or won’t increase the oil supply, then adjustment must come from reduced economic activity. This reflects my belief about recent events. Now, can we stimulate our way out of a need to reduce economic activity to meet our energy budget?
In the 1970s, the answer to Burns/Miller (or “Arthur Miller”, as they’re affectionately known here) on the monetary side was “no”. Inflation will not solve a real energy shock. A brutal reduction in consumption, a la Volcker, proved the answer.
If we are consuming above our sustainable energy budget, then borrowing more money to sustain this consumption is just digging the hole deeper. The country will need ever-increasing deficits (incremental stimulus packages) to try to stave off reductions in consumption which are ultimately unavoidable. Thus, by this line of thinking, current fiscal policy is merely repeating the policy mistakes of the first oil shock, except on the fiscal rather than monetary side this time around.
Whether or not this hypothesis is right is neither a matter of opinion nor ideology, but brute force technical analysis. This analysis should be performed by competent macroeconomists, hence my repeated calls for the Fed to assign a full-time manager and two analysts to understanding the effect of oil prices on the economy. Accept or reject the hypothesis, but we need to be smarter on the topic.
reason: See figure 1 of this post.
GK,
Chris seems, to any honest observer, to be expressing his policy preferences, rather than offering a short-hand description of the change in fiscal policy since Clinton. So there’s nothing dishonest about what he’s done. What you’ve done, however, is doubly dishonest, in taking a perfectly honest comment and accuse the poster of dishonesty to serve your own purpose.
So, no takers here. Until you replace your pugnatious tone and deceit with an actual willingness to discuss policies on their merit, there’s no sense in paying further attention to you. And, just by the way, repeating your own policy preference and saying that’s all that you will tolerate? So what? You don’t actually matter all that much.
Chris,
You’re probably right about the deficit, as it exists. However, my understanding is that future budgets will be thrown out of balance by rising medical costs. So there is still work to do, even if we adopt your scheme. Oh, and about a trillion dollars of road, bridge and sewer repair that we need to do.
Steven Kopits: Yes, I’m talking incremental stimulus relative to baseline.
Without knowing what you mean by “constrained”, it’s hard to assess your description. If production functions are Leontiev (no substitution between energy, capital and labor despite relative price changes), then you might be right (in a supply determined system). On the demand side, the argument seems to rely upon the argument that when the relative price of energy rises, the total share of expenditures on energy rises — which is something I’m willing to entertain. Nonetheless, extra disposable income, or government spending, should increase aggregate demand. Then the question is (as it always is) what is the slope of the aggregate supply curve?
The onset of the next big global stock market meltdown could be imminent, not unlike fall ’08.
Be prepared. Good luck.
I would like GK to comment on a point that perhaps has escape him:
Since 1995 the Republican Party have had control of Cogress or half of it or of presidency almost continuously. Any changes to federal spending and taxation have been done by the Republican party of could have been undone by the Republican party.
Why has the Republican policy been to change the Clinton formula to a point that you consider very bad and you want to go back? Will you vote again for a party that has been in power for so long and in your view during that time has mismanaged the Federal budget so much?
Menzie –
Yes, I agree. We are speaking of a supply-constrained system. I’ll send you some material off-line by way of background if you’re interested in the topic.
Of course, government spending can increase economic activity while the spending lasts. But the point is to prime the pump or smooth consumption, rather than bring forward consumption prior to a greater fall. Counter-cyclical spending should be like an aspirin after the party, not like binge drinking before the hangover.
If aggregate supply is constrained by a commodity, then the response of AS to stimulus is likely to be sluggish. If we have no more oil to use, then an incremental employee can consume only such oil as another citizen is willing to cede him–and that to me seems a potentially material constraint. In such a case, I could argue that deficit spending is not a bridge, but rather a ramp, with a fall waiting on the other side.
Steve Kopits Menzie’s point about Leontiev marginal rates of technical substitution (MRTS) curves is one that I’ve also made before in the context of energy constraints. If you believe that MRTS curves are always right angles, then you believe that no input can be used as a substitute for another input. It also means you’re a closet Marxist, but nevermind for now. The adult version of supply side economics, as opposed to the silly Laffer curve mumbo-jumbo, has always been that government policy should try to encourage the flattening of MRTS curves. This is the best way for an economy to insulate itself from supply shocks. When economists talk about microeconomic foundations for macro…that’s the kind of thing they should be talking about instead of intertemporal Euler functions, blah, blah, blah. Notice that encouraging an energy policy that tries to flatten the MRTS curves is not the same thing as an energy policy that emphasizes conservation. If you emphasize conservation without also making the economy’s production functions more flexible, then you also magnify the economy’s vulnerability to supply shocks because there is less “give” in the marginal barrel of oil. You want to make things more elastic, not less elastic.
As to the “Arthur Miller” conundrum, I think the point is that as long as aggregate demand is maintained, then the economy will automatically shift the production input mix away from energy and towards labor, capital and materials…unless of course you believe MRTS curves are Leontiev. If substitution does not occur and there is a supply shock, then output must contract because a price change in a Leontiev model can only result in a shift in isoquants.
It’s really important that we understand whether capital & energy as well as labor & energy are complements or substitutes. You see conflicting research on both sides of the argument. My own view is that capital & energy are evolving more as substitutes than as complements, which is a reversal of how things used to be. I suspect that’s because today “capital” means something different than it used to mean.
Slugs –
Wrt to mrts, the thing with oil is that it is virtually a miracle substance. For transportation, it’s not better than the substitutes, it’s much better than the substitutes. That’s the whole problem.
Can you substitute capital or social organization for oil? Sure. I could move the office back to Princeton and save 110 miles of daily commuting. And my staff in NY would lose their jobs. And I might not get the same staff in a small town that I can find in New York. But that’s exactly what a recession and recovery is all about, I think, liquidating fixed cost structures and reconstituting social activity in new forms compatible with emerging input constraints. On a societal level, history suggests that’s typically going to be a traumatic and difficult transition.
Steven Kopits
“reason: See figure 1 of this post.”
????
It shows the response of the trade balance to the real exchange rate. Now in a world with a properly functioning financial sector, you could argue that government decifits would push up interest rates, which would push up exchange rates and so blow out the trade deficit – but we don’t live in that world.
In fact look at this:
http://streetlightblog.blogspot.com/2011/09/what-really-caused-eurozone-crisis-part.html
reason: That comment is by me, not Steve Kopits. Commenter names are below the comment.
Apologies, see Figure 4 of this post.
OK Menzie,
then my reading of the data is that this worked well up until about 1990 and then fell apart. So using it to explain the present circumstances is suspicious at best.
I’m in the school of thought that things a disfunctional international financial system is at the very heart of our problems (admittedly exacerbated by secondary responses). And that graph doesn’t make me uneasy holding that position at all.
Lost decades is now available in Paris
Library Galignani
224 rue de Rivoli
Paris 1
Price of the book 43 euros.20cents
When showing the graph, on the page of cover to a broker,thinking it was a morality curve one could hear “add on the short position”