I’ve just finished a new paper on Oil prices, exhaustible resources, and economic growth, which explores details behind the phenomenal increase in global crude oil production over the last century and a half and the implications if that trend should be reversed. Below I reproduce the paper’s summary of the history of oil production from individual U.S. regions.
From Oil prices, exhaustible resources, and economic growth:
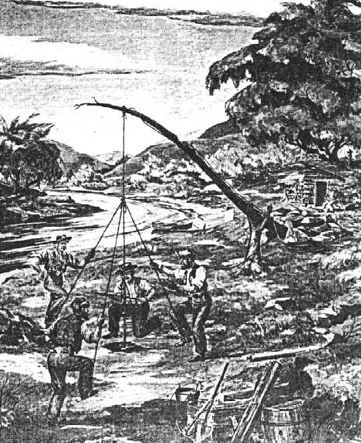
Certainly the technology for extracting oil from beneath the earth’s surface has evolved profoundly over time. Although Drake’s original well was steam-powered, some of the early drills were driven through rock by foot power. Figure 2 illustrates one approach based on a spring-pole. The workers would kick a heavy bit at the end of the rope down into the rock, and spring action from the compressed pole would lift the bit back up. After some time at this, the drill would be lifted out and a bucket lowered to bail out the debris. Of course subsequent years produced rapid advances over these first primitive efforts– better sources of power, improved casing technology, and vastly superior knowledge of where oil might be found. Other key innovations included the adoption of rotary drilling at the turn of the century, in which circulating fluid lifted debris out of the hole, and secondary recovery methods first developed in the 1920s, in which water, air, or gas is injected into oil wells to repressurize the reservoir and allow more of the oil to be lifted to the surface.
Figure 2. Drilling for oil with a spring-pole. Source: American Oil and Gas Historical Society.
.
Figure 3 plots the annual oil production levels for Pennsylvania and New York, where the industry began, from 1862 to 2010. Production increased by a factor of 10 between 1862 and 1891. However, it is a mistake to view this as the result of application of better technology to the initially exploited fields. Production from the original Oil Creek District in fact peaked in 1874 (Williamson and Daum, 1959, p. 378). The production gains instead came primarily from development of new fields, most importantly the Bradford field near the Pennsylvania-New York border, but also from Butler, Clarion, and Armstrong Counties. Nevertheless, it is unquestionably the case that better drilling techniques than used in Oil Creek were necessary in order to reach the greater depths of the Bradford formation.
Figure 3. Annual crude oil production (in thousands of barrels per year) from the states of Pennsylvania and New York combined.
One also sees quite clearly in Figure 3 the benefits of the secondary recovery methods applied in the 1920s, which succeeded in producing much additional oil from the Bradford formation and elsewhere in the state. However, it is worth noting that these methods never lifted production in Pennsylvania back to where it had been in 1891. In 2010– with the truly awesome technological advances of the century and a half since the industry began, and with the price of oil 5 times as high (in real terms) as it had been in 1891– Pennsylvania and New York produced under 4 million barrels of crude oil. That’s only 12% of what had been produced in 1891– 120 years ago– and about the level that the sturdy farmers with their spring-poles were getting out of the ground back in 1868.
Although Pennsylvania was the most important source of U.S. oil production in the 19th century, the nation’s oil production continued to increase even after Pennsylvanian production peaked in 1891. The reason is that later in the century, new sources of oil were also being obtained from neighboring West Virginia and Ohio (see Figure 4). Production from these two states was rising rapidly even as production from Pennsylvania and New York started to fall. Ohio production would continue to rise before peaking in 1896, and West Virginia did not peak until 1900.
Figure 4. Annual crude oil production (in thousands of barrels per year) from the states of Pennsylvania and New York combined (top panel), Ohio (middle panel), and West Virginia (bottom panel).
These four states together accounted for 90% of U.S. production in 1896, with the peak in production from the region as a whole coming that year (see Figure 5). Overall U.S. production declined for a few years with falling supplies from Appalachia, but quickly returned to establishing new highs in 1900, thanks to growth in production from new areas in the central United States, details of which are shown in Figure 6. Note the difference in scale, with the axes in Figure 6 spanning 6 times the magnitude of corresponding axes in Figure 4. Each of the regions featured in Figure 6 would eventually produce far more oil than Appalachia ever did. These areas began producing much later than Appalachia, and each peaked much later than Appalachia. The combined production of Illinois and Indiana peaked in 1940, Kansas-Nebraska in 1957, the southwest in 1960, and Wyoming in 1970.
Figure 5. Combined annual crude oil production (in thousands of barrels per year) from the states of Pennsylvania, New York, West Virginia, and Ohio.
Figure 6. Annual crude oil production (in thousands of barrels per year) from assorted groups of states in the central United States.
Far more important for U.S. total production were the four states shown in Figure 7, which uses a vertical scale 2.5 times that for Figure 6. California, Oklahoma, Texas, and Louisiana account for 70% of all the oil ever produced in the United States. Production from Oklahoma reached a peak in 1927, though it was still able to produce at 80% of that level as recently as 1970 before entering a modern phase of decline that now leaves it at 25% of the 1927 production levels. Texas managed to grow its oil production until 1972, and today produces about a third of what it did then. California production continued to grow until 1985 before peaking. The graph for Louisiana (bottom panel of Figure 7) includes all the U.S. production from the Gulf of Mexico, growing production from which helped bring the state’s indicated production for 2010 up to a value only 33% below its peak in 1971.
Figure 7. Annual crude oil production (in thousands of barrels per year) from 4 leading producing states. California includes offshore and Louisiana includes all Gulf of Mexico U.S. production.
Figure 8 plots production histories for the two regions whose development began latest in U.S. history. Production from Alaska peaked in 1988. North Dakota is the only state that continues to set all-time records for production, thanks in part to use of new drilling techniques for recovering oil from shale formations. To put the new Williston Basin production in perspective, the 138 million barrels produced in North Dakota and Montana in 2010 is about half of what the state of Oklahoma produced in 1927 and a fifth of what the state of Alaska produced in 1988. However, the potential for these fields looks very promising and further significant increases from 2010 levels seems assured.
Figure 8. Annual crude oil production (in thousands of barrels per year) from Alaska (including offshore), North Dakota, and Montana.
The experience for the U.S. thus admits a quite clear summary. Production from every state has followed a pattern of initial increase followed by eventual decline. The feature that nonetheless allowed the total production for the U.S. to exhibit a seemingly uninterrupted upward trend over the course of a century was the fact that new, more promising areas were always coming into production at the same time that mature fields were dying out (see Figure 9). Total U.S. production continued to grow before peaking in 1970, long after the original fields in Appalachia and the central U.S. were well into decline.
Figure 9. Annual crude oil production (in thousands of barrels per year) from entire United States, with contributions from individual regions as indicated.
And the decline in production from both individual regions within the U.S. as well as the United States as a whole has come despite phenomenal improvements in technology over time. Production from the Gulf of Mexico has made a very important contribution to slowing the rate of decline over the most recent decade. Some of this production today is coming from wells that begin a mile below sea level and bore from there through up to a half-dozen more miles of rock– try doing that with three guys kicking a spring-pole down! The decline in U.S. production has further come despite aggressive drilling in very challenging environments and widespread adoption of secondary and now tertiary recovery methods. The rise and fall of production from individual states seems much more closely related to discoveries of new fields and their eventual depletion than to the sorts of price incentives or technological innovations on which economists are accustomed to focus.
Notwithstanding, technological improvements continue to bring significant new fields into play. The most important recent development has been horizontal rather than vertical drilling through hydrocarbon-bearing formations accompanied by injection of fluids to induce small fractures in the rock. These methods have allowed access to hydrocarbons trapped in rock whose permeability or depth prevented removal using traditional methods. The new methods have enabled phenomenal increases in supplies of natural gas as well as significant new oil production in areas such as North Dakota and Texas. Wickstrom, et. al. (2011) speculated that application of hydraulic fracturing to the Utica Shale formation in Ohio might eventually produce several billion barrels of oil, which would be more than the cumulative production from the state up to this point. If that indeed turns out to be the case, it could lead to a third peak in the graphs in Figure 4 for the Appalachian region that exceeds either of the first two, though for comparison the projected lifetime output from Utica would still only correspond to a few years of production from Texas at that state’s peak.
Obviously price incentives and technological innovations matter a great deal. More oil will be brought to the surface at a price of $100 a barrel than at $10 a barrel, and more oil can be produced with the new technology than with the old. But it seems a mistake to overstate the operative elasticities. By 1960, the real price of oil had fallen to a level that was 1/3 its value in 1900. Over the same period, U.S. production of crude oil grew to become 55 times what it had been in 1900. On the other hand, the real price of oil rose 8-fold from 1970 to 2010, while U.S. production of oil fell by 44% over those same 40 years. The increase in production from 1900 to 1960 thus could in no way be attributed to the response to price incentives. Likewise, neither huge price incentives nor impressive technological improvements were sufficient to prevent the decline in production from 1970 to 2010. Further exploitation of offshore or deep shale resources may help put U.S. production back on an upward trend for the near term, but it seems unlikely ever again to reach the levels seen in 1970.


My paper goes on to discuss trends in world oil production since 1973, and draws on the economic experience of historical episodes of temporary oil supply disruptions to consider the possible implications if global oil production were to soon reach a peak as well.
Following is a chart showing actual global Crude + Condensate production for 2002 to 2010, along with a projection showing where we would be in 2010 at the 2002 to 2005 rate of increase in production. The shaded area represents what I call the “Yergin Gap.”
http://i1095.photobucket.com/albums/i475/westexas/Slide05.jpg
Only if we include biofuels, which of course have a very low net energy component, have we seen a material, but still quite small, increase in global total liquids production relative to 2005 (up at 0.5%/year from 2005 to 2010, EIA).
But the real story is the ongoing decline in Global Net Exports* (GNE) and Available Net Exports (ANE), which are measured in terms of total petroleum liquids.
GNE fell at an average volumetric rate of about 0.6 mbpd (million barrels per day) per year from 2005 to 2010. From 2010 to 2020, I suspect that the GNE volumetric decline rate will be between 0.6 and 1.0 mbpd per year. Following is a “Yergin Gap” chart for GNE:
http://i1095.photobucket.com/albums/i475/westexas/Slide07.jpg
ANE fell at an average volumetric rate of about 1.0 mbpd per year from 2005 to 2010. From 2010 to 2020, I suspect that the ANE volumetric decline rate will be between 1.0 and 2.0 mbpd year. Following is a “Yergin Gap” chart for ANE:
http://i1095.photobucket.com/albums/i475/westexas/Slide08.jpg
Let me put it this way, the five year decline in ANE, which is the volume of exported oil available to importers other than China & India, was equivalent to total US crude oil production in 2008.
The reality that the is US facing, i.e., what the 2005 to 2010 numbers show, is that a slow rate of increase in US domestic production is not coming close to offsetting the decline in ANE.
In other words, I suspect that we are being shut out of the global market for exported oil faster than the slow rate of increase in US crude oil production, but time will tell.
The average US crude oil production rate in 2010 was 5.5 mbpd (C+C, EIA). Average US crude oil production for 2011 through September, 2011 was 5.6 mbpd, and if most recent production data are accurate and continue through year end, I suspect that the average US crude oil production rate for 2011 will probably be between 5.65 and 5.70 mbpd, versus a 1970 peak of 9.6 mbpd.
If the US had not released some oil from the SPR, I suspect that we might be down to one to two days supply of crude oil inventories in excess of MOL (Minimum Operating Level). I have heard that light/sweet oil supplies are very tight in the Atlantic Basin, and I think that there is a good chance that we will see another release of emergency oil supplies by IEA countries, as we head into the Northern Hemisphere winter.
*GNE = Total net oil exports from top 33 net oil exporters in 2005, total petroleum liquids, BP + Minor EIA data. ANE = GNE less the Chindia region’s combined net oil imports.
Nice post.
I think we have to wait and see what the shales can produce. They have had a huge impact on gas markets. Now let’s see what they can do for oil.
We know what has happened. We do not know what will happen. I can argue that US production has been held down by the minimal cost of production in the Persian Gulf, and the depredations of the sogenannten “environmentalists”. The former seems to be changing. Note the gap between Brent at ~$110/bbl. and WTI at ~$80 over the last few weeks.
We may be seeing the first leafs of spring in the oil market. NG at ~$4/mmbtu (about a quarter to a fifth of the energy content price of crude oil), is one cause for optimism. That the greenies seem to be loosing their grip on politics is another.
“Charles Mackay,” on The Oil Drum, tracks inventory data and export/import trends. Following is a link to his post today:
http://www.theoildrum.com/node/8507#comment-844580
As noted above, my thesis is that we have a race between slowly increasing US crude oil production and declining Available Net Exports (ANE). The data that Charles presents suggest that we are not presently winning the race. We will see what happens as time goes on.
Jim,
I realize you were probably pushed for space, but it would have been nice to see a mention of exporters’ own consumption alongside the emerging economies.
Other than that, a great survey!
Greg,
Following is a chart that shows production by the (2005) top 33 net oil exporters (top line curve), then net oil exports from the top 33, which I define as Global Net Exports (middle curve) and then Available Net Exports (bottom curve):
http://i1095.photobucket.com/albums/i475/westexas/Slide09.jpg
The top shaded area is top 33 consumption. The middle shaded area is Chindia’s combined net imports. And the bottom shaded area corresponds to available net exports. The rates of change per year for 2002 to 2005 and for 2005 to 2010 are shown.
Oil is virtually irrelevant. Whatever we can do with oil we could do with natural gas–more cleanly–and we have 100 year supply of natural gas, and increasing.
It takes WTIC of $80-$85/bbl or higher to encourage an increase in non-conventional “oil”, but historically the US economy has not grown in terms of real GDP per capita with the price of oil persistently above $20-$30.
We can’t have our costly oil (crude, shale, tar sands, etc.), booming oil patch, AND growth of real US GDP per capita.
And the central banks can’t print cheap liquid fossil fuels in abundant supplies, nor can the politicians tax, borrow, and spend it into existence. The more they print and borrow, the higher the price of commodities, the lower the US$, the more costs pass through to firms and households, and the more real GDP per capita contracts.
Jeff Rubin gets it:
http://www.jeffrubinssmallerworld.com/2011/10/19/peak-oil-is-about-price-not-supply/
And no one is telling the OWSers that our situation is the culmination of at least 40 years’ worth of cause-effect phenomena resulting from the peak of US crude oil production in 1970-85 after 50 years of 4-5%/yr. growth and having built an economy and mass-social expectations on that growth.
To keep the game going after US crude oil peak production, we deindustrialized, financialized, and militarized the US economy, creating $52 trillion to date in total credit market debt owed, which is approaching 10 times private wages, more than 5 times private GDP, and an equivalent compounding interest obligation to avg. term of 100% of GDP.
But some so-called “Progressives” claiming to advocate for the OWSers and the working class are proposing still more of what got us here to date: more gov’t, more spending, more taxing, more borrowing, more social programs, and the like.
But social-democratic “solutions” require growth of systemic net energy surpluses and of capitalist profits and capital accumulation. For 25-26 years (arguably longer), the US has accumulated primarily “financial capital” surpluses (to the top 0.1-1% to 10% of households) from the growth of debt, while drawing down on physical capital and crude oil stocks to the point that an entire year’s output of the economy is now committed to debt service on the total debt for the next 7-10 years or longer.
The overwhelming majority of economists, politicians, policy makers, Wall Streeters, and financial media shills and pundits either are unaware of the facts above or are loathed to acknowledge them or internalize the implications going forward.
As precarious as the situation is in the US and EU, the conditions and implications are infinitely worse in “Chindia” and the so-caled “developing world” (developing expectations of a western-like standard of material consumption that cannot be met) where population overshoot and loads far exceed sustainable carrying capacity, and no possible way they can avoid an eventual collapse in fossil fuel net energy per capita and the implied decline in real GDP per capita at some point, perhaps sooner than later.
bmz, at what cost of production and price of the gas and to economic output per capita after price effects? And at what rate of consumption for that 100-year horizon?
If you do the numbers and also include the costs maintaining the existing crude-based infrastructure indefinitely, you will be required to reset your thinking and reconsider what is actually possible.
Very ineteresting paper Prof. Hamilton. Do you have any paper on how oil price or supply affect currencies?
Bruce,what a mumbling muttering post.
The US economy has grown with Oil higher than 20-30 a barrel, because that isn’t always constant in real numbers.
The truth is, have job, pay price tranfer. Less jobs and less money destroy the need of “cheaper fuel”. 1.00 gas would look expensive then.
bmz,
While US natural gas production has been increasing, the fact remains that the US remains one of the world’s largest net natural gas importers, and our net natural gas imports increased from 2009 to 2010 (EIA).
Furthermore, it’s a safe assumption that at least 90% of all shale gas wells currently producing will probably be plugged and abandoned, or down to marginal production rates, by 2020.
So my takeaway is that instead of supply elasticities government policies should focus on substitution elasticities.
Rage, mumbling? Muttering? Perhaps you don’t understand because you don’t have the facts against which to judge what I wrote.
Look at the BP data for the price of oil adjusted for US$2010 and then look at real GDP per capita over a 10-year period. Using these metrics, the US is at a similar level for 10-yr. avg. real GDP per capita as in the 1890s and 1930s. If one adjusts for real private GDP per capita, the performance is worse.
In fact, the 10-yr. avg. of real private and total GDP per capita today is lower than in the early ’80s, the Rust Belt depression, which was the worst recession since the Great Depression of the 1930s.
Moreover, US full-time employment per capita is back to the levels of the late ’70s to early ’80s. Growth?
Total private payrolls per capita are at the level of the mid-’80s. Growth?
Total US employment for males per capita has collapsed back to the levels of the early to mid-’60s. Growth?
Total local, state, and federal gov’t spending, including personal transfers, now equals total US private wages. Growth? Not in what we presumably want to grow.
Total compounding interest obligations on the total US credit market debt owed over the next decade and longer is now an equivalent of one year’s worth of US GDP. Growth?
And none of these factors have anything to do with the US reaching peak production of crude oil during 1970-85 and the deindustrialization and financialization that thereafter commenced, one presumes?
Rage, hereafter please don’t confuse your uninformed opinions with facts and your inferences therefrom as worthy of a response.
According to EIA 2010 was the third year in a row that natural gas imports have decreased
http://www.eia.gov/todayinenergy/detail.cfm?id=770
2011 will be the fourth
Eric,
I’m afraid that the EIA made a mistake on their net imports chart. If you look at the link that you provided and hover over the 2009 and 2010 data points for production & consumption, you will find the following:
Net imports = Production – Consumption (TCF/year)
2009:
20.6 – 22.8 = -2.2
2010:
21.6 – 24.1 = -2.5
Which of course is a year over year increase in net imports.
It appears that the error is in the 2009 data point. Due to rounding differences, they show 2.6 for 2010, but the 2009 net import number, at 2.7, is clearly wrong.
Just stumbled upon this but don’t really get the point. Is the paper supposed to show that domestic US oil production has peaked? If so, I thought that was already shown when WT Oil Producers Assoc. gave word to all members that they could produce at full capacity which I believe was in early 1970’s.
If there is something I missed in the article I apologize in advance for my ignorance.
Good post… as far as it goes.
The issues here are several as have already been pointed out by some, but the main issue is one of substitution which has hardly be touched upon.
I writing of substitutions in the sense of producing oil rather than so-called alternative energy. In all cases, the primary deterrent is the government and its over-zealous regulatory agencies; only secondarily is cost… which would become less important as the “artesian” oil dries up.
An interesting summary of potential substitution can be found here:
http://alfin2100.blogspot.com/search/label/peak%20oil
It is obvious that non-U.S. demand is keeping oil prices high; it is also obvious that high oil prices will stimulate substitutions in one form or another. Only government interference will both skew the market and prevent substitutions from advancing. Picking “winners” among alternatives is the primary reason government interference screws the pooch.
Bruce/Jeffrey,
Shale gas is increasing exponentially; as of January 1, 2009 we had gas reserves of 750 TCF http://www.eia.gov/analysis/studies/usshalegas/ (and, as I said that is growing exponentially). Of course we still import gas from Canada, we still have pipelines and long-term contracts; but all those LNG tankers that were built to supply the US are looking for places to dump their LNG. The Alaskan gas pipeline is being abandoned because of the huge supplies in the lower 48. Moreover Jefferies “safe assumption” that 90% of the shale gas wells will be abandoned by 2020 is not supported by the EIA. Obviously, you guys have an agenda, because all you have to do is take the EIAs reserve and price data and plug it into your questions and hypotheticals, and you will see that the United States can be energy independent as soon as the Republicans get out of the way.
Professor,
Great paper! I have not read the whole thing but it is absolutely packed with good information.
That said now comes the “but.”
This paragraph seems to have alot of speculation and assumptions.
Obviously price incentives and technological innovations matter a great deal. More oil will be brought to the surface at a price of $100 a barrel than at $10 a barrel, and more oil can be produced with the new technology than with the old.(1) But it seems a mistake to overstate the operative elasticities. By 1960, the real price of oil had fallen to a level that was 1/3 its value in 1900. Over the same period, U.S. production of crude oil grew to become 55 times what it had been in 1900. On the other hand, the real price of oil rose 8-fold from 1970 to 2010, while U.S. production of oil fell by 44% over those same 40 years. The increase in production from 1900 to 1960 thus could in no way be attributed to the response to price incentives.(2) Likewise, neither huge price incentives nor impressive technological improvements were sufficient to prevent the decline in production from 1970 to 2010. Further exploitation of offshore or deep shale resources may help put U.S. production back on an upward trend for the near term, but it seems unlikely ever again to reach the levels seen in 1970.(3)
Let me give a few examples.
(1) This is totally dependent on inflation/deflation and production capabilities. $10/bbl in 1970 would have been almost 1/3 (28.6%) of an ounce of gold. $100/bbl in 2011 is less than 1/10 (6.3%) an ounce of gold. Where is the price incentive? Inflation has significantly veiled the price versus the cost of a bbl of oil.
(2) Energy efficiency in every aspect of life must be part of the equation. If the energy demands were the same today that they were in 1900 would we have the same production? In fact energy demands have exploded, and yet the need for equal amounts on increased oil simply have not materialized. Production is satisfying demand.
(3) It appears that you have only consider technological improvements as it relates to oil production. What about technological improvements relating to energy use? You consider supply and that is the strength of this paper, but the weakness is the lack of analysis of the demand component.
I have not yet read your paper – but I will – so I may be leveling unfair criticism. If so I apologize, but I do beleive that my criticisms are valid and if you have considered them in your paper you have done well.
Slug wrote:
So my takeaway is that instead of supply elasticities government policies should focus on substitution elasticities.
Slug,
When your only tool is a hammer everything looks like a nail. Your takeaway is the same old failed mercantilist policies of the past. Your takeaway should be government policies should neither focus on supply nor substitution. Government policies should focus on getting out of the way.
bmz,
It’s certainly true that one can show rapidly increasing production, even from rapidly declining wells, if the rate of increase in drilling is fast enough, but that can only go on for so long, and it’s instructive to examine some specific case histories, for example the DFW Airport Lease, in the Barnett Shale Play.
The lease bonus was $180 million, but it appears that cumulative production, from about 100 wells, will be about 10% of the initial estimate estimate, and monthly production in late 2011 looks like it is going to be about 10% of what the operator predicted it would be, with an accelerating rate of decline in production. But as noted above, if you string together enough of these rapidly declining leases, you can–for a while–show increasing production.
Art Berman has examined a number of actual case histories, and he is seeing a similar pattern in many different areas. For example, he estimates that the average Barnett Shale well will have a commercial life of about 8 years.
Regarding the EIA, they have also been predicting robust oil production increases for years, but their own data show flat to declining global crude oil production since 2005. And if memory serves, they have recently massively downgraded their estimates for the Marcellus Shale Play.
Interesting to compare the above charts on historical oil production picks with business booms
and depression since 1775 (Fraser, Fed Saint Louis).
The dollar was providing the same quantity of heat and light from 1815 till 1920 oil peaks or not.
Then more subtle interpretations are needed such as exchange rate trends,population growth,energy consumption,energy substitution,taxes,government expenditures.
I greatly appreciate the information brought by Jeffrey Brown. I’m glad he does so repeatedly, because the evidence he presents is a necessary antidote to the wishful thinking continuously offered by others who refuse to accept, or who out of self-interest will not acknowledge, the degradation of the hydrocarbon endowment.
But Jeffrey. What’s with the choice of the word ‘available’, as in ‘available net exports’?
Are you saying that the exporting countries refuse to sell to anyone outside of Chindia?
Sorry, it’s just a tad too cute. To state that Chindia is outbidding others for a growing share of oil production is one thing. But to suggest that that oil was not available to others is not accurate and diminishes your credibility.
Even in the case of long-term supply contracts, it is not accurate to suggest that the oil was not initially available to other bidders. Unless you can point to a (irrational) decision by producers to ‘sole-supply’. Good luck with that.
There is a declining supply of oil available in the marketplace. Even with record high average annual prices. That’s the message, I suggest you stay with.
Jim –
I’ve had a chance to read the paper, which I think is excellent overall. I think the first part makes a strong case that regions do peak for oil production, and that such peaking appears independent of price or technology over the longer run. Stylistically, I like this part best. Some of the other sections (eg, pp. 21) seems something of a laundry list (although I’m usually the chief complainer about the lack of meaningful academic involvement on the issue). A summary and narrative of academic literature which aligns stylistically with earlier sections would be easier for the lay reader (eg, oil industry, politicians and journalists).
I have to admit reservations about the “innoculation effect” of earlier oil price peaks on economic activity (Section 2.2). The recessions of 1981, 1991, and the real struggles of the economy this year tend to refute this notion. I think share of oil in personal consumption or GDP makes more intuitive sense to me.
Liebig’s Law of the Minimum and the “S” curve may deserve more attention than given in the paper. There are types of normal goods which do not really increase much with income. For example, at home, we would not use more dishwasher soap if its price fell by half. But if it’s price rose to be an appreciable share of income, then we’d use less. So it is with oil, and this relates to both Liebig Law’s and the S-curve. Cheaper oil may not speed you up, but expensive oil will slow you down.
Killian’s 1%:2.2% consumption drop over 12 months (p. 25) seems very important to me. What is the composition of the other 1.2% (ie, if 1% is oil, what’s the rest? Recession? Savings?) The lag effect is directly related to recessions, I suspect. This topic might deserve separate attention.
Coping with actual peak oil will be worse than 2005-2009, because a declining oil supply would take down China and India with it. The stress in the system today is largely driven by China and India’s growth, ie, it is linked to positive global growth overall. If the supply peaks, this will no longer be true. Thus, today we are living in Peak Oil Phase I. Should the oil supply actually peak, we will be in Peak Oil Phase II, which will be worse, I think.
Finally, the conclusion makes the general case that we’re in for a rough ride. While this is important, I certainly would have welcomed some quantitative estimates both of your own and using some of the models noted in the paper. You can feel in Washington and in the media an emerging awareness that this slowdown is not just Greece, but is another oil shock. Your general thesis is thus increasingly accepted–which is a relatively new development of the last 60 days or so. But as a result, it feels like we’re now turning to the implications of and policy options for a constrained energy supply. I anticipate that people will be looking for specific guidance.
Excellent paper overall, though. I expect it will move the public dialogue forward, as has your other recent work.
JDH,
Maybe I’m dense, but I’m having a hard time reconciling this latest paper on the history of oil prices & supplies with your earlier criticism of the Bernanke paper, which you also cited in this latest piece. If I’m interpreting you right, on page 24 you are agreeing that the primary effect of oil shocks is on the aggregate demand side of things, primarily through a temporary reduction in consumer buying power leading to deferral of big ticket items like gas guzzling SUVs. I think that makes a lot of sense. But if that’s the case, why wouldn’t we expect an accommodating Fed policy to prop up consumer demand? Shouldn’t lowering the Fed’s interest rate stimulate demand for consumer durables like cars that are typically financed via consumer loans? If Bernanke’s thesis is wrong, but your thesis about oil shocks mainly affecting the demand side is right, then the only way I can reconcile those two findings is by concluding that the transmission mechanism between Fed policy, consumer interest rates and consumer response is very flat. Like pushing on a string…or at least pushing on a string when consumers are surrounded by lots of other bad news.
BTW, one problem I had with the Bernanke, et.al. paper was that it didn’t really account for any automatic fiscal stimulus that would kick in during an oil shock recession. The analysis assumed all of the heavy lifting was done by the Fed. In actual practice there would be some automatic fiscal stimulus during the recession and then some significant Fed sterilization once the recovery began. I’m not sure Bernanke’s paper properly modeled this which makes me suspicious of the VAR results because the history would in some sense be contaminated. OTOH, maybe that’s one of the virtues of using shorter lags…it’s less likely to sweep up contradictory policies between the fiscal and monetary regimes.
2slugbaits: Great question (as always). My view is that it is not aggregate demand but rather sectoral specific demand. In the model in my 1988 paper cited, there is literally nothing the Fed could do to change the outcome
“…the real price of oil rose 8-fold from 1970 to 2010…”
The bottom line is that factories now have to produce 8 times as many useful widgets per barrel of oil, to entice producers to send oil to them. Marginally efficient machines can no longer produce enough to get oil sent to them, which means they no longer produce GDP. Printing makes domestic production less efficient, so competing for oil on the international market becomes more problematical.
Prof. Hamilton, thanks as well for the history lesson. I currently work at a refinery that was built in 1891 to refine the “Lima Crude” from Ohio. It was the first successful refining of sour crude.
Over the years, they’ve obviously had to move from one crude to another (I know Wyoming crude was big here, and today the North Dakota crude is keeping us in business as we retool to be able to refine the Canadian Tar Sands, as well as any other “ultraheavy” crude out there).
So in addition to your idea that production could only be kept up by finding new fields, additionally it required being able to refine those new crudes (sour in 1891, now ultraheavies), as well as new technology to increase the amount of gasoline recovered per barrel (cracking was invented at my refinery, for example).
Dr Hamilton, I really appreciate that you research in this area and provide peer reviewed analysis to this debate.
Jeffrey
As much as I would wish to collect and save your
photobucket albums
They still are in negative form when searching for them.
Doug Gabelmann,
One of the charts that we will show at the ASPO conference in early November is normalized annual oil consumption for 2002 to 2010 for the US, for the Top 33 oil exporting countries (combined), for China and for India. Note that from 2002 to 2010, annual oil prices have shown year over year increases for seven of the past eight years, with all post-2005 annual prices so far exceeding the $57 level that we saw in 2005. My point is that consumers showing increasing consumption during this period are likely to show the same pattern going forward. For example, US oil consumption in 2010 was below our 2002 rate while the other three referenced groups all showed substantial increases in consumption.
So based on current data, I think that the ANE (Available Net Exports) metric is key to explaining what is going on in global oil markets.
ASPO conference link: aspousa.org
Here is a short summary of our predicament:
Interestingly enough, the volume of the gap between where we would be in 2010 at the 2002 to 2005 rates of increase and where we actually ended up in 2010 were the same for three measurements of global oil supply, C+C, Total Petroleum Liquids and Total Liquids (total liquids includes low net energy biofuels), i.e., about 12 mbpd in 2010.
Contrary to the predictions by many agencies, organizations and individuals in the 2005 time frame, three different measurements of annual global oil supply have either been virtually flat since 2005, or showed a minimal rate of increase. In all three cases, we are seeing a 12 million barrel per day gap between where global production would have been in 2010 at the 2002 to 2005 rates of increase and what the data actually show for global production in 2010.
Because of flat total petroleum liquids production by the oil exporting countries and because of rising oil consumption in oil exporting countries, we have seen a measurable multimillion barrel per day decline in Global Net Exports, with many developing countries, such as the “Chindia” region, consuming an increasing share of a declining supply of Global Net Exports.
Here is my key point:
The 2005 to 2010 rate of increase in consumption by the Top 33 net oil exporters and the rate of increase in Chindia’s net imports was 2.7%/year and 7.5%/year respectively. Top 33 production (total petroleum liquids) was basically flat from 2005 to 2010, falling at 0.1%/year.
ANE, Available Net Exports, i.e., the volume of globally net exported petroleum liquids that is available to importers other than China & India, was 40 mbpd in 2005 and it was 35 mbpd in 2010.
If we extrapolate the 2005 to 2010 rates of change in Top 33 consumption and in Chindia’s net imports, and if we assume a 0.1%/year Top 33 production decline, then ANE would be at 21 mbpd in 2020–versus 40 mbpd in 2005.
If we extrapolate the 2005 to 2010 rates of change in Top 33 consumption and in Chindia’s net imports, and if we assume a 1.0%/year Top 33 production decline, then ANE would be at 15 mbpd in 2020–versus 40 mbpd in 2005.
According to the October STEO, tab 5a, line 15:
For the three months ending September, net natural gas net imports to the US were 11.0 bcf/day in 2007 and 5.4 bcf/day in 2011. Imports dropped literally by half in four years. (And consumption was actually up during the period.) That’s quite remarkable.
Were that to hold for oil, US crude oil imports would drop from 9.0 mpbd for the last three months to 4.5 mbpd in 2015. I think that would be very optimistic, but if you’re looking to historical precedent based on the natural gas experience, shale oils could have a material impact.
In the long run we need only be concerned with the flow of BTUs in this country. If the BTU flow is coming into this country that means that dollars are going out.
We have far greater reservoirs of BTUs in this country than any other country. In time we wille exploit those and even begin to export some of them.
Right now the technology is not in place to do so but it will be. The amount of money to be made is too great to pass up. The politicians and their regulators who are adamantly opposed to this will be replaced.
When I speak of BTUs I am speaking of coal, lignite, natural gas and oil. Technology exists for turning every one of these resources into transportation fuel.
This is not to overlook the effect of high prices on productivity. But in terms of competitive advantage, as energy prices rise, a country that exports energy has a greater advantage than a country with cheap labor. Canada is doing just fine. Its people are doing just fine.
Link to a Forbes item, a “Peak Oil is Nonsense du jour article,” follows. The author suggests that deepwater and shale sources will keep production on an upward slope.
http://www.forbes.com/sites/timworstall/2011/10/19/peak-oil-entirely-nonsense-as-is-peak-gas/
Peak Oil, Entirely Nonsense: As is Peak Gas
My take on the shale issue:
I guess one way to look at it is US versus global rig counts. Here is a link to current data:
http://www.wtrg.com/rotaryrigs.html
The most recent data show a total US rig count of 2,023 rigs, with 1,080 devoted to drilling for oil. The global number, oil & gas, is 3,662.
It appears that the net increase in US annual crude + condensate production is going to be about 300,000 bpd, from 2009 to 2011 (from 5.4 mbpd to about 5.7 mbpd), or about 150,000 bpd per year. The post-hurricane low was 5.0 mpbd in 2008, but I would argue that the past two years, including 2011, give us a better idea of the net increase, as a result of shale sources.
So, if we divide 150,000 bpd per year by about 900 rigs drilling for oil (in 2010 & 2011), we get a net increase–after depletion–of 170 BOPD per rig per year.
The mathematical model, and recent C+C data, suggest that the world is at about the same stage of conventional depletion at which the US peaked in the early Seventies.
So, if the US serves as a model for the kind of net increase that we can show, from shale sources, in excess of conventional depletion, then if we wanted to offset the current ongoing decline in Available Net Exports worldwide (about one mbpd per year), globally we would need about 6,000 rigs. If, as I expect, the ANE volumetric decline rate increases to about two mbpd, we would need about 12,000 rigs drilling for oil.
Also, my working assumption, and Art Berman concurs, that at least 90% of all currently producing oil wells in shale formations will be plugged and abandoned, or down to 10 BOPD or less, by 2020. While it’s certainly possible, if you drill fast enough, to initally show rapid increases in production from a group of rapidly declining oil wells, with time this gets increasingly difficult as the inventory of declining wells increases and as one encounters personnel and infrastructure constraints.
And a big question is how many shale formations worldwide will produce commercial quantities of oil, especially given much higher drilling and completion costs in many other areas, versus the US.
(Steve, at the estimated current* net increase in US C+C production per year, we would be at about 6.3 mbpd in 2015, reducing net imports by 0.6 mbpd from 2011 to 2015, assuming no change in consumption.)
*Of course this could go up, or it could go down too as we see a bigger supply of declining oil wells and as we face personnel and infrastructure constraints.
ppcm,
I am going to do a global net export update article, after the ASPO-USA conference, which will have key graphs.
Ricardo:
As regards demand, there are three or four long-run scenarios worth contemplating:
Annual oil supply growth of 2.8 mbpd
This level of growth is consistent with i) demand growth from 1960-1972, the period of motorization in the west; ii) demand growth in similar commodities (coal, natural gas); iii) demand growth based on recoveries from other recessions; iv) demand growth in 2010; and v) demand growth based on fundamental forward-looking analysis.
At this level, there would be plenty of oil for everyone, and prices might be in $50-60 range.
Annual oil supply growth of 2.4 mbpd
This level should be adequate to fuel the global economy without great dislocation. There would be modest pressures for substitution, but nothing earth-shattering. During the middle of 2010, the oil supply grew by 2.3-2.8 mbpd. Oil price: $65-75.
Annual oil supply growth of 2.1 mbpd
This is probably the lower limit of the comfort zone for oil supply growth. Expect significant efficiency pressures, but relatively long-cycle oil shocks (say, every 5-6 years). Oil price: $75-85
Annual oil supply growth of 1.7 mbpd
OPEC, IEA, EIA typically forecast demand growth in this range (1.4-1.7 mbpd / year). At this level, I would expect significant pressure on the oil supply, signficant pressures for efficiency and substitution. Most recent supply growth is in this range, lower during the first half of the year. Oil price: $95-110. Short oil cycles, with oil shocks every 3-4 years. About what we have seen recently.
Projected Oil Supply Growth for 2012: 0.8 mpbd
@Steven Kopits
What is the average energy content of a barrel of oil today vs a decade ago?
@Jeffrey Brown
I remain unconvinced of the wisdom of your (mis)use of the word ‘available’. I understand the trends you are identifying. But you cannot say that the oil going to Chindia has not been, or is not, available to others prepared to pay more.
For what seems to be dramatic effect, you are simply confusing the real issues. These are, to my mind, that higher prices and advances in technology are failing to increase supply; that higher prices translate into greater incomes in producing countries permitting increased domestic consumption leading to declining exports; and that production is itself consuming more oil because of the degradation of the resource.
As I say, I appreciate your effort, and comment only because I believe you are undermining the best of your insight.
Steve,
Perhaps we should look at recent annual data.
Following are four “Yergin Gap” charts for global C+C, for global Total Petroleum Liquids , for Global Net Exports* (GNE) and for Available Net Exports (ANE). We showed the actual 2002 to 2010 annual data and where we would have been at the 2002 to 2005 rates of increase. The “Yergin Gaps” are shaded red:
EIA Crude + Condensate
http://i1095.photobucket.com/albums/i475/westexas/Slide05.jpg
BP Total Petroleum Liquids
http://i1095.photobucket.com/albums/i475/westexas/Slide06.jpg
Global Net Exports
http://i1095.photobucket.com/albums/i475/westexas/Slide07.jpg
Available Net Exports
http://i1095.photobucket.com/albums/i475/westexas/Slide08.jpg
*Top 33 net oil exporters in 2005, BP + Minor EIA data
We have seen a material, but quite small, increase in total liquids production, which includes low net energy biofuels, since 2005. The EIA shows an average volumetric increase in annual total liquids of about 0.44 mbpd from 2005 to 2010 (one-half of one percent per year), but the “Yergin Gap” between where we would be at the 2002 to 2005 rate of increase and actual production in 2010 is the same as C+C and as total petroleum liquids, i.e., 12 mbpd.
Doug,
Here is a chart showing normalized oil consumption for the US and four developing countries (1998 to 2009:
http://i1095.photobucket.com/albums/i475/westexas/Slide3.jpg
Does it add anything to the petroleum discussion to consider the change or trend in the USA of the production of GDP per capita per barrel of oil? Is there enough of an increase to allay some of the fears of peak oil or peak energy or is this GDP per capita/ barrel of oil neither helpful nor relevant?
For conversion factors, a good place to start is the BP Statistical Review, one of the seven wonders of the world (with the STEO being another). If you download the spreadsheet, there is a tab called “Approximate Conversion Factors, which has some of the data.
Another source is the EIA, which has its own conversion table, here: http://www.eia.gov/energyexplained/index.cfm?page=about_energy_conversion_calculator
Using these sources, we find that:
1 barrel of ethanol = 0.57 barrel of oil
1 barrel of biodisel = 0.88 barrel of oil
1 barrel of NGL’s (propane) = 0.66 barrel of oil*
* my estimate from various sources.
Biodiesel production is pretty minimal, so we can exclude that from calculations.
Ethanol is produced primarily in the US and Brazil, and total production will probably equal around 1.5 mbpd in 2011. The oil eqiuvalent value of this is probably on the order of 0.8 million barrels per day, suggesting a reduction of 0.7 mbpd from the oil supply to account for ethanol’s lower heat value. For my purposes, I’m interested in the increment, because that will determine relative price movements. Figure ethanol production could grow 10% this year (I don’t know what the real number is), that would be 0.08 mbpd reduction in the reported growth of the petroleum liquids supply compared to nominally reported barrels. This is largely immaterial in our thinking about the liquids growth needed to support the global economy. Whether the oil supply grew at 1.0 mpbd nominally or only 0.92 mbpd adjusted for ethanol’s lower heat value would not change my interpretation of oil supply and demand balances.
According to the EIA STEO, US NGL’s production is not much changed over the last year. OPEC production is up 0.6 mbpd. If we allow that this should only have a value of 0.4 mbpd, then 0.2 (globally, probably 0.25 for the world as a whole) should be deducted from the oil supply to reach a crude oil equivalency. This is not entirely immaterial to our analysis. For the next year, our IOC friends see the oil supply up 0.8 mbpd, of which half if half is NGLs. Thus the net gain would be only 0.6 mbpd, which makes a miserable performance even more miserable.
Conclusion: Non-crude liquids reduce supply growth, depending on the year, by as much as a quarter (our anticipation for 2012). However, they do not change our overall interpretation of events. Whether the oil supply grows at 0.8 mbpd or 0.6 mbpd crude oil equivalent, both are just miserable growth rates.
So, in the coming year, expect to either begin with a recession or experience an oil shock in the first half of the year.
And if you think about that, you can handicap the odds of the Keystone XL pipeline and the likelihood of Shell drilling the Beaufort in 2012. And you can handicap the Democrat’s odds in November 2012 and think about how you might advise the President as to his re-election strategy.
Steven Kipits
What are the conversion factors for solar or wind?
What am I, the answer man?
Nat gas power (ERCOT, peak, spot): 3.7 cents per kWh.
Onshore wind: 6-12 cents, reckoned good at $8 / mmbtu natural gas equivalent. (More if you don’t want to kill bats at night.)
Offshore wind: 20-25 cents, 4x levelized (all in) cost of a CC nat gas power plant.
Solar’s in that range, 20-27 cents, I’ve seen numbers at 17 cents. Seems to be lots of movement in solar prices just now.
But of course, none of these are transportation fuels. On the other hand, if you had an $87,000 Finnish-assembled Fisker Karma sports car ($96,000 with plug), you could charge it with solar panels. That’s environmentally friendly. And let’s face it: the car is gorgeous. But even burning real fuel, it only makes 60 in 5.9 seconds. And only some 55 mpg.
So you might want a $100k Tesla. I’ve driven one of those. Gut-wrenching acceleration: 3.9 sec to 60. (Like bulimia without the guilt–and you’ll need it, because it’s so snug, you’ll have to lose a few pounds to get out of the car.) But there’s absolutely nothing better for picking up girls in Boulder, Colorado. Except maybe a Fisker.
Sorry,
Bad typing & bad eyes, I meant to type: Kopits
Jeffrey,
Here are the facts from EIA on gas imports: 2007-2010 (TCF): 4.61, 3.98, 3.75, 3.74. 2010 was the lowest year for imports since 2000. And if you still want to claim that the EIA are wrong, I suggest you go talk to the folks the run the Transcanada Mainline. Their volumes are down almost 50% in the last 5 years (here’s a hint, take a look at what’s about to happen to the direction of the gas flows at Niagara). If the outlook for US imports is as robust as you seem to think, why are the Canadians going to wager $5B to export LNG from Kitimat? Also, have you noticed we now have 4 applications to export LNG from the US? How many market signals do you want to ignore?
On the oil side, all your fear mongering neglects to look at demand for motor fuels in the US. Miles driven are down over the last few years, fuel efficiency of cars are up and guess what, refineries are closing due to falling demand. US crude oil imports 2005-2010 MMbpd: 10.1, 10.1, 10.0, 9.8, 9.0, 9.2 – seems like we are doing our part to accomodate growth by Chindia.
Kopits: Onshore wind … More if you don’t want to kill bats at night.
As an apologist for everything petrochemical, who has never known a negative externality that couldn’t be ignored, suddenly you are concerned about bats?
Equityval ,
After talking to the EIA folks, it appears that their net import calculations go beyond production/consumption, and they take into account inventory changes. However, I would argue that focusing on production and consumption provide better indication of net import trends.
In any case, the difference between the two measurements aren’t that big, and even if you go with the EIA’s adjusted net import number, net imports were basically flat from 2009 to 2010.
Regarding falling US oil consumption, no argument. We are being outbid for a declining supply of Global Net Exports.
Incidentally, here is a longer term look at the ratios of US consumption to production ratios (C/P) for oil, natural gas and coal (through 2009, EIA):
http://i1095.photobucket.com/albums/i475/westexas/Slide1-5.jpg
The 100% line marks the dividing line between net importer and net exporter status, excluding inventory changes.
Even with declining demand relative 2005, the US remains the world’s largest net oil importer, with 61% of the crude oil that we process in US refineries currently coming from imported oil.
As noted up the thread, the C/P ratio for natural gas went up last year, and we remain one of the world’s largest net natural gas importers.
We are just barely self-sufficient regarding coal consumption, and on a tonnage basis a few years ago we were briefly a net importer of coal.
BTW, the BP data base for natural gas shows that US consumption exceeded production by 2.26 TCF in 2009 and by 2.56 TCF in 2010, as the C/P ratio went from 111% in 2009 to 112% in 2010.
First, after last night’s thrilling loss to Michigan State, I hope JDH checks in on Menzie from time to time just to make sure he’s okay. And yes, the the ball did cross the plane of the goal line.
Shockingly, the thread seems to have trailed off from what I understood was JDH‘s central point. The larger issue isn’t current or near term oil supplies, it’s that up until now oil prices have behaved as though oil was an inexhaustible resource when economic theory predicts a Hotelling price model for an exhaustible resource. To me this suggests that everything we think we know about price elasticities of supply will collapse once the reality of peak oil kicks in. The market may not be giving us reliable price signals for the future. Historically, new geologic finds and technology have contributed to the illusion that oil is inexhaustible. At some point the model ceases to be one in which oil price hikes spur new production and instead the model morphs into one in which price temporally allocates the consumption of an exhausitble resource. And all of this ignores that pesky little problem of cooking the planet.
As a public policy issue we’re caught in a trap. Anything we do to expand oil production fixes the current problem but makes the longer term problem more difficult to solve.
@ Equityval,
If Canadians had any idea how quickly the natural gas endowment was depleting, I doubt many would support the Kitimat project. A very small part of the population does support it, and of these the usual suspects pursuing the usual short term profit-now, pay-later strategy are looking for a route to the likely highest bidder.
In any case, you appear to be missing Jeffrey’s point, which is that the US remains hugely dependent on imports despite all the shale gas hoopla, and, as I understand it, that that hoopla is based on an unsustainable requirement for an ever greater drilling rate.
As for US oil consumption: a) price predictably affects demand; b) because of low prices historically, there has been and remains a very inefficient rate of converting that demand to productive work; c) higher prices are slowly forcing a more efficient use of the resource.
Sadly, largely because people invested in short-termism disseminate mis-information or dis-information about mid and long term supply, the response to the price signal is all too slow.
Joseph –
Re: bats. I was alluding to a story about wind turbines killing endangered bats. There have been others with birds as well. I suppose I was making the point that so-called “environmentally friendly” technologies also have negative externalities, and that these are frequently glossed over prior to implementation.
I am, of course, well aware of the externalities of extractive industries. For example, we’ve recently completed two projects on produced water issues (water co-produced with oil), most recently supporting an IPO of a tertiary water treatment technology company this past July.
Kopits: Your cost comparison of produced power leads with a spot price for ERCOT for gas-fired power (higher than marginal price of production at a given moment, but not an all-in price), then compares conservatively estimated all-in prices for other technologies which ignore current market conditions in favor of a hypothetical scenario without subsidies. You do, as an aside, note that the all-in price of a base-loaded combined-cycle plant (the most favorable comparison for gas), is 35-70 percent higher than your cited spot price. The onshore wind prices you cite are dependent on A)the price of turbines, which varies dramatically with demand irrespective of cost of production (like the price of drill rigs) and has been inordinately high the past couple years, B)the price of money and finance structure, C)the site specifics including capacity factor and cost of transmission access.
A and B are amenable to intervention which would obviate the need for current incentives for wind to compete with gas plants for energy-only contracts.
Thanks, professor, for the interesting paper. I’m interested to see that you look to the next decades not without a certain trepidation; this summer I asked Jeff Frieden about what declining oil production might mean for growth; he pretty much dismissed my question, giving the standard response: that substitution would make everything work out fine. On the other hand, he seemed worried about the next few decades for his own reasons, those he explores in new book with Professor Chinn. I’m interested in how these different concerns relate to one another… Anyway, thank you.
So, fifty years after King Hubert’s SWAG prediction of US peak oil in 1970, you have studied the record of attempted defying the peak oil and Hubert’s Peak, and verified that burning limited resources is unsustainable.
Yet like AGW, conservatives will continue to deny Hubert’s Peak and keep claiming “what the world needs now is…” more devotion to pillage and plunder.
At least the economies based on pillage and plunder (from Greeks to Vikings onward) were pillage and plundering villages and city states which built their resources through agriculture and industry and trade, spacing out the raids to allow the warehouses to be replenished. Replenishing oil needs well in excess of 100 million years – what is the rate of return required for that?
The global supply of sustainable energy, the US supply of sustainable energy, far exceeds the demand for energy overwhelmingly provided by pillage and plunder. The problem with sustainable energy is the requirement for fully committing to capitalism. Conservatives reject capitalism because pillage and plunder offer immediate profit to the pillagers, with the real costs placed on future generations.
After 50 years, the conservatives are still singing the same song: drill baby drill for tomorrow we die and the future is not my problem.