And what we can do about it
From Macroeconomic Advisers and e-forecasting, some recent reads on the macroeconomy:
Figure 1: GDP (blue bars), monthly GDP from e-forecasting (red line), and from Macroeconomic Advisers (green line), all SAAR, in billions of Ch.2005$. NBER defined recession dates shaded gray. Source: BEA, 2011Q3 advance release, e-forecasting, Macroeconomic Advisers, and NBER.
Macroeconomic Advisers monthly release for September has GDP flat, while e-forecasting (as of a week ago) has GDP essentially flat for October. As of this morning, MA’s tracking forecast has Q4 growth at 3.2%. Short term, it may be growth will continue. But see also Berge, Elias, and Jordà (2011).
Given my bias as an open economy macroeconomist, I look to the rest of the world to think about what is going to happen, given the trajectory of external sources of demand. Here, the indicators are not altogether promising.
Figure 2: from OECD (14 November 2011). Notes: The above graphs show country specific composite leading indicators (CLIs). Turning points of CLIs tend to precede turning points in economic activity relative to long-term trend by approximately six months. The horizontal line at 100 represents the long-term trend of economic activity. Shaded triangles mark confirmed turning-points of the CLI. Blank triangles mark provisional turning-points that may be reversed.
Compared to last month’s assessment, the CLIs point more strongly to slowdowns in all major economies. In Japan, Russia and the United States the CLIs point to slowdowns in growth towards long term trends. In Canada, France, Germany, Italy, the United Kingdom, Brazil, China, India and the Euro area, the CLIs point to economic activity falling below long term trend.
What can be done? I know there is a tendency, given the policy paralysis we are seeing in Washington, DC (and elsewhere), to just throw up one’s hands. But those in policymaking positions can’t do that. And in fact I think there are many things that can and should be done. CBO Director Elmendorf outlined many options in testimony before Congress, “Policies for Increasing Economic Growth and Employment in 2012 and 2013”. He succinctly stated what was needed thusly:
If policymakers wanted to boost the economy in the near term while seeking to achieve long-term fiscal sustainability, a combination of policies would be required: changes in taxes and spending that would widen the deficit now but reduce it later in the decade.
This graph conveys concisely the impact of several options for boosting employment.
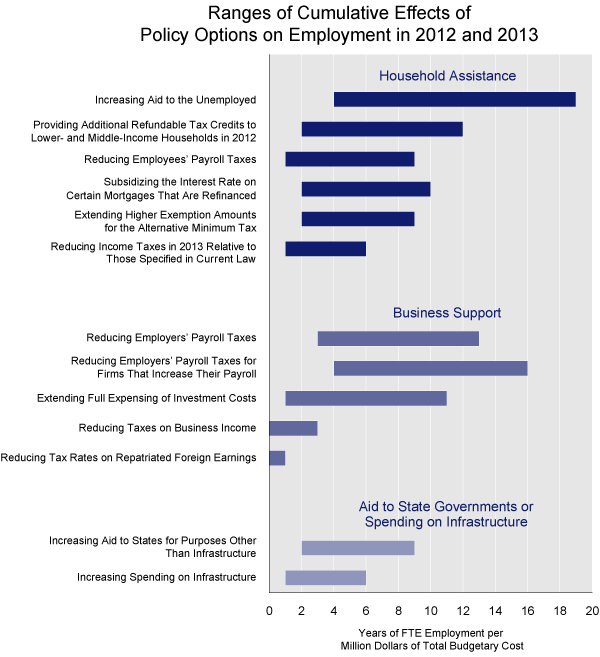
Figure from CBO.
In particular, I think this is noteworthy (from pages 2-4):
- Policies that would have the largest effects on output and employment per dollar of
budgetary cost in 2012 and 2013 are ones that would reduce the marginal cost to
businesses of adding employees or that would be targeted toward people who
would be most likely to spend the additional income. Such policies include reducing
employers’ payroll taxes (especially if limited to firms that increase their payroll),
increasing aid to the unemployed, and providing additional refundable tax
credits in 2012 for lower- and middle-income households.
- Policies that would primarily affect businesses’ cash flow but would have little
impact on their marginal incentives to hire or invest would have only small effects.
Such policies include reducing business income taxes and reducing tax rates on
repatriated foreign earnings.
Despite the near-term economic benefits that would arise from reductions in taxes
and increases in government spending, such actions would add to the already large
projected budget deficits, either immediately or over time. Unless offsetting actions
were taken to reverse the accumulation of additional government debt, the nation’s
capital stock, its future output, and people’s future incomes would tend to be lower
than they otherwise would have been. If policymakers wanted to boost the economy
in the near term while seeking to achieve long-term fiscal sustainability, a combination
of policies would be required: changes in taxes and spending that would widen
the deficit now but reduce it later in the decade. Such an approach would work best if
the future policy changes were sufficiently specific and widely supported so that
households, businesses, state and local governments, and participants in financial
markets believed that the future fiscal restraint would truly take effect.
The entire document is here.
That’s a nice post Menzie. The steep slopes on those downturns don’t instill much optimism that growth is going to provide an easy fix for our fiscal imbalances.
In view of Richard C. Koo’s analysis, that this is a “balance sheet” recession, I do not understand how these various incentives to business would make much difference. If current demand is insufficient to support current capacity then providing, say, tax breaks for adding capacity seems intuitively ineffective.
The problem is that your recipe is rather like someone who says they will eat that large pie with ice cream plus perhaps some cake, and then diet tomorrow. They almost always eat and then don’t bother to diet.
Since the 1920s-30s, the historical cyclical recession precedent implies a U rate of 13-14% to 18% (and U-6 of 25-30%) and fiscal deficits/receipts approaching 100% by ’13-’14, as well as a 35-50% (or more) decline in S&P 500 profits and for the index.
If there is any incremental increase in federal spending (???), the net increase will overwhelmingly come from an increase in unemployment, food stamps, SSI, and Social Security (SS) and Medicare payments (the fastest acceleration of increase of peak Boomers drawing down on these programs has already begun and will last into the early to mid-’20s).
There will be little or no fiscal maneuvering room for “stimulus”, only “income support” for the growing millions of Americans becoming increasingly dependent upon gov’t transfers for subsistence.
Any additional payroll tax cuts and credits will only exacerbate fiscal deficits and bring closer the day of reckoning for draconian cuts to SS, Medicare, and other transfer programs.
Raise taxes on the top 0.1-1% at this particular juncture in the debt-deflationary secular era and we shoot ourselves in the foot, as rentier income gains and the associated incremental discretionary spending by the upper-income rentiers will be reduced and gain us nothing in revenues to offset the fiscal deficits. (This is what happens when wealth and income concentrates to such an extreme that the economy becomes disproportionately dependent upon discretionary outlays of 1 million US households.)
We are quickly becoming a member of the PIIGS, but we have our snouts comfortably buried in the gov’t trough and don’t yet realize there is a big hole in the bottom of trough.
1.There has been no slowdown in China
2.Growth was not flat in October
It may slowdown in the 1st quarter, but not now. China hasn’t slowed yet either, maybe they will, but the index your using is irrevelant.
Bruce, you raise taxes on the invester class because they have oversavings and and labor doesn’t have enough. That is the point people seem to not understand. It is time to let labor inflation roar again. People whine about not enough labor inflation and to much asset inflation, well? The problem starts on how public policy reflects savings. The government spends less on labor than anything else. Most of its expenditures are on warfare,old age care and cylical tranfers. Then they set taxes to benefit the invester class, over the laboring class.
This leads toward a final destruction of a deflationary holocaust and labors rebel. They will start by overthrowing cities and state governments. The military will turn up its gun then and won’t back the reigning power. The government collapses. Then the changes happen anyway and in a way that may not be nice. To me, you have to understand the capital owners problem in the middle. They want to expand, but at the same time, they want to procure value. While the deflationary holocaust happens, they are procurring value and collapsing their corporations, securing that value. But the economic toll is so great. To me, the great depression was a test run of this. It took you to the edge of how long a country can resist destruction. How long can we:
1.Run a global trade system that benefits the invester class over labor
2.Run a tax system that benefits the invester class over labor
3.Run a financial system that benefits the invester class over labor.
At some point, we understand why investers are sitting on money, citizens and their governments struggle with debt. It is like clockwork. The same thing spinning around time and time again.
Rage, I sympathize with your position WRT to the differential returns to capital and labor. But we built an industrial economy on 4-5%/yr. growth of crude oil production from the 1900s to peak crude oil production 1970, and then we amassed $50 trillion of debt (“asset wealth” for the top 1-10%) atop ~$9 trillion in private GDP to replace industrial investment, labor, and production since then.
Since 9/11, the US gov’t has grown spending and the US debt held by the public by nearly three times the rate of private GDP, and the 10-yr. trend rate of real private GDP per capita is negative.
Now that US crude oil production per capita has fallen 60% since 1970, industrial production per capita adjusted for inflation is down 70-75% since 1970, and we have a compounding interest obligations on the total credit market debt owed of nearly 100% of annual GDP, what do we do for an encore?
A 50-year plus oil boom. A 30-year debt bubble. An 11-year gov’t borrowing and spending bubble. Now what?
Wage inflation? Not a chance with a planet full of workers eager to work for a nickel or dime on the dollar to US workers.
Inflate away the debt with deficits of 100%+ of GDP and the Fed printing trillions of dollars more? The US$ falls further, commodities prices rise still further, interest rates and the U rate will soar, real GDP plunges, and the US gov’t defaults.
Some eCONomists say that we face a “lost decade” as in Japan’s “lost two decades” now (and into the third). But they fail to recognize that the trend of real GDP since 2000 has been cut in half (just as was the case for Japan in the early 2000s), reducing US real GDP growth by 15-16% from what otherwise would have occurred had the avg. real growth continued since 2000. We’ve already had a lost decade and then some.
Real private GDP per capita, moreover, has been reduced 22-23% since 2000 from the long-term trend rate. Were we to continue to follow Japan’s post-bubble trajectory into our lost “second decade”, by 2020 we will see avg. trend real GDP decline from 1.6% today to 1% or slower, reducing growth that otherwise would have occurred by 35-40% and cutting real private GDP per capita by nearly half over the period.
And that halving of real private GDP implies a similar reduction required (as in Europe and eventually China-Asia) for total credit market debt owed***), private asset values (real estate and stocks), and gov’t spending (including jobs, pay, pensions, benefits, etc.).
The main point is that the price of oil at or above $100 (and 5% of GDP and 7% of private GDP), the Boomer demographic drag taking hold, and the level of total debt service obligations to the effectively infinite term of outstanding debt precludes any incremental growth hereafter.
And even with an eventual resolution of the secular debt-deflationary regime in the years ahead, the level of per capita material consumption and GDP given Peak Oil and population overshoot will be significantly lower than what we have come to perceive as normal and permanent.
Whether we realize it or want to accept the fact, the US economy has been in decline for 25-40 years, and we have been in a slow-motion depression and secular bear market for more than a decade. There are no supply-side, Keynesian, neo-liberal, monetarist, Austrian School, etc., textbook prescriptions for what ails us and the global economy. It is “different this time” in unprecedented ways.
Apart from ecological economics, there exists no school of thought that even recognizes the thermodynamic or energetic and resource limits to uneconomic growth and that the economy is, in fact, a sub-set of the ecological system rather than the converse, which is the CONventional beliefs of eCONomists of all stripes. Without an understanding of the very real thermodynamic/entropic limits to the kind of uneconomic system we have (externalizing costs of depletion and wastes, and reporting costs as “growth”), I have no confidence that effective policies will be forthcoming.
***The US added $22 trillion in total credit market debt since 2000 to just $5 trillion in GDP (and less for private GDP). A reduction of 50% of total credit market debt owed would take us only back to the levels of the mid-2000s.
http://www.zerohedge.com/news/payback-time-coming-decade-deleveraging
Bruce I have no idea what on earth you are talking about with thermodynamic/entropic limits, and to be honest can’t be bothered to google it……I probably agree with you, economics is defunct, demographics now are very different to those post war years when inflating debt away worked. Fact of the matter is demographics now dictate that there are more savers than buyers. low rates with QE induced inflation hurts the MAJORITY of the population. This will not garner growth and will push debt/GDP ratios to higher levels……Debt is unsustainable, and an unerring belief in Keynsian economics when the whole world was a different entity seems moronic…..However no low rate is detrimental to growth research is going to get done all leading economists are Keynsian not Austrian……and Keynsian is where the funding is AT.
@Bruce: As any crossword buff will inform you, CON means, amongst other things, “to study”.
Hey man, didn’t you tell us that Quantitative Easing is the solution ?
Ben, where is your printing press and the helicopter ?
This program is quiet generic and lack of useful specifities,isn t it possible to include:
A matrix of import substitute goods,their cost of production when attaching the incitivization (fiscal,financial)
A better recognition of the priority recruitment for equal qualification,age,time of unemployment..
A plan as regards the natural or less natural reduction of current account deficit.
A saving plan of the government expenses.
Bruce
Econbrowser posts and comments are often asking to make a great gap of dance steps,on Zerohedge thread it is to be found:
http://www.zerohedge.com/news/watch-nigel-farage-dance-euros-grave
After reading a plan as submitted to the US congress and hearing barbarism at the European parliament,it may be tempting to conclude that civilization has left the European continent.
To the contrary great progresses and tolerance have been achieved since the defenestration of Prague.
My sentiment, although not my analysis, is not too far from Bruce’s.
An oil shock-induced recession would typically raise unemployment by 4%, so figure to 12-13% for the headline number. (By the way, global oil consumption rose 2.7% per annum in the go-go years of 1960-1972.) My share price analysis puts a trough at 8,500-9,600 for the DOW.
Personally, I think we’ll see only modest budget deterioration, if only because there will be no money to fund it. So I am inclinded to believe that we’ll be taking the recession without shock absorbers. If you see the bloody-headed guy on Drudge today, well, there could be more to come, and much more severe than what we’re seeing today.
While I am not opposed to some counter-cyclical spending to ease the effects of recession, these have to remain within the context of general solvency. As our debt/GDP ratio crests over 100%, it’s hard to feel that we have much dry powder left.
Having said all that, the US statistics to date support Jim’s thesis of slowdown but no recession. Unemployment claims at 388k this week were the best we’ve seen in months. The economy would clearly like to recover. It comes down to events in Europe and the trajectory of oil prices, in my opinion.
Regarding resource constraints . . .
Five annual “Yergin Gap” charts follow, showing the gaps between where we would have been at the 2002 to 2005 rates of increase, versus the actual data in 2010 (common vertical scale).
Daniel Yergin, in 2005, predicted a 3%/year rate of increase in productive “capacity,” and the shaded areas on all of the following charts would have consistent with a 3%/year rate of increase in production.
(Note that there are some significant discrepancies between recent EIA data and other data sources, e.g., JODI & BP, especially regarding Saudi Arabia).
EIA Total Liquids (including biofuels):
http://i1095.photobucket.com/albums/i475/westexas/Slide1-18.jpg
BP Total Petroleum Liquids:
http://i1095.photobucket.com/albums/i475/westexas/Slide06.jpg
EIA Crude + Condensate:
http://i1095.photobucket.com/albums/i475/westexas/Slide05.jpg
Global Net Oil Exports (GNE, BP & Minor EIA data, Total Petroleum Liquids):
http://i1095.photobucket.com/albums/i475/westexas/Slide07.jpg
Available Net Exports (GNE less Chindia’s net imports):
http://i1095.photobucket.com/albums/i475/westexas/Slide08.jpg
I would particularly note the divergence between the first chart, total liquids, showing an average increase of about 0.4 mbpd per year from 2005 to 2010, and the last chart, Available Net Exports (ANE), showing an average volumetric decline of about one mbpd per year from 2005 to 2010.
CERA, et al tend to focus on the total liquids data while ignoring the GNE & ANE data. Since Yergin is now calling for less than a one percent per year rate of increase in total liquids productive “capacity,” which is similar to what we saw from 2005 to 2010 in the EIA total liquids data (+0.5%year), it seems to me that Yergin is, almost certainly without realizing it, in effect predicting a continued decline in GNE & ANE.
Daniel Yergin Massively Reduced His Energy Estimates:
http://www.energybulletin.net/stories/2011-10-24/daniel-yergin-massively-reduced-his-energy-estimates
All that’s happening
in the economy
is predictable, as
there are 7 stages that every
major economy goes through.
Those who know how it works
profit & massive wealth
is transferred to them.
Several months ago
I learned this information
from a millionaire
whose site I found
& am sharing it with
everyone I know.
His free video-
“How To Create Wealth in Today’s Economic Crisis”
is at:
http://theelevationgroup.net/presentation/register.php?a_aid=160667&a_bid=290b868b&chan=y
Hope this helps everyone
as much as it has me.
Dr. Nancy
Thanks a lot Dr. Nancy, worked very well, got my million in an instant.
Now I know, why there are so many millionaires in this country.
“I have no idea what on earth you are talking about with thermodynamic/entropic limits.”
Al Bartlett:
http://www.albartlett.org/
“The greatest shortcoming
of the human race is our
inability to understand
the exponential
function.” – Prof.
Al Bartlett
http://www.youtube.com/watch?v=F-QA2rkpBSY (1 of 8)
http://physics.ucsd.edu/do-the-math/2011/09/discovering-limits-to-growth/
http://cassandralegacy.blogspot.com/2011/09/cassandra-and-limits-to-growth.html
Chris, you’re not alone. For at least 40 years, what eCONomists describe as “eCONomic growth” is really a process of “uneCONomic activity”, including externalizing the actual costs of non-renewable resource depletion and waste disposal and monetizing (via massive debt expansion) the extraction and importation of foreign resources and future labor product via debt service to disposable income of the bottom 90% of households.
What we call “growth” in GDP terms is really “the price” today of consumption of future growth of uneconomic activity.
Humans experience reality in linear time. Population, consumption, and debt-money grow at an exponential rate. Nature functions at a logistic/entropic trajectory. We human beings are reproducing and consuming at an exponential rate while perceiving our existence and effects in linear time, whereas natural ecological constraints are appearing at the thermodynamic/logistics bound in a so-called “full world” now at population overshoot (exceeding sustainable human carrying capacity) and peak global oil production and falling oil exports.
By definition, debt-money grows exponentially until its level to output/income reaches a differential order of exponential magnitude, at which point debt-money must grow faster than exponential or collapse; however, the resulting faster-than-exponential growth of compounding interest costs precludes debt-money continuing to grow, and collapse of debt-money occurs back to the point at which the faster-than-exponential growth commences (and often overshoot occurs).
This is where we are today. Population and consumption continues on its long-term exponential trajectory (with population growing since 1950 at a doubling time of just 40 years), and we humans continue to expect that the conditions of the linear dimension within which we experience the world will continue indefinitely. However, easily accessible and affordable non-renewable resources per capita have reached the logistics limit bound.
That debt-money growth and associated uneconomic activity as we have come to expect to continue is based on “affordable” resource availability and the profitable necessary rate of resources services throughput in a given society/economy, without the necessary rate of growth of affordable resources per capita, and with the debt-money limit bound having been reached, growth of resource services throughput per capita, and thus real GDP per capita, is no longer possible.
With the limit bound conditions having been reached for population, consumption, debt-money and service, and extraction and processing of non-renewable resources, there is no incremental amount of further increase in debt-money reserves, lending, and gov’t borrowing and spending that will result in the real net incremental growth of extraction, investment, production, and consumption per capita hereafter.
The “limits to growth” have arrived, only we do not see it (or we see the effects via the lens of ideology, politics, geography, culture, etc.) because we are woefully uninformed by eCONomists and our system of “education”, and our linear experience of “reality” prevents us from perceiving the exponential and thermodynamic/entropic limits confronting us.
Because of our steep discount rate (we want what we want now, this minute) as human apes, and given the increasing competition from population overshoot for scarce resources, we are caught in a kind of deadly embrace with our appetites, numbers, and a finite spherical planet’s resource constraints. With all other competing systems having been discredited by “success” of rentier capitalism, dominated by the Anglo-American imperial trade regime, there is no obvious viable alternative to the delusion of perpetual growth of population and consumption within a “full world” or a finite planet.
Without an alternative system to assist us in transitioning in order to adapt to the planetary resource constraints bearing down on us, we are that much more vulnerable to systemic crises, increasing scale of conflict, and collapse.
Dr. Chinn,
I’ve sent this over e-mail to you (and to others as well) in the hopes of clarifying my thinking on this matter. Recently, there’s been a meme travelling around that CBO Director Doug Elmendorf said the stimulus would lead to slightly negative growth in 2019. (The link to NRO I give below is one of many.)
To be rather brief, is this anything more than an issue of Elmendorf’s testimony being distorted to align itself with Republican talking ooints? The YouTube clip, after all, belongs to an account called BudgetGOP. If not, how should we think about this? Can we say that, since there is no free lunch, the stimulus will need to be paid for, and the additional debt will make growth slightly lower than it would be while it will still be positive–and that without stimulus, growth would be even lower? Or should we think something else?
Thanks for your time.
http://www.nationalreview.com/corner/283250/cbo-director-stimulus-spending-bad-long-term-growth-andrew-stiles