The CBO has just released the Budget and Economic Outlook. The document is full of extremely useful information, and provides a useful anodyne for some of the reality-free analyses floating around (examples here). For now, I’ll just highlight two interesting graphs regarding tax expenditures:
Figure 4-4 from CBO, Budget and Economic Outlook (January 2012).
From the document:
The major tax expenditures considered here fall into four
categories—exclusions from taxable income, itemized
deductions, preferential tax rates, and tax credits. Of
those tax expenditures, four are exclusions of certain types
of income from individual income taxes: employers’ contributions
for health care, health insurance premiums,
and long-term care insurance premiums for their employees;
contributions to and earnings of pension funds
(minus pension benefits that are included in taxable
income); unrealized capital gains from assets that are
transferred at the owner’s death; and untaxed Social Security
and Railroad Retirement benefits. Employers’ contributions
for health insurance and contributions to pension
funds are also excluded from payroll taxes.
The exclusion of employers’ health insurance contributions
is the single largest tax expenditure in the individual
income tax code; including effects on payroll taxes, that
tax expenditure is projected to equal 1.8 percent of
GDP over the 2013–2022 period (see Figure 4-5). The
exclusion of pension contributions and earnings has the
next largest impact, generating net tax expenditures
(including effects on payroll taxes) estimated to total
1.1 percent of GDP over that period.14 The exclusion
of unrealized capital gains at death is projected to generate
tax expenditures equal to 0.3 percent of GDP over
those 10 years, and tax expenditures for the exclusion of
untaxed Social Security and Railroad Retirement benefits
are projected to equal 0.2 percent of GDP.
Three other major tax expenditures allow taxpayers who
itemize deductions to deduct their spending for certain
items from their taxable income. The deduction for interest
paid on mortgages for owner-occupied residences is
the biggest of those three; tax expenditures for that
deduction are projected to equal 0.8 percent of GDP
between 2013 and 2022. By comparison, the tax expenditures
for deductions for state and local taxes and for
charitable contributions are each projected to equal
0.3 percent of GDP over that period.
Some forms of income are subject to preferential tax rates
under the income tax. Both long-term capital gains and
dividends are taxed at lower rates in 2012 than other
forms of income. Although the preferential rate on dividends
is scheduled to expire at the end of December
2012, a slightly higher preferential rate on long-term
capital gains will continue after that. Tax expenditures for
those preferential rates on dividends and long-term capital
gains are projected to total 0.5 percent of GDP
between 2013 and 2022.
The other major tax expenditures projected by CBO are
two refundable tax credits, both targeted toward households
with children. …
The magnitude of these expenditures, relative to the Nation’s tax revenues and outlays. That is why Jeffry Frieden and I stressed the need for dealing with these tax measures, in addition to increasing tax revenues (such as by letting all the provisions of the 2001 and 2003 tax cuts expire) in our book, Lost Decades. Previous discussion of tax expenditures also in this post.
The relative importance of these various tax expenditures is illustrated in Figure 4-5.
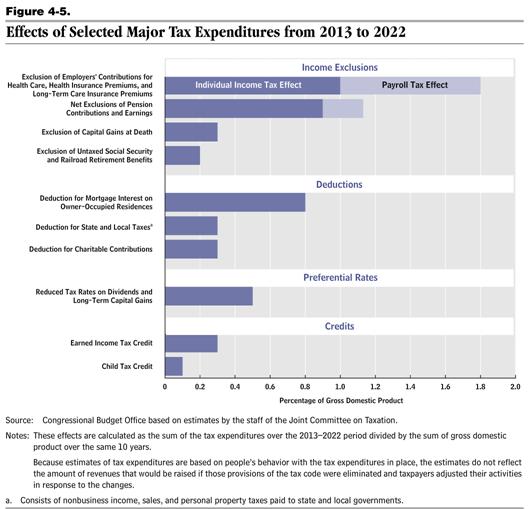
Figure 4-5 from CBO, Budget and Economic Outlook (January 2012).
For more on tax expenditures, one should also see Part II (specifically Chapter 10: “Spending through the tax code”) in Bruce Bartlett’s excellent new book, The Benefit and The Burden: Tax Reform-Why We Need It and What It Will Take (Simon and Schuster, 2012)
(reviewed positively in Forbes, among other places). Bartlett provides a narrative history explaining why many of these tax expenditures came to be, thus contextualizing these otherwise sometimes inexplicable provisions.
More on the CBO Outlook later.
Professor:
This has nothing to do with this post. Nonetheless, I was just reading Benedikt Heid and Mario Larch article on Migration, Trade and Unemployment. It indicates that immigration and open trade (multiple factors) actually increase employment in the host country. This study, while using US data too, focuses on the EU. I have been unable to find a study which compares similar factors among states in the US. Are you aware of any such study?
I find it quite interesting that CBO considers the exclusion of untaxed Social Security to be a tax expenditure, but does not consider the exclusion of untaxed Roth IRA benefits to also the a tax expenditure. Both Social Security and Roth IRA payments are taxed when made, while Roth IRA benefits are wholy untaxed, up to 85% of Social Security benefits can be taxed.
P. 36-37
Had that portion of the decline in the labor force participation rate since 2007 that is attributable to neither the aging of the baby boomers nor the downturn in the business cycle (on the basis of the experience in previous downturns) not occurred, the unemployment rate in the fourth quarter of 2011 would have been about 1 1/4 percentage points higher than the actual rate of 8.7 percent.” (h/t zerohedge)
CBO on unmanipulated unemployment rate:
1.3% + 8.7% = 10.0% unemployment
Ricardo,
What does it mean when they say if neither had not occurred? I interpret that as, ‘if both occurred’. So, the unemployment rate would be 10% if either baby boomers continued to age or the business cycle turned down? Both of those things did occur.
tj,
The CBO is being candid. They are saying that the unemployment number has been manipulated for these supposed factors, not that there are hard numbers for these factors. If you remove the manipulation and consider the labor force participation rate to be the same as in 2007, in other words, without arbitrarily reducing the participation numbers, the unemployment rate would be at least 10%. At timest the CBO does tell us when there is manipulation of the numbers.
Ricardo: I don’t think you are using the word “manipulated” in the same way that the rest of us humans are.
The exclusion of employer provided health insurance has got to go. I did not know that it was such a staggeringly large amount relative to GDP.
The market distortions of third party payment of health costs is at the heart of our health care malaise in this country (pun intended). And third party payment is most encouraged by the tax exclusion.
We could move towards a future where most people pay for routine health care out of their own pockets, and where high deductible catastrophic insurance plans pay for the stuff that is truly unaffordable. Getting rid of the exclusion would put us on the path towards that future.
I agree with Buzzcut.
+1 Buzzcut.
Give everyone a medical debit card with a state issued photo id on it.
The annual balance on the card could be a mix of employer and state government contribution.
The states could pick up the tab for unemployed, low income, retired, disabled, etc.
Any balance that is left at the end of the year goes into a personal flexible spending account for education, retirement, day care, etc.