Actually, not even the footnotes — just the text accompanying data releases (in this case it’s the second paragraph, in a box, of the release). Although, I must admit, this long rant by FoxForum contributing writer Noel Sheppard just made me laugh and laugh and laugh, thus making an otherwise bleak Monday brighter. From “CNN’s Crowley Does Two Segments on Jobs Numbers Without Mentioning Plummeting Participation Rate”
When I saw CNN’s Candy Crowley on Sunday tease an upcoming State of the Union segment saying she’d be discussing Friday’s unemployment report after a commercial break, I was hoping to see a complete analysis of the data provided by the Bureau of Labor Statistics.
Much to my shock and dismay, although she and her guests discussed the economy and the jobs market for eight minutes over two segments, there was not one single word said about the declining participation rate or the record 1.2 million one month increase in the number of people not in the labor force (video follows with transcript and commentary):
As discussed by Jim (and by CR), this misinterpetation arises because of a lack of understanding of how the numbers are calculated. In my view, these sorts of mistakes are common among those looking for the cheap thrills of exposing non-existent data conspiracies. If only Mr. Sheppard read Table C (page 7)of the release!
Of course, this is not the first (or likely to be the last) time such mistakes have occurred. See Brad DeLong’s critique of Professor Robert Barro’s Business Week column of January 2004.
By the way, doing the calculation Jim suggests indicates the “not in the labor force” number fell by 0.075 million…
Update, 2/7, 3:40 Pacific: From Goldman Sachs, “US Daily : Labor Force Participation: Cyclical Boost, Structural Drag” (Sven Jari Stehn, Feb. 6, 2012):
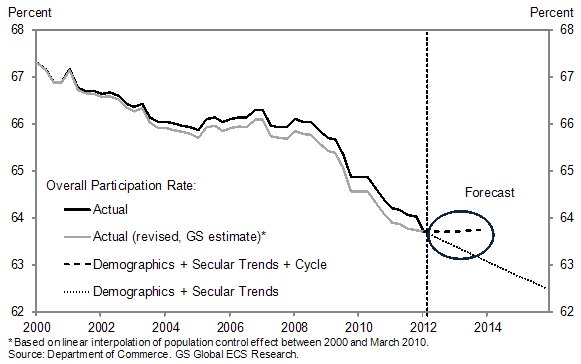
…Updated population estimates in the household survey–which mainly reflect the introduction of new information from the 2010 Census–imply that the labor force participation rate had declined by a cumulative 0.3 percentage point more since 2000 than previously reported. (Note that because official population and labor force estimates are not revised, the 0.3-point decline appears entirely as a drop in the January 2012 print of the participation rate.) The chart below provides a simple estimate of what the “true” labor force participation rate might look like by linearly interpolating the reported 0.3-point decline between January 2000 and 2010–when the decennial census estimates were compiled. At 63.7%, the participation rate now stands at its lowest level since May 1983.
To gauge the outlook for the participation rate, we update a model we developed last year. (For details see Sven Jari Stehn, ” Labor Force Participation: Only a Small Rebound in Sight,” US Economics Analyst, February 11, 2011.)
…
…our model suggests that the participation rate will remain broadly flat at 63.7% through the end of 2013 (see dashed line in the chart above).
Menzie,
The summary does provide a lot of interesting information.
One of the good and bad things about SAARs is that they adjust for variability that occurs “normally” in the data series over a reasonably long period of time. The bad part is that SAARs presume that the influences for the monthly patterns remain fairly static so that when a unique influence occurs it can display some strange results.
This is often the case for industry analysis. The SAARs for automotive sales were fairly reliable, but any change in marketing strategy could create some peculiar results… either very positive or very negative monthly adjusted rates.
In the case of January data, for example, the Black or African American unemployment rate was fairly stable in the mid-to-high 15% range. January shows a precipitous 2.2 pp drop. That should be a red flag and require a good explanation before being accepted as reasonable. We can only hope that the change was not spurious and based on the change in methodology in Table C [the “population control effect” is referenced, but not explained]. I’m presuming that there is an estimate of the workforce population that gets manipulated and was eliminated [on a one-time basis?] which turned a negative into a positive.
Will the methodology change be applied to all months backward? If the change is only applied to forward months, it will be interesting to see if the degree of impact is as much as in January.
It would also be interesting to see an “actual” versus an “estimate.” But it is a survey and subject to the whims of surveys.
the participation rate still fell 0.3% to 63.7% from the last reported; so what if it didnt really happen this month? all that means is that “those not in the labor force” has been underreported until now…
with the benchmark revision & 3 different adjustments, i cannot have confidence in anything in this report…absent the seasonal adjustment, the actual number for january non-farm payrolls was a loss of 2,689,000 jobs; knowing that the BLS confidence interval is on the order of plus or minus 100,000; seasonally adjusting that job loss to show 243,000 jobs gained leaves plenty of room for an error in the methodolgy…
The data from Dec to Jan is not comparable since the BLS introduced population controls in the Jan data and does not adjust prior report data. In order to compare Dec to Jan you need to either apply the population controls to Dec, or remove the population controls from Jan. If you do this, in either case, the Dec to Jan change would show the participation rate increased slightly but effectively remained unchanged with rounding.
The decrease in the unemployment rate was largely a result of the unemployed moving to the employed, with a slight increase in the participation rate where about 75,000 moved from “not in the labor force” to the “employed”.
I wonder if the participation is being overplayed given the general downtrend since 2000. The downtrend coincides with the retiring baby boomers. The number of employed is increasing which is the right direction. Wages are a different story.
http://research.stlouisfed.org/fredgraph.png?g=4QS
Question has to be what do you think the participation rate should be? Given demographics lower? Given historic rates lower? What level should this be? Perhaps just perhaps it is reverting to where it should be and this is not one big bls cover-up………
knq: That depends on whether you’re trying to figure out how this administration is doing versus the baseline or how the economy is doing. As the baby boomer cohort changes from a tail wind to a head wind, it’s going to be more and more difficult to keep the economy humming along. Just because the economy would be doing better if demographic tide was coming in, rather than going out does NOT mean that it is, in fact, doing well. It just means that comparing it to peak boomer employment is an unfair one.
1. Sheppard was right. Candy Crowley did not mention the participation rate, footnot or no footnote.
2. The footnotes essentially say, “Yes, we manipulated the numbers.”
3. Delong’s tortured analysis of Barro is typical rationalization.
Just how many times has the unemployment rate methodology been “revised” since it was dreamed up? Just how many revisions do we need before we question the methodology. In economics the number of revisions depends on the answer you seek. Economics has become a unique “science.” It is the only “science” that determines the answer before seeking data.
Politicians and academics have become experts at hiding the truth under a mountainous data dump.
It would be interesting to know how the data are collected.By the several Fed, we know but how?
How prompt and reliable are the respondents to the data.Who is collecting and gathering,bundling these same data?
I know it is no longer a foot note neither a foot work but still.
Ricardo: I dunno. How many times have we revised the theory of disease, since we thought the “humors” were behind it all. Or is that your current theory?
Can anyone tell me if this except from the article is sound:
“That means it has to assume an enormous tax increase next year, and that means it has to assume that we have bad economic growth. And that gets you high unemployment.”
Is there any information out there on the correlation between tax rates and unemployment. Going back to basic macro, can’t it be argued that a higher tax rate may lead to greater government expenditure leading to feedback effects that buoy the economy and ultimately lead to lower unemployment?
Menzie,
Ricardo isn’t talking about revising theory, something macro-economics badly needs. He is talking about continual manipulation of measurement of data, so that meaningful comparisons become impossible.
Given that it is done by a govt that continually lies to us, it is all the more troubling.
I think what we have proven is that Ricardo doesn’t understand this issue, and will accept any right wing shrill for an explanation.
jwk,
Your question is simple but the answer involves lots of ‘ifs’.
At the most basic level, assume the government takes a dollar from you that you would have spent on food today, and the government spends it on food stamps for your neighbor tomorrow. The economy is the same size but you are worse off and your neighbor is better off.
However, there are also externalities. For example, society may be better off if the transfer of wealth reduces/prevents violence and damage associated with the OWS crowd.
Menzie: Admittedly I only spent two minutes flipping through your links (which is two minutes I won’t get back), but as far as I can tell Sheppard is technically correct in that Crowley does not mention changing in the labor force. And then you come back and criticize Sheppard for not thoroughly reading the BLS release. So I say, huh? What does the BLS report have to do with Crowley’s interview.
On top of that the 1.2 million increase of those not in the labor force that Sheppard cites is in Table C of the BLS report, so for all we know he did read the footnotes. Perhaps you are pointing out that he used the unadjusted numbers and should have focused on the adjusted numbers, but if that was your point you should go back and brush up on your skills on writing clearly and to the point, because it takes you until the very last sentence of the post to make that point.
“there was not one single word said about the declining participation rate or the record 1.2 million one month increase in the number of people not in the labor force”
rjs said: “the participation rate still fell 0.3% to 63.7% from the last reported; so what if it didnt really happen this month? all that means is that “those not in the labor force” has been underreported until now…”
So does that mean the 1.2 million did occur but happened over more than one month instead of one month?
Jim A: I wasn’t suggesting the economy was doing well but that employment is moving in the right direction. Since demographics seem to cloud the participation rate, the focus should be the number of employed of those who want to be employed. That number is increasing which is necessary but not necessarily a sufficient condition for an economy to start doing well.
Bryce: Yes, yes, I agree! And darn that crazy chain-weighting of GDP. If only we still used Paasche, all would be well… In fact, down with national income accounting! Why should we put things into arbitrary categories when the old way of counting up metal fasteners and corsets worked so well. I say — “Back to the past!”
GROTF: Yes, it has been under reported all along and lumped into the Jan report. However, for observing month to month trends, there was a slight increase in the participation rate from Dec to Jan. One can say the participation rate contributed to the Dec to Jan decrease in the unemployment rate in that more people went from not participating to employed. Not from unemployed to not participating which has been the trend. The Jan report is a reversal of that trend.
knq, thanks!
Bruce Hall: The adjustment is not of the typical seasonal adjustment type. Rather it is driven by the incorporation of actual new information, from the 2010 Census.
rjs: You clearly do not understand the differing series. This post is referring to the household based series, the revisions you refer to pertain to the establishment series. Until you have these series clearly distinguished in your mind, I don’t see how you can make any critical judgments regarding the utility of either series.
Jeff: I suggest you consult this sentence from the post:
Well, the BLS document doesn’t say that the participation rate declined by 1.2 million in one month — that is the point of the text. So, criticizing Candy Crowley for not saying this is like criticizing me for not claiming the moon is made of cheese.
In the old days, the data in the hard copies of IFS came with these “double triangles” which flagged data breaks — I miss those, in this day of easy to download series. And in the hard copies and PDFs of BLS releases there are these things called “footnotes” which flag data breaks. All I’m asking is that people read ’em. If indeed Sheppard had read the footnotes before writing the piece, then in that interpretation, he is being disingenuous, rather than sloppy. I’ll leave to the readers which interpretation is more appropriate.
In any case, I hope you are more careful in your treatment of data, for the sake of the Nation.
Menzie,
“…down with national income accounting!”
Good, you are getting closer by recognizing aggregate accounting allows the left hand to freeze while the right hand burns, and you are also correct that Keynes’ pre-Adam Smith mercantilism was “back to the past.” I just don’t understand why our “modern” economists persist in suggesting the FED continue bleeding the patient when the facts prove blood-letting has never worked and usually kills the patient.
It really is Candy Crowley’s fault. What she should have said is:
“Some people who are numerically illiterate or intellectually dishonest will note that the report shows a decrease in labor participation of 1.2 million people. However, the morons/liars (hard to tell them apart) suggest that this decrease occurred in one month. It really occurred over the last 12 years and is based on new information as a result of the 2010 census. In fact the actual labor participation last month was flat or slightly increasing making this whole invented tempest a non-issue. So never mind. I’m sorry I even brought it up and wasted your time. The idiots made me do it.”
menzie, i understand the two surveys well; write about them every month here: http://marketwatch666.blogspot.com/
i wrote two paragraphs above; the first was to answer your post, the second was to say i couldnt deconstruct this report for the life of me…
A timely paper from the Chicago Fed analyzing the long term decline in the participation rate.
http://www.chicagofed.org/digital_assets/publications/chicago_fed_letter/2012/cflmarch2012_296.pdf
I pulled historical data off of BLS on participation rates the other day.
SA…from 1950 to current. I don’t understand all the angst over the current participation rate.
From 1950 till now, the rate has fluctuated between 58 and 67 (roughly). It is currently right in the middle of that range.
Prior to the mid 1970s, the rate never was above 63 or so (the graph was a little too small). I suspect you all have better access to the data.
In the 1970s participation rate ramped up…now it is ramping down.
The ramp up was due, in part, to women entering the labor force and the current downturn is due, in part, to retirements.
There are 77 million (?) baby boomers…why wouldn’t a drop in participation rate be expected?
Menzie: Your response was anything but clarifying.
You said: the BLS document doesn’t say that the participation rate declined by 1.2 million in one month
Agreed, but neither did Sheppard.
Sheppard said there was a 1.2 million increase in the number of people not in the LF. Now, after looking at Table C on p.7 of the release for a second time I see a column marked “Dec-Jan change, as published”. I also see a row marked “Not in Labor Force”. In the corresponding cell I see the number 1,177 thousand, as a someone might report 1.2 million. I also interpret that number to mean there was a 1.2 million increase in the number of people not in the LF. I see no footnote to this piece of data and still do not see the egregious error that Sheppard had made. Care for a third try at making your point?
Jeff: How much more clear can I make it. In my last comment, I put in bold face the text where he said 1.2 million increase in the number of people in the labor force, in one month. It’s direct from his text! The point is, it didn’t happen in one month! Or do you assert that it did happen in one month.
Menzie: A good rule of thumb is to at some point actually write the point you want to make. Hint: The title is often a good place to start. It took you one post and two comments to actually say what Sheppard’s mistake was. And, no using bold type is not an acceptable substitute for something as central as your main point. Obtuse writing does not equal insightful writing. Since I know you are a fan a bringing it back to basics, so perhaps you should pay the university’s writing center a visit. I’m sure they can help.
Jeff: OK, sure will. By the way, would you like to compare publication records? I would be happy to post yours and mine together for all to compare.
Jeff: By the way, the specific error was flagged by me referring to Jim‘s point in the sentence after the quote. But I suppose in your case, I truly will have to idiot-proof my writing; I will endeavor to do so in the future.