Several observers have noted that exports have increased substantially since the President made his commitment to doubling exports. [1] The most recent GDP release confirms improvement in the net exports to GDP ratio (ex. oil imports) and real exports, and a BEA release from a month and a half ago confirms a rebound in manufacturing value added.

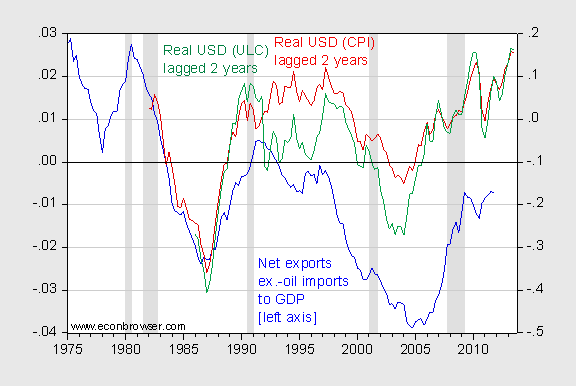
Figure 1: Net exports ex.-oil imports to GDP (blue, left axis), and log CPI deflated trade weighted USD exchange rate lagged two years (red, right axis), and log real ULC deflated trade weighted USD exchange rate lagged two years (green, right axis). NBER Recession dates shaded gray. Source: BEA, 2011Q4 advance release, IMF, International Financial Statistics, and NBER.
Figure 1 confirms that the real exchange rate lagged two years has a measurable correlation with the ex-oil trade balance. I’ve documented the evidence for a causal effect in several previous posts. One new observation I’ll make is that the unit labor cost deflated real exchange rate is more highly correlated with trade balance movements than the conventional CPI deflated. Theory suggests that the ULC deflated measure would better measure international competitiveness. [paper] The practical matter is that unit labor costs are available for a subset of countries (typically developed), so the unit labor cost index does not incorporate Chinese costs.
Eyeballing Figure 1 suggests that the trade balance should continue to improve, given depreciation of the dollar to date. Of course, rest-of-world growth matters as well, so that conjecture is conditional.
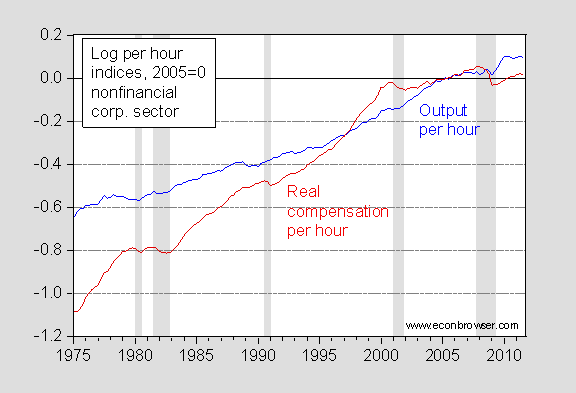
Recalling unit labor costs equal output per hour (productivity) divided by nominal compensation, it’s useful to inspect US productivity trends.

Figure 2: Log output per hour in the nonfinancial corporate business sector (blue), and log compensation deflated by the nonfinancial corporate business sector deflator (red). NBER defined recession dates shaded gray. Source: BEA via FRED, NBER and author’s calculations.
Notice productivity continues to grow, and has recently outpaced real compensation (deflated using the sector deflator, not the CPI). This suggests to me continued pressure for improvement in the trade balance, as competitiveness continues to improve. The wild card in the analysis is of course China. In that case, we don’t have a clear idea of unit labor costs in the tradable sector. [2] [3]
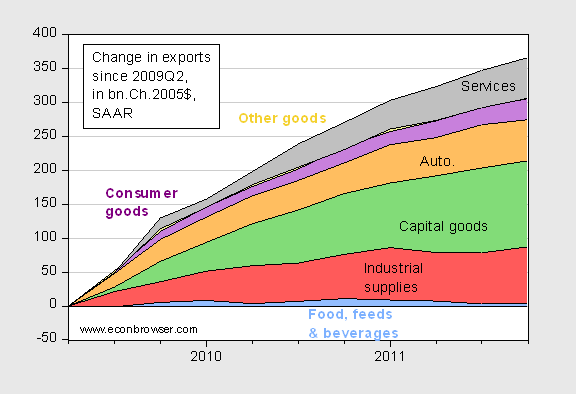
Other commentators have noted that while exports might continue to increase, it’s not clear manufactured exports will. Figure 3 plots cumulative changes in real exports vis a vis 2009Q2.

Figure 3: Increase in real exports relative to 2009Q2, in bn. Ch2005$ SAAR. Source: BEA, 2011Q4 advance release.
Clearly, export growth is decelerating — not surprising given the collapse in trade volumes that took place during the great recession. Nonetheless, I find it interesting how much capital goods exports have increased. Now, as I mentioned in an earlier post, vertical specialization means that it’s unclear how much value added is incorporated in particularly the goods exports. Still, I think there is evidence for a manufactured exports rebound.
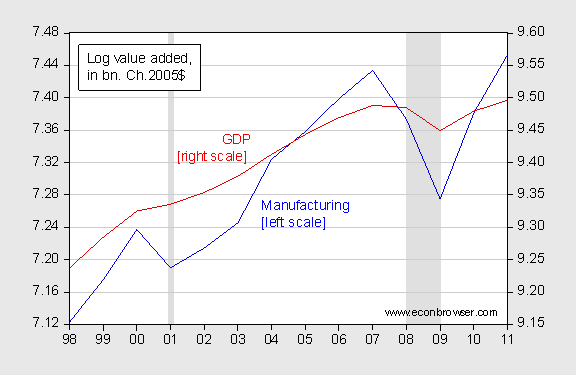
Finally, there has been substantial skepticism that manufacturing employment will rebound strongly, even if the President’s initiatives outlined in the State of the Union are implemented. [4] I think that skepticism is largely warranted, given rapid productivity growth in that sector. However, that doesn’t mean that manufacturing value added won’t necessarily rebound. BEA only released data up to 2010 last month, so one can’t be sure. Extrapolating using quarterly BEA output data to 2011Q3, and Fed manufacturing data through December 2011, one can obtain the plot of manufacturing value added and GDP in Figure 4.

Figure 4: Log real manufacturing value added (blue, left scale), and log real GDP (right, right scale). 2011 observation for manufacturing extrapolated using a log-difference regression of value added on quarterly manufacturing output from BLS, and monthly manufacturing output index from the Fed. Source: BEA, GDP by Industry.
So while GDP is less than a percentage point above 2007 levels, manufacturing output is 2% above. This is notable given the trend decline in real manufacturing to real GDP. Hence, I think that a continued decline in the dollar’s value conjoined with continuing productivity growth will induce rebalancing toward greater manufacturing value added – both by way of greater exports and fewer imports. To the extent that wages in manufacturing tend to be higher than in retail and distribution, the spillover effect from higher manufacturing output might be disproportionate.
Of course, I think the more relevant question is the output and employment in the tradable sector. See here and here.
I’m not quite sure how to interpret this data without reference to energy movements.
The cost of imported oil increased from $700 bn in 2010, to $900 bn in 2011. Thus, the trade balance saw deterioration of $200 bn on that front.
On the other hand, as Jim earlier noted, US oil product exports are up 1 mbpd compared to last year, representing an annual value of $40 bn. So that’s a plus.
Crude oil imports in 2011 were also down 320 kbpd, or about $13 bn in value. I would anticipate that crude oil imports will continue to fall, and exports probably continue to rise. I would not anticipate a material oil price rise in 2012 (unless it leads to a recession), so I think the trade balance for hydrocarbons will tend to stabilize from here on out.
I would also note that natural gas net imports are down 2 bcf/day, or about $3 bn in value, in the last year. This may not improve much, as US producers are now moving to shut in production because gas prices are so low.
So we can speak about the trade balance ex-oil, but it’s not giving a clear picture.
So this is the second time in two decades that the yen has fallen to less than 80 to the dollar (which is a sign of yen strength and dollar weakness).
I recall the last time, in the ’90s, the Japanese automakers responded by building more cars in the US. The same thing is happening this time, with a vengeance.
Amazing how going from 120 yen to the dollar to 76 can solve so many of our problems.
I guess I wonder how much of that improvement in the overall trade deficit is due to just the decline in the Japanese trade deficit?
You would think that, at some point, Honda and Toyota would cry uncle and just become US companies. Move their primary listing to the NYSE, move their corporate headquarters to LA or wherever, and just get it over with. The cars are designed, engineered, and built here. It’s the logical next step.
I don’t think it affects any of the points you make here, but I always find it odd to look at trade balance ex oil imports, while including exports of petroleum refinery products. The US exports quite a lot of those these days. Increased commodity prices could make worker productivity look larger, but I guess use of sector-specific deflators would account for that?
Here is the annual chart through 2010 showing the number of US rigs drilling for oil (EIA):
http://www.eia.gov/dnav/pet/hist_chart/E_ERTRRO_XR0_NUS_Ca.jpg
Following are the EIA numbers for US oil rigs through 2010 (estimated for 2011):
2008: 379
2009: 278
2010: 591
2011: 1,000
The net increase in average US crude oil production in 2009 was 0.4 mbpd*, or about 1,440 bpd per drilling rig.
The net increase in average US crude oil production in 2010 was 0.1 mbpd, or about 170 bpd per drilling rig.
The net increase in average US crude oil production in 2011 was 0.1 mbpd (through, October). If this number holds, the net increase per drilling rig would be about 100 bpd per rig.
*The entire net increase from 2008 to 2009 was due to the GOM (presumably production rebounding from hurricane damage + deepwater). Gulf of Mexico production (federal):
http://www.eia.gov/dnav/pet/hist/LeafHandler.ashx?n=PET&s=MCRFP3FM2&f=A
This is why I tend to use 2004 US crude oil production (5.4 mbpd) as a reference point. We hit 5.4 mbpd in 2009, 5.5 mbpd in 2010, and 5.6 mbpd in 2011 (through October). Annual US crude oil production (through 2010):
http://www.eia.gov/dnav/pet/hist_chart/MCRFPUS2a.jpg
Incidentally, note that the average oil well in Texas produced 21 BOPD in 1972 and 6 BOPD in 2010, and the average gas well in Texas in 1972 produced five times as much as the average gas well in Texas in 2010 (Texas RRC). These numbers are probably indicative of the overall sharp decline in average per well production rates that we have seen in the Lower 48.
The industry wants to consumers to look at very slowly increasing US crude oil production, as a sign that we don’t have any oil supply problems, and they don’t want consumers to focus on the fact that global crude oil prices doubled from $55 in 2005 to $111 in 2011.
From the point of view of consumers, what is the more important metric, an average net rate of increase of 100 BOPD per drilling rig per year in US crude oil production in 2011, or the annual Brent crude oil price of $111 that we saw in 2011?
If we look at the BP data base (total petroleum liquids), US production rose by 0.3 mbpd from 2004 to 2010, but consumption fell by 1.6 mbpd. My point being that the dominant trend is that the US, and many other developed oil importing countries, are gradually being shut out of the global market for exported oil, as annual Brent crude oil prices doubled from 2005 to 2011.
US oil rig count was 1225 for the past week.
But no worries, the US is now a “Net exporter of oil.”
http://www.spectator.co.uk/columnists/all/7603773/peak-oil-really-could-destroy-the-economy-just-not-in-the-way-greens-think.thtml
Peak oil really could destroy the economy – just not in the way greens think
Excerpt:
“Then in 1956, another renowned expert called M. King Hubbert declared that oil reserves were far more limited than was generally recognised; in the US supplies would peak between 1965 and 1970. Sure enough US oil production did indeed peak in 1970. Woah! How spookily prescient was that?
“Actually, not very. Last year, for the first time since the 1940s, the US became a net exporter of oil — helped by such discoveries as the Bakken shale beneath North Dakota, which is reckoned to have between 4 billion and 24 billion barrels of recoverable oil.”
As Mark Twain said, “A lie can travel halfway around the world while the truth is putting on its shoes.”
(Most of this net exporter nonsense seems to be related to the WSJ article that highlighted the fact that the US, because of weak domestic demand, became a net exporter of refined petroleum products last year. We remain dependent on imports* for about two out of every three barrels of crude oil processed in US refineries. Based on the BP data base, 84% of the decline in US net oil imports since 2004 was due to reduced consumption, as we were outbid by the developing countries for access to a declining supply of Global Net Exports of oil.)
*Especially from Canada, but US Mid-continent refiners continue to provide Canadian producers with multi-billion dollar incentives to take their oil elsewhere.
Steven,
I’m using average annual rig counts, but as noted above, over the past two years (based on 2011 data through October), as the (oil) rig count has increased, the incremental net increase in US crude oil production per rig per year has fallen.
This doesn’t bode well for other, generally more expensive, shale provinces around the world.
And of course, the EIA recently announced a massive reduction in estimated US shale gas resources in the US, while some recent shale gas completion attempts have been non-commercial in Poland.
What about the Triffin Dilemma? Can the US actually diminish its trade deficit without removing too many dollars from the global economy. Is there not a ‘dilemma’ that causes the very consumer base to shrink that is necessary to expand if US exports are to increase?
ray