From the WSJ yesterday:
After a sizzling start to the year, gasoline futures prices are sliding, easing pressures on drivers and the U.S. economy and raising the prospect that prices at the pump could be headed lower still.
Gasoline futures, a key yardstick for wholesale prices, are down 6.3% from their high for the year reached on March 26, as the price of crude oil that gets refined into gasoline has dropped a similar amount amid easing tension over Iran, the world’s fourth-largest oil producer.
…
Joanne Shore, a senior analyst of the EIA, says retail prices typically lag behind those of gasoline futures by a few weeks. About half of the change in futures gets passed through within a week, and the rest tends to show up over the next several weeks, according to Ms. Shore. who follows gasoline prices.
…
In addition to lower tension over Iran’s disputed nuclear program, two major east-coast refineries that had been earmarked for closure now appear to be getting a new lease on life. The owners of the refineries, ConocoPhillips Co. and Sunoco Inc., are in talks to sell the facilities rather than close them.
Meanwhile, refineries in Europe and the U.S. that had shut down for maintenance are due to come back on line soon, increasing available supplies, Lawrence Eagles, an analyst at J.P. Morgan Chase, JPM said in a recent research note.
Figure 1 depicts the relationship between RBOB futures for the front month, and the price of gasoline (in logs) over the 2005M10-2012M04 period (that’s the period I could get the futures data).
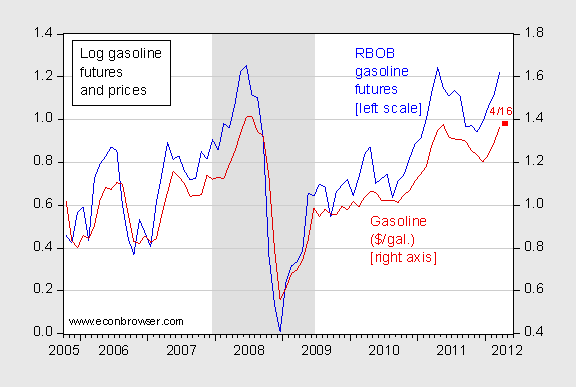
Figure 1: Log gasoline futures (end of month for front month contract, RBOB NYMEX) (blue, left axis) and log gasoline price per gallon (all, average of month) (red, right axis). Observation for April is for 4/16 (red square). NBER defined recession dates shaded gray. Source: ino.com, St. Louis Fed FRED, NBER, author’s calculations.
The relationship appears to be pretty strong; a simple bivariate regression using the lagged futures price yields the following estimates:
(1)
Adj-R2 = 0.97; SER = 0.034; DW = 1.90; smpl = 2005M11-2012M03; n = 77
Using this relationship, and the futures prices as of April 19, one can infer the path of future gasoline prices. I show the result in Figure 2:
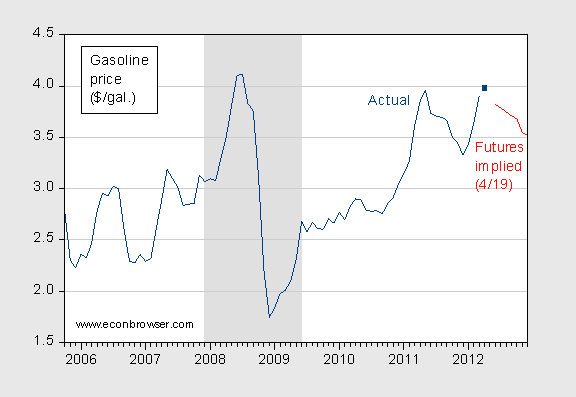
Figure 2: Actual price of gasoline, all formulations, $/gallon (dark blue), and gasoline prices implied by futures as of 4/19 and equation (1). April observation is for 4/16 (dark blue square). NBER defined recession dates shaded gray. Source: ino.com, St. Louis Fed FRED, NBER, author’s calculations (see text).
One issue is whether futures are an unbiased predictor (or even a particularly good predictor) of future commodity prices. In fact, this was the subject of some research conducted at the CEA back in 2001. The academic version of this memo, updated and expanded, was reported in Chinn and Coibion (Tables 1 and 2) [post; An energy-focused earlier version, Chinn, Coibion, Leblanc (2005); described in this post]. The energy excerpt from Table 1 is presented below.
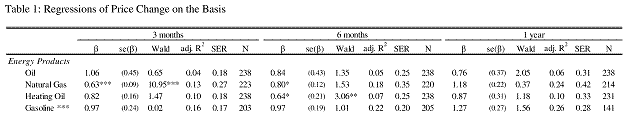
Table 1 from Chinn and Coibion (2010). Note: The table presents estimated results by OLS of equation (2) in the text for different commodities and futures prices horizons.
For gasoline, only the old version (“HU”) of futures are used in the regressions. Statistical significance at the 10%, 5%, and 1% level are denoted by *, **, and *** respectively. For β, the null is that β=1. Newey-West HAC standard errors, using truncation equal to the futures horizon minus one.
We find that gas futures at the 3, 6 and 12 month horizon are essentially unbiased predictors of future spot prices (for the earlier series, NYMEX futures ticker “HU”). While the proportion of variation explained is not particularly high (17%), futures outperform a no-drift random walk (although not with statistical significance), along the RMSE and MAE dimensions. In contrast, an estimated (rolling) ARIMA(1,1,1) does worse than a no-drift random walk (and hence obviously, futures).
Hence, market expectations (as proxied by futures, which appear to be unbiased predictors for gasoline prices) predict a downward drift in gasoline prices, to about $3.50 by year’s end.
Menzie,
Good analysis! While $3.50 is still high it is not high relative to prices and the money supply level. I have been telling my political friends not to make too much of gas prices in attacking President Obama because they will turn before the election. Those who are running political commercials on the high price of gasoline could have egg on their faces in the fall.
Thanks Menzie, interesting analysis.
Good to see some things don’t change. GAO did this analysis 20 years ago with a polynomial distributed lag regression and found pretty much the same thing.
http://archive.gao.gov/d37t11/148819.pdf
I also see prices in about the range, but due to weakness in demand, from both China and the US. So I am aligned on the actual price, but not necessarily on the economic context.
Y’know Kopitz, Menzie did not make any speculation on the reason behind the underlying futures prices movement… Dunno, not seeing why you insist that your analyses diverge or contradict outside of the price figure??
Sorry for spelling your name wrong there, by the way, Steve Kopits. Muscle memory jerked my finger to the Z key instead of the S.
A fairly simple look at gasoline prices based on the average price for 1Q vs. 2Q to 4Q average and the annual average using EIA data doesn’t suggest there is much relief to be had:
http://energyecon.blogspot.com/2012/04/price-for-motor-gasoline-in-2012.html
energyecon: Wouldn’t have made more sense to estimate the seasonals directly using regression? I would’ve run (in logs) a regression of gasoline prices on oil prices and quarterly dummies. Right now, I suspect you have generated a compound seasonal incorporating the gasoline seasonal and a spurious oil seasonal dominated by recent years (where spikes have been lareger).
Chris –
Menzie’s analysis is based on the futures market–not necessarily a bad way to forecast for the duration in question.
I, on the other hand, tend to focus on fundamentals. Here’s my read right now:
Suppy
No major changes over last year. So I don’t anticipate any material easing in prices due to fundamental supply conditions, ie, excluding politically driven events like war or peace with Iran.
Demand
In general, it would appear that no country can sustain oil prices at $125 Brent. US consumption started falling at $85 Brent in summer 2010 and has been falling since. I expect US consumption down 5% this year–that’s a lot.
China: I see China’s carrying capacity (the point at which demand starts to fall) at around $115 Brent. So demand will uncork in China, too. This suggests Brent prices in the $110-120 range going forward. It could be less if OECD and non-OECD demand stay on trend. Could be more if either economy finds some strength and exhibits price inelastic demand. I don’t think that happens, but it also suggests both economies remain pretty soft going forward.
So that’s what I’m thinking. I suppose I was trying to round out Menzie’s technical analysis with some fundamental analysis.
S. Kopits: US demand has been falling for four years. Maybe you meant 2007 instead of 2010.
I think your fundamental analysis is somehow missing the most fundamental aspect. Depletion of existing reservoirs of relatively cheap oil is ongoing and increasingly important. If the price of oil is going to fall, demand destruction must outpace the forces of depletion, which cause cheap and easy oil to be replaced (or not) with much more difficult, lower energy-return types of oil.
Next year the same ~90 mbd will provide less energy to end users, and each barrel will cost more. So if we decide we need the same amount of energy, we’ll progressively need more and more barrels produced to get it, and will be paying increasing amounts per barrel.
The price will be determined by the outcome of the race between depletion and demand destruction.
Robert –
US oil consumption peaked, I believe in 2005. If fell from late 2007 from the first to the last month of the recession.
Then it started to recover. For this business cycle (starting June 2009), oil consumption peaked in August of 2010, with Brent at $85 a few months earlier. Oil consumption has fallen since then.
March 2012 consumption was 5% lower than March 2011, down 1 mbpd. That’s huge. March 2012 was also 1 mbpd less than the EIA STEO predicted as late as July 2011, I might add.
US oil consumption appears in free fall, and I don’t expect this to change anytime soon, as I estimate the current carrying capacity (the price at which demand begins to fall) at $95 Brent.
So, to be clear, this is the second cycle of falling consumption for the US since 2007.
Menzie I would’ve run (in logs) a regression of gasoline prices on oil prices and quarterly dummies.
Since the gasoline and oil price data require one order of differencing for stationarity, wouldn’t it be better to regress log differences rather than log price levels? Or did you have in mind finding a long run relationship in levels and a shorter run error correction in first differences (assuming one exists)?
2slugbaits: I would typically estimate an error correction model, test for cointegration, and use that as a means of getting the seasonals. But an Engle-Granger regression would be a reasonable first cut.