So-so news, and how we can sustain net export growth
From BEA/Census:
The U.S. Census Bureau and the U.S. Bureau of Economic Analysis, through the Department of
Commerce, announced today that total February exports of $181.2 billion and imports of $227.2
billion resulted in a goods and services deficit of $46.0 billion, down from $52.5 billion in
January, revised. February exports were $0.2 billion more than January exports of $180.9 billion.
February imports were $6.3 billion less than January imports of $233.4 billion.
Implications for 2012Q1 GDP, and Onward
The smaller estimated trade deficit has clear implications for the estimate of GDP in 2012Q1. From Macroeconomic Advisers (not online) today:
We raised our tracking estimate of GDP growth in the first quarter by five-tenths to 3.1%. Net exports were above expectations in February with much of the surprise reflecting weak imports. However, net exports of capital goods were stronger than expected, implying less E&S in the first quarter.
The data on trade in February had no bearing on our forecast for second-quarter GDP growth, which stands at 2.5%.
I think it’s useful to place in perspective what these figures mean for growth looking further. I plot the NIPA series on exports and imports, and the trade release figures. I assume the first two months of 2012Q1 are representative of exports and imports for the entire quarter. This yields figures 1-3.
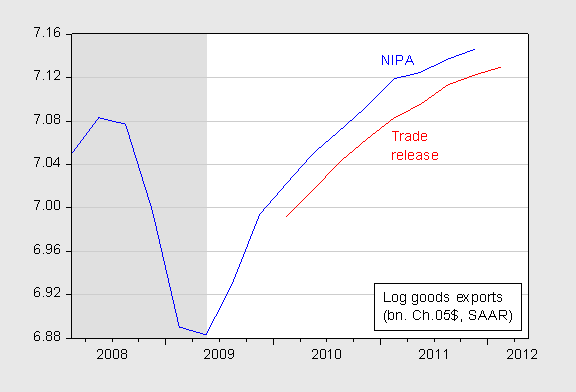
Figure 1: Log real goods exports from NIPA (blue), and from trade release (red), in billions of Ch.05$, SAAR. NBER defined recession dates shaded gray. Source: BEA, 2011Q4 3rd release, and February 2012 trade release, NBER, and author’s calculations.
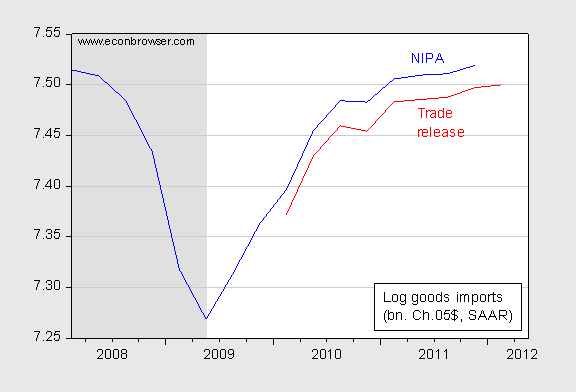
Figure 2: Log real goods imports from NIPA (blue), and from trade release (red), in billions of Ch.05$, SAAR. NBER defined recession dates shaded gray. Source: BEA, 2011Q4 3rd release, and February 2012 trade release, NBER, and author’s calculations.
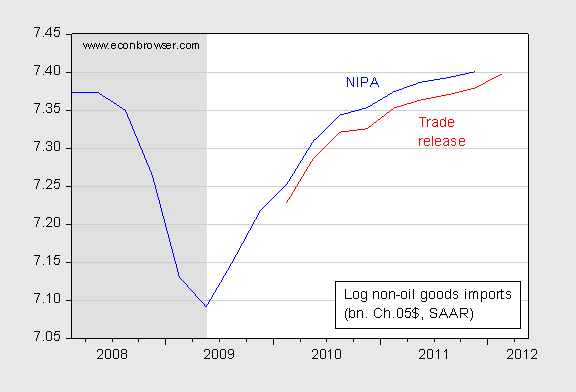
Figure 3: Log real goods imports ex.-oil from NIPA (blue), and from trade release (red), in billions of Ch.05$, SAAR. NBER defined recession dates shaded gray. Source: BEA, 2011Q4 3rd release, and February 2012 trade release, NBER, and author’s calculations.
On first glance, thinking ahead to 2012Q2, one might find some worrying aspects to these trends. Exports are showing a slight deceleration (although it’s important to recall that the 2012Q1 observation is for the first two months).
The other worrying aspect is the slowdown in import growth (Figure 2) is that it might be signaling an economic slowdown. Note, however, that non-oil imports (Figure 3) actually exhibits some acceleration. Moreover, as Paul Edelstein/IHS Global Insight notes (not online):
On the surface, a sharp decline in imports raises concerns about domestic consumer and business spending. But other indicators in February and March suggest that domestic demand is strengthening. Instead, the decline in imports was almost certainly supply-related. The Chinese lunar New Year, which spilled into early February this year, idled Chinese factories that produce goods for US markets. Because the Chinese holiday doesn’t typically fall in February, the seasonal factor does not adjust for it. So if the Chinese New Year is the culprit, and if demand for imported goods remains robust, then the import bill will likely rebound in March.
The Prospects for the Export Boom
As noted above, goods export growth is slowing. My first observation here is that, as noted by Rampell/NYT, services are a big share of exports. Given the fact that there is a substantial amount of import content in goods exports [1] [2], in value added terms, exports are even more important (not accounting for vertical specialization in goods, nominal services account for 29.4% of total nominal exports in 2011Q4). Nominal services grew at 8% in 2012Q1 (based on the first two months data).
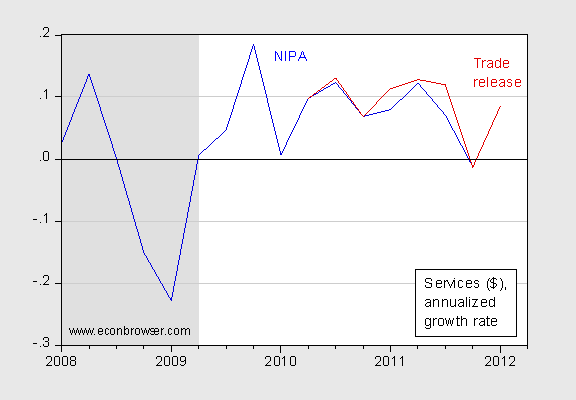
Figure 4: Growth rate of nominal services exports from NIPA (blue), and from trade release (red), annualized. Growth rates calculated using log first differences. NBER defined recession dates shaded gray. Source: BEA, 2011Q4 3rd release, and February 2012 trade release, NBER, and author’s calculations.
Policies to Promote Exports
The Administration has pushed for exports via the National Exports Initiative; the specific measures and outcomes are listed in this post. These various measures include those aimed at reducing entrance costs for small firms; these make sense in the context of the new trade theory models in the vein of Melitz (2003) (see this post, as well as Economic Report of the President, 2010). (By the way, the Congress has passed, and the President has signed, an FTA with Korea, contrary to assertions made by Governor Romney [3].)
That being said, I think the important variable — that we have control over — is the exchange rate. Figure 5 plots the real value of the dollar against a broad basket of currencies.
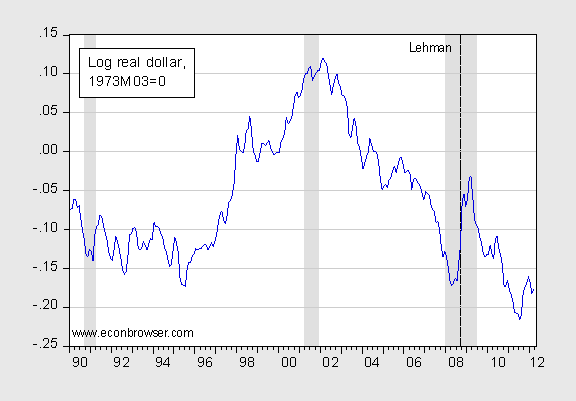
Figure 5: Log real trade weighted value of the US dollar, against a broad basket of currencies. NBER recession dates shaded gray. Source: Federal Reserve Board via St. Louis Fed FRED.
The more expansionary the monetary policy (either directly by increasing money supply, or by increasing inflationary expectations), the more we can drive the dollar down against other currencies, including the RMB and other East Asian currencies. If foreign demand holds up, then exports will continue to grow (elasticity estimates here); HSBC argues that BRIC economies are doing that — with the exception of China. [4]
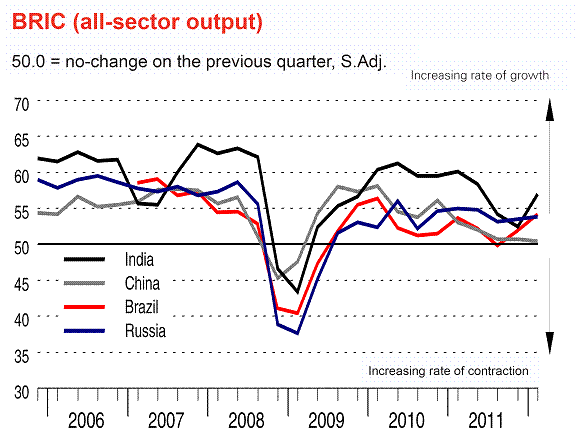
Figure 6: Diffusion indices for BRICs. Source: Stephen King, “EMI underlines the relative immunity of emerging nations to the economic permafrost of the developed world,” HSBC Emerging Markets Index, Q1 2012, April 12, 2012 [not online].
Anyone notice ECRI is still holding its recession call?
“The more expansionary the monetary policy (either directly by increasing money supply, or by increasing inflationary expectations), the more we can drive the dollar down against other currencies, including the RMB and other East Asian currencies. If foreign demand holds up,…”
I would like to see a plot of the dollar against the East Asian currencies. I suspect there has been little movement, owing primarily to China’s currency peg. Instead, Ben’s policies have just pushed the dollar carry trade and added pressure to the most fragile link in the chain that holds our economic recovery – the euro area. (This effect is exagerated by the Asian currency pegs.) He is just blowing another bubble in sovereign European debt that will probably come back to our regret, with interest.
I recall reading that exports (NSA) to EU were up in the last report. That doesn’t seem likely to continue with austerity kicking in. I think the U.S. exports can grow even if the EU is in recession, but how about Asia? Does the EU account for more of Asian trade? I don’t know.
Also, if the EU falls into recession, it will become obvious that growth will not solve their sovereign debt crisis. Then what? Will the IMF and US be able to rescue Europe if the FED is in the middle of fighting a second round of global financial market turmoil?
No mention that non-oil exports are up 7.6% on an annualized basis?
I would like to see a plot of the dollar against the East Asian currencies. I suspect there has been little movement, owing primarily to China’s currency peg.
Well, the yen is at 80 to the dollar, which is off its highs of 76 to the dollar, but still high by historical standards.
Getting our fiscal house in order, so that the mercantalists can’t recycle their trade earned dollars into T-bills, would also put more pressure on the dollar to move down. I can’t help but notice that the last time the yen was 80 to the dollar was during the Clinton surplus years.