Following up on my post The Recovery According to Ed “We are not in a recession” Lazear
, reader Rick Stryker writes:
Lazear’s points are clear: 1) Real growth has been sub-par in this recovery compared to previous recoveries…
This point is clearly falsified by the graphs from the St. Louis Fed:
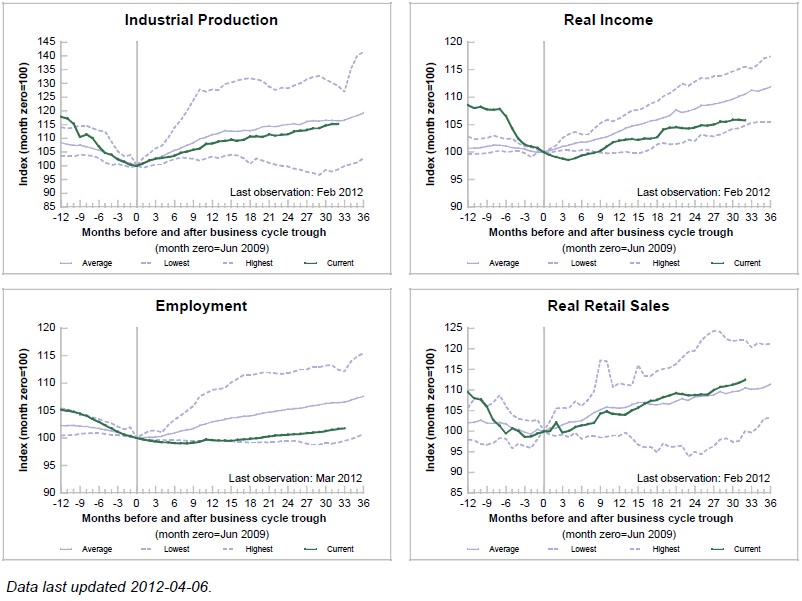
Figure 1: NBER Business Cycle Dating Committee indicators, in current and previous recoveries; from St. Louis Fed. NOTE: The charts plot four main economic indicators tracked by the NBER dating committee; each series is indexed to 100 at the start of the expansion. The green line indicates the current expansion. The solid blue line indicates the average of the previous ten expansions. The two dashed lines report the highest and lowest values recorded across these previous expansions. For industrial production, employment, and real retail sales, the average series includes the 10 expansions starting with the October 1949 business cycle trough. For real income, the average starts with the February 1961 trough. For additional information, see the Federal Reserve Bank of St. Louis Economic Synopses, 2009, No. 4.
Even using employment, one sees that this is not the worst recovery. Further, inspection of real GDP heightens the disquiet one might have regarding Professor Lazear’s assertion that the current recovery is the worst ever (even leaving aside recoveries in other countries).
Figure 2: GDP: The green line indicates the current expansion. The solid blue line indicates the average of the previous expansions. The two dashed lines report the highest and lowest values recorded across these previous expansions. All normalized to 100 at trough. Source: St. Louis Fed.
I have stressed the fact that the output gap is the correct metric for assessing what policy should do. [1] [2] [3] Hence, another way to assess progress is to see what the output gap has done since the trough. I do this for the current and previous three expansions. (By the way, this is much better than picking an ad hoc trend to compare against, especially since log GDP appears to a difference stationary process).
Figure 3: Log output gap for 2009Q2 recovery (blue), 2001Q4 recovery (red), 1991Q1 recovery (green), 1982Q4 recovery (purple). Output gaps calculated using real GDP and CBO potential output. Source: BEA 2011Q4 3rd release, and CBO, Budget and Economic Outlook, January 2012.
By this metric, the Bush recovery of 2001Q1-2007Q4 is pretty much tied for worst recovery of the last four.
None of this should detract from the point that, even if the Bush recovery was worse, we should still maintain fiscal and monetary stimulus.
However, the magnitude of recovery ought to be taken in context with the magnitude of recession. This is a point you were happy to criticize Ed for in his original op ed, but apparently is something that can be conveniently ignored when you want to make your point.
Not valid – all achieved by the USSA becomining a degenerate borrower.
Factor that in.
This is the worst recovery ever….just ask my main street dad.
OK. I am convinced. Lazear’s claims seem to be unhinged from the data. And his claims seem to be always pro-Republican. So maybe he has given up on economics to become a political hack.
BTW … thanks for links to the StLouis Fed data. Good stuff.
I worry that by comparing recent output gaps to older output gaps, you’re comparing apples with oranges. Output gaps tend to be heavily revised as time goes by. Those in your graphs from older recessions have benefited from more than a decade of hindsight and revision; those from the most recent have not. It is not even clear that the gaps you’re showing capture our best guess of what the gap is.
That doesn’t detract from the messages shown in your other graphs. The results there are at odds with the predictions of many (Rogoff and Reinhart among them) that recoveries after a financial crisis are particularly slow and painful.
I’d be interested to know why you think that is. Do you think recoveries after financial crises are not particularly slow? Is the US economy typically exceptional? Has the recent fiscal/monetary policy mix in the US been particularly skillful? Were interventions to shore up the financial system in the wake of the crisis exceptionally helpful? Something else?
Oh,goodness, Menzie. If you play around with the very link you posted from the last Lazear post, you’ll see that this recovery is indeed worst or second worst since 1948 by most metrics. Comparing it to 2001 is, I think, unfair to both 2001 and 2008. The former was a shallow recession in which pretty much everything had recovered by this point.
By contrast, 2008 was a nasty financial crisis and, I would argue, a nasty oil shock. There is no a priori reason to compare it to 2001; 2008 was much worse.
The more interesting question is trying to determine how 2008 compares against other financial shocks, and frankly, against other oil shocks. So, to my mind, the proper comparisons are against 1929-1937, and 1992 Sweden, and others. Many of the comps are not US.
As for oil shocks, I think the 1979-1983 period is most instructive. High oil prices then squeezed a massive volume of oil consumption out of the economy in a relatively short period of time: 4 bmpd over 4 years. Within this was a relatively short period–mid-1980 to mid-1981–when oil consumption fell with positive GDP growth–similar to what we’re experiencing today.
As US oil consumption will continue to decline–I would expect about a 5% decrease this year–continued GDP growth will depend on a significant decoupling of economic activity from oil consumption. Just how big are these elasticities? Is such a reductionin oil consumption really compatible with sustained GDP growth? And if so, for how long? Just a few months? A year? Several years? No one seems to know, and yet it’s critical for understanding the path of potential and actual GDP.
So, let’s blame 2008 on Bush (and on the Greeks, the Icelanders, the Irish, the Italians, the Spanish, the Portuguese, the British, the Hungarians, and the Baltics; heck, even the Germans and Norwegians facilitated the crisis); and let’s concede that Lazear should have used a qualifier.
But then, perhaps, we might focus a bit more on where we are given that we have encountered a relatively rare form of recession which is now characterized by i) high levels of private debt with deleveraging, ii) high levels of public debt, with continued aggressive leveraging, iii) a highly stimulative monetary policy, which may or may not be reversed depending on how events unfold.
And we have a structural situation in which the OECD countries (lo! the ones in financial crisis) have to reduce their oil consumption to make room for the non-OECD countries (the countries which usually have financial crises but didn’t this time around–because they had better governance?). Is there a linkage between oil and economic performance? A lot of people seem to think so.
Of course, Econbrowser does address many of these issues, and I am grateful that it does. But I’ll concede my interest is more in mechanics than either ideology or blame.
I don’t really wish to defend Lazear, but couldn’t one easily make a theoretical point that the deeper the recession, the steeper the recovery should be? In this case the current recovery, after accounting for the depth of the fall, is extremely weak even though the actual rate of recovery is faster than in the two previous very mild recessions to which it is compared.
Victor Matheson: You could, and if this were a typical recession bequeathed to us by the previous administration, I would agree. But as I mentioned in my previous post, this is not true when the recession is conjoined with a financial crisis and housing bust.
Jeff: I agree that by the output gap level criterion, this is a dismal expansion. But Professor Lazear was making comparisons of growth against a largely irrelevant linear trendline. I merely made that comparison more realistic by comparing against potential GDP. My apologies for using the same metric that Professor Lazear did to demonstrate the fragility of his results; I will refrain in the future.
Steve Kopits: If all recessions are different, then we can’t compare…or maybe we should do regression analysis. Actually, the IMF did in its analysis I cited in the previous post. Which brings me to Simon van Norden‘s excellent question of why recovery was better than might be expected given the confluence of events. I think the particularly aggressive Fed and stimulus package (the latter in particular opposed by almost all Republicans) was part of the explanation, which is consistent with the result in the IMF study.
There is an argument to be made that the great moderation has changed the nature of recoveries.
This is the third recovery since the start of the great moderation and each of the three recoveries followed a very different pattern than previous recoveries. These three recoveries all start out very slowly and gained speed some 3 or so years into the cycle but none experienced extended periods of above trend growth. Moreover, in the first two great moderation recoveries the stronger growth later in the cycle stemmed from what later was recognized as a bubble–the internet and housing. However, in the great moderation the cycles are much longer– a decade as compared to four years.
Two or three consecutive cycles is not really enough to make very firm conclusions, but it is enough to make us consider that the nature of the cycle has changed.
Lizzard is a hack
His term at the council
Pure hackery
I doubt he believed his words then or now
Again Lizzard is acting as agit prop hack
His point
This time
Harry’s crew made the recession worse
I’d hate to see u mr chinn going over board to counter his attack
This recovery sucks
It’s a snail pace recovery
Why ?
Utterly inadequate fiscal stimulus
By which I mean an inadequate combo of spending transfers and tax cuts
Yes recovery paths are in detail an uncertain navigation
But reality …results provide feed back
Since the summer of 09 at least
We knew the arra was inadequate
And yet …
Please don’t blame that only on the GOP
we all have known all we need to know about fast recovery
since at least the mid 40’s
Fiscal policy can pull an economy out of holes a monetary policy can’t push it out of
Not fair to gang with all the commenters,but their doubts are contagious.Shall we try to broaden the variables.
Employment what are the costs?
“Did the stimulus stimulate”James Feyer,Bruce Sacerdote provide for an empirical and exhaustive analysis of the success and less sucessful components of the stimulus.An effective economic contribution for the low incomes,but a Keynesian multiplier between 0,5 and 1 for higher incomes brackets,associated with higher government expenditures.
Above charts should as well be associated with the costs.
Since a multi variables world should be introduced,trading one IMF study against an other, is fair.
The IMF working paper “What’s the damage”is providing for empirical data (40 years time frame), on economic performances after currencies crisis (recorded),banking crisis (recorded)
Fig 1,Fig3,of the same report still need to be reconciled in their finesse, with M. Chinn charts.
What are the cost associated to the previous recoveries.How expensive are the exceptional short recession,what is the cost for feeding the never precedented NBER long recoveries cycles (please see 1982 untill 2007 NBER business cycles).Fed St Louis may assist when looking at the graphs,government expenditures.
How to account for the output gap when the financial components have grown in size?
Unfortunately those comments apply to Europe.
This is a little off topic, but, in comparing this recession to those of the past, not much seems to be made of the fact that a considerably larger portion of the workforce is self-employed. This larger portion is at least in part due to an aversion by employers to W-2 requirements as opposed to those of 1099s. This I suppose mostly a way to avoid health insurance costs by employers?
It seems then, not knowing the numbers, that with most of us who were self-employed but who are now unemployed, being ignored in regards to the unemployment rate, it seems likely that the unemployment numbers are not commensurable to those of past recessions.
What seems to have happened, is that from the 1960s thru the present, the influx of women into the workforce had an obscurring effect on the fact that men were increasingly shifting to sub-contractor or self-employed status. I suspect that economists have kept track of this offsetting affect on the unemployment rate, but… I don’t recall much being made of this in regards to the participation rate?
Menzie: I don’t think that you have demonstrated much of anything. So, let me rephrase.
Your graph and the graphs you’ve reproduced all center on the trough. This temps the viewer into thinking that all recoveries should behave the same–something that is clearly misleading. When you look closer at the Fed graphs you can see that almost three years into the recovery, only retail sales and just recently GDP are back to pre-recession levels. This is something unique to the current recession. So I would hardly claim you have “clearly falsified” the point that the recovery has been sub-par. FYI, sub-par means below average. Your graphs, even as presented suggest that statement to be accurate.
Sorry, Menzie– great colleague and good friend: macro guys are macro guys–us micro guys care about distrribution of gains and losses: the reason this recession is different is the distribution of effects: most of income gain since trough is to capital(rich folks) not labor; most gain in retail sales is amongst highly compensated ; job recovery is much greater for well educated and middkle aged workers than for the undereducated, unskilled and younger worker , etc.. as others have written. Bottom line: this time it is different because of the different distributional effects–not the simila macro effects.
Tim Smeeding: Thanks for the comment! No disagreement that this recovery is different — and less than desirable — for all the reasons you have mentioned. All I wanted to stress is that by the aggregates, measured in a variety of ways, Professor Lazear’s assertions could be easily contested.
To borrow yet another memorable Clinton phrase, Menzie is “attempting to put lipstick on the pig.” Lazear was very clearly not running a horse race against all historical recoveries. That would not make sense since the most recent recession was so much more severe than the previous two. Rather, he was comparing the current recovery to the years following the Great Depression and to the years following the early 80s recessions. In both cases, real growth was significantly above trend. Now, Lazear says, contrast that with the most recent deep recession, in which real GDP growth so far has been significantly below the long term trend. That’s the sense in which he means the current period has been the worst recovery in history. Quibbling about whether it is actually the worst is just missing the larger point.
What we needed to see after 2009 and should have expected to be the goal of macro policy were many quarters of 5-7% real growth and persistent monthly employment increases of 400k+ jobs. We haven’t seen that, which is why the unemployment rate remains so high. As Lazear is implying, if economic performance doesn’t improve it could take many, many years to return to full employment. Thus, he recommends a focus on pro-growth policies rather than a preoccupation with social engineering.
In my view, this is sound advice for Obama and his supporters. People live the numbers, and you won’t get far trying to convince them that what they see every day in their lives isn’t really true. Krugman recognizes the problem and is not trying to gloss over the recent weak economic performance. The problem on Obama’s side is that their preferred solution, further Keynesian stimulus, is a non-starter politically. Obama’s economic staff would be wise to listen to what Lazear is saying and come up with some new ideas. But if they attempt to ignore the problem or convince people it’s not really there, Romney will just need to stay focused, remember Clinton’s example, and keep repeating “Slow growth, no jobs” and Obama will be a one-termer. If that happens, at least Jimmy Carter will be happy. He’s been standing in the corner with a dunce cap on for over 30 years now. I’m sure he’d appreciate passing the mantle.
As I recall JDH once argued that it was important to distinguish the asymmetric response of unemployment to different states of the economy. For example, unemployment during recovery responded differently than unemployment during a mild recession. And unemployment during a mild recession responded differently than unemployment during a severe recession. As I recall JDH was primarily concerned with the “nonreal” financial shocks (viz., the interest rate) affecting the real economy as an alternative to real business cycle theories of only real shocks affecting real variables. Maybe it’s time to rerun his analysis to include recessions at the asymmetric zero bound.
Rick Stryker he recommends a focus on pro-growth policies rather than a preoccupation with social engineering. If that’s what Lazear is recommending, then he’s way off base. “Pro-growth” policies is a euphemism for a focus on supply side real variables, such as positive technology shocks. That’s a really bad idea right now. And since you cited Krugman you ought to know that Krugman thinks such a “pro-growth” supply side approach would actually reduce output because we’re in a liquidity trap, which implies a locally upward sloping aggregate demand curve. If the AD curve is locally upward sloping, then “pro-growth” policies that push out the aggregate supply curve actually reduce total output. Today’s problem is not on the supply side; it’s on the aggregate demand side.
Also, you forgot the most important way in which this recession is different from other deep recessions or depressions. The short term rate is at zero, which means the Fed has very little traction. That was definitely not the case during the Reagan/Volcker recession, and it really wasn’t even true during the Great Depression. Policymakers today are trying to fight a recession with their monetary arm tied behind their back and the GOP holding down the fiscal arm. Given the uphill fight I’m surprised the economy is doing as well as it is.
Rick Stryker I guess I was thrown by the title of Lazear’s piece, “The worst recovery in history.” My apologies.
slug: Upward-sloping AD curves? Increase in AS would reduce output? Even Krugman doesn’t really believe that anymore.
Have you even bothered to look at the charts you posted, Chinn?
Employment and income growth are both clearly and badly sub-par. The economic stats on par with previous recoveries are industrial production and retail sales.
For comparison, here are two historical graphs — Job growth by decade from the 1940s to the 2000s and manufacturing capacity as a function of number of months after the peak of the business cycle in a recession.
Look at these two historical graphs and just try to tell anyone that we’re not in a horribly sub-par economic recovery.
mclaren: I guess I was thrown by the title of Lazear’s piece, “The worst recovery in history.” My apologies.
Just wondering, is the worst recovery on each of the Figure 1 charts the 2001 recovery?
We have so many fundamental issues with our financial system and shadow banking (which is STILL the issue over in Europe, and why they can’t seem to get economic traction), that I think that comparisons to all previous recessions should be void.
This is not necessarily an Obama problem. This is a problem that, like sub-prime housing, has been building over many administrations, both Democrat and Republican. It would be more proper to say that this is a problem of economic and financial experts themselves.
Menzie: As long as we’re going to get picky, let’s revisit your introduction.
‘Lazear’s points are clear: 1) Real growth has been sub-par in this recovery compared to previous recoveries’…
This point is clearly falsified by the graphs
Now, I read that and infer you are attempting to demonstrate that the claim that the recovery has been sub-par (i.e., below average) is clearly falsified. Then you proceed by reproducing figures which show that on certain key metrics the economy has performed below historical averages. So, my apologies if I have misinterpreted you, but it seems to me that the only thing you have demonstrated is that you are capable of even more hyperbolic statements than “worst economic recovery.”
Jeff: You are right. I have apologized to Rick Stryker, so let me repeat my apology, now to you:
Jeff Even Krugman doesn’t really believe that anymore.
Huh? When you post a link isn’t it customary that the link at least support your point? What in that link would lead you to believe that Krugman has changed his mind about an upward sloping AD curve? Do you even understand Krugman’s argument? I’m not asking you if you agree with him, I’m asking if you even understand it. Based on what you’ve shown me so far I’m guessing that the answer is no, you do not understand the argument.
For your edification, Krugman’s argument (which he borrowed from James Tobin) is that in a ZIRP liquidity trap the slope of the AD curve is determined by the net effects of the Pigou and Fisher effects. Normally the Fisher effect dominates the Pigou effect, although both effects are dominated by the interest rate in a non-ZIRP world. A dominant Fisher effect implies an upward sloping AD curve.
See:
http://www.frbsf.org/economics/conferences/1102/eggertsson.pdf
slug: Is it customary for you to assume the author must be confused when you don’t understand the point? Go back and re-read the link and see if you think that’s something a person who believes we’re in an environment with upward-sloping demand curves would write.
Jeff Judging by your reply I take it that you do not understand Krugman’s argument. The key to the slope of the AD curve is whether we’re still in a ZIRP liquidity trap, not whether there was relatively good economic news two months ago.
Slug: You have still missed the point of the comment.
Let us define recovery as the initial two years of positive growth coming out of the trough. The data clearly show this recovery to be the worst of the postwar period. The prior Bush recovery was 2.6% and this one 2.5%. With 95% confidence, the minimum to have expected was 3 ¾% growth based on statistical evidence using the cumulative drop in inventory investment as a percent of GDP from peak inventory quarter to the trough quarter of the recession, along with the merchandise trade deficit as a percent of GDP at cycle peaks. Sixty percent of the variation in recovery growth rates is explained by the inventory cycle, and the amount of variation explained gets upped to 88% by adding the trade deficit variable.
The question then gets reframed more scientifically. Why has this recovery fallen short of the most conservative a priori expectation by one and one-quarter percentage points? To what variables do we apportion the shortfall? The leading candidate is surely the dual causal variable of lost housing wealth in conjunction with the limitation on consumer spending and new home construction imposed by households having to deleverage to get back to their comfort zone. Comfort zone is where a household has a confident enough income flow to cover principal, interest, taxes, and insurance on its home mortgage, and on other household debt. Call this dual causal variable the credit crisis variable.
Given historic low interest rates (all the liquidity in the system) and historic fiscal stimulus as a percent of GDP, there is every reason to expect recovery growth to have been even greater than the minimal expectation of 3 ¾%. Hence there is abundant room for a slew of other explanatory variables in addition to the dominant credit crisis variable. Lazear offers such a list: “Threats of higher taxes, the constantly increasing regulatory burden, the failure to pursue an aggressive trade policy that will open markets to U.S. exports, and the enormous increase in government spending all are growth impediments. Policies have focused on short-run changes and gimmicks—recall cash for clunkers and first-time home buyer credits—rather than on creating conditions that are favorable to investment that raise productivity and wages.” To these I would add one more variable: the broken monetary transmission mechanism which the Federal Reserve could do something about but has not. Specifically, second-tier banks and credit unions are being regulatory capital constrained by the regulators. Prudentially-run banks should be permitted for some set period of years to hold less capital against assets, not the (effectively) more that has been the case since the financial crisis, so that they are psychologically more disposed to make loans.
Framed this way, the task of economic science is to disentangle the causal contributions of all these variables to show in a quantitative (scientific) way the absolute and relative contributions of each. This is a mighty big task, in the first place because there are only 9 prior postwar recessions and recoveries (ignoring the anomalous 1980 recession/aborted recovery). That is all too few observations, but it is what we have to work with. Even more daunting, for some variables (like regulatory burden) there is no well-measured time series of the same concreteness as, say, GDP.
Nonetheless, this is the task. And once the proper question is asked (the problem properly framed) answers will be forthcoming that iterate closer and closer to the underlying reality. It is a credit to Lazear and Econbrowser, no matter the ideological backs and forths, that the foot has at least been dipped in the water. And high time. Conventional policy prescriptions are a limited two-pony show – monetary and fiscal. More broadly, the fuller gamut of prescriptions being bandied about resembles the aimless flopping of a beheaded chicken. No surprise that post-recovery growth is floundering below that of the recovery phase. It will continue to do so until hypotheses on the above variables are statistically accepted or rejected to give sounder basis to what policymakers “really” should be doing.
” It will continue to do so until hypotheses on the above variables are statistically accepted or rejected to give sounder basis to what policymakers “really” should be doing.”
Or we can see it primarily as a balance sheet slowed recovery. There is no real policy to be generated by the government that can fix this. We are temporizing while people rebuild their savings. Other issues like regulations are important long term factors, but in the short run they are secondary.
Steve
Comparing the 2001 recession and 2002-2003 recovery to the 2008-9 recession and 2010-2011 recovery is ridiculous. This is because the Bush administration cut taxes and handed out stimulus checks almost immediately and the Federal reserve cut rates drastically in such a short period of time that 2001 recession barely registered as a recession at all (only two non-consecutive quarters of negative GDP and even then it was only -1% on an annualized basis). Much of the economic data continued to deteriorate or be very weak until very early in 2003 even with all that stimulus.
So had the Bush administration and Fed did a little less, than maybe we would have had a decent recession that stretched well into 2002. And in that case you would have had a real recovery. But what happened was more of a growth recession from Q2 2001 until Q1 2003, with most of it being very ridiculously registering as a recovery. This is just not an apples to apples comparison vs the 2008-2009 recession and 2010-2011 recovery.
There are many who have equated the austerity in the UK with attempts in the US to reduce wasteful spending. But those same people are seeing recovery since the voters returned the Republican control of the House of Representatives.
Here is an interesting graph on government spending.
Isn’t it interesting that the voters fired the Republicans from the House and Senate we have faced economic decline. Isn’t it also interesting that during the strong economic years of the Clinton administration the Republicans controlled congress. Hmmmmmmmm.
These charts are devastating to Obama’s re-election case.
Lazear is clearly out of lunch, particularly his subsequent even stronger (and more bizarre) claim that the causes of the 1981-2 recession and the more recent 2007 recession are identical.
But just because Lazear is spewing flagrant counterfactuals, that doesn’t make Chinn’s claims that this recovery is not sub-par correct.
As for Darren’s assertion that “these charts are devastating to Obama’s re-election case,” I don’t see the support for that. Instead, the most parsimonious explanation for these charts is the one proposed by Tim Duy — anomalous capacity shrinking in American manufacturing:
Another interpretation is that US firms have no intention of adding net new capacity, planning instead to source any excess demand from overseas. This implies that the manufacturing recovery will not be a net positive to US growth. It also implies that the trade deficit will widen further and that the challenge of global imbalances will remain unresolved. The rise of Dollar assets abroad will with either force a fall in the US dollar which would then create more incentive for export and import-competing industries or, more likely, encourage the accumulation of reserve assets among foreign central banks.
In short, I continue to worry that policymakers are ignoring the possibility that increasing reliance on external production to satisfy US demand has contributed significantly to the jobless recoveries we have seen this decade. Something is very different this decade. I think it is a mistake to write off this decade’s shift in manufacturing as simply a repeat of the agricultural experience. At least agricultural output continued to rise as its relative employment importance fell. The capacity numbers are telling us the same can not be said of manufacturing any longer. And in the past, the relative decline in manfacturing jobs was matched by a more than corresponding increase in service sector jobs. No longer the case; job growth is flat for a decade. If we intend to ignore this issue, the supposed reality of tradable services had better get a lot more traction very quickly. Otherwise, we are further solidifying a permanent underclass of citizens who require the constant support of fiscal authorities.
This trend will continue to hold regardless of who is president. This combination of strong GDP growth + healthy gains in industrial production along with constantly declining employment and dropping real incomes looks like “the new normal” from now on. The simplest interpretation of these charts is that American businesses have chosen to take advantage of the recession to permanently offshore manufacturing and/or automate services that previously required human workers courtesy of AI + databases + computers + the internet.
This explains why U.S. GDP has grown at a rate comparable to other recoveries from recessions, while employment hasn’t. Retail sales to the top 20% are still strong and industrial production (now increasingly offshored or automated) is fine: what isn’t fine is the consumer’s buying power because the offshoring + auomation is eroding the American middle class. That’s why U.S. employment and real income remain distinctly sub-par by comparison with other post-WW II economic recoveries.