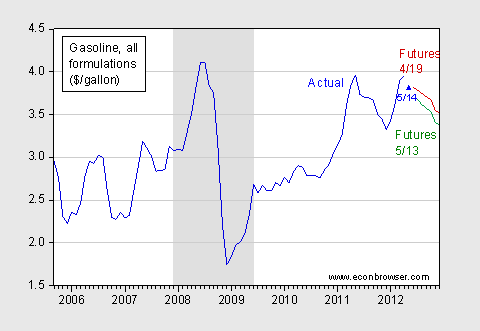
Downward, and downwardly revised.
Following up on this post several weeks ago, it seems that futures prices are confirming downward movements in gasoline prices. A simple bivariate regression using the lagged log futures price and log gasoline prices (all formulations) yields the following estimates:
(1) pgast = 0.514 + 0.719 × fgast-1 + ut
Adj-R2 = 0.97; SER = 0.034; DW = 1.90; smpl = 2005M11-2012M03; n = 77
Using this relationship, and the futures prices as of April 19, one can infer the path of future gasoline prices, and for May 13. I show the result in Figure 1:

Figure 1: Actual price of gasoline, all formulations, $/gallon (dark blue), and gasoline prices implied by futures as of 4/19 and equation (1) (red), and as of 5/13 (green). May observation is for 5/14 (blue triangle). NBER defined recession dates shaded gray. Source: ino.com, St. Louis Fed FRED, NBER, author’s calculations (see text).
I think prices will continue to weaken–due to a weak global economy.
The more interesting analysis, I think, is gasoline prices and re-electability. (I’m sure that’s a word.) Use gasoline prices versus presidential approval ratings, allow for lags, and see what it tells us about November.
Damn speculators.
http://www.levin.senate.gov/newsroom/in_the_news/article/speculators-are-driving-up-gas-prices-hurting-american-families
Threats of reserve release worked.
As Steven noted, we are seeing a demand response, but not much of a supply response.
Annual global (Brent) crude oil prices doubled from $55 in 2005 to $111 in 2011, with some fluctuations along the way.
In response, we have seen the following on the supply side:
EIA data show that global crude oil production has been virtually flat since 2005.
We have seen a small (0.5%/year) rate of increase in total liquids production, inclusive of low net energy biofuels.
However, our data base shows a material decline in Global Net Exports* of oil (GNE) and in Available Net Exports of oil (ANE, or GNE less Chindia’s net imports).
Buy my principal point is that in my opinion we are only maintaining something resembling Business As Usual because of a sky high depletion rate in the post-2005 cumulative supply of GNE and in ANE.
Based on extrapolating the 2005 to 2010 data, the estimated post-2005 cumulative GNE and ANE depletion rates for 2005 to 2010 were 5%/year and 10%/year respectively. The depletion rate is the rate that we consume a resource.
Based on a model and several case histories, and based on extrapolating the 2005 to 2010 data, I am estimating that about half of the post-2005 cumulative supply of Global Net Exports of oil will have been consumed by the end of 2020, and I am estimating that about one-half of the post-2005 cumulative supply of Available Net Exports will have been consumed by the end of next year, 2013.
*BP + Minor EIA data, total petroleum liquids, top 33 net oil exporters in 2005
The best leading-concurrent indicator of crude oil prices is the CRB: Raw Materials Index and it has fallen about 3% so far this month, suggesting that oil prices have not yet bottomed.
I personally think it is a better leading index of oil prices than the oil futures market.
I expect the gasoline market this year to look exactly like it did last year: spike in the spring, declining prices throughout the year.
It seems like every time we get better than expected economic news, gasoline prices spike, which dampens economic growth. It is kind of like gasoline prices are controlling the economy, not the other way around.
Exactly, Buzz.