Given several prominent policymakers have worried about central bank actions leading to high inflation, (e.g. Representative Ryan) it seems reasonable to see how expansions in central bank balance sheets correlate with inflation.
These are four figures from a set of slides compiled by Torsten Slok at Deutsche Bank.
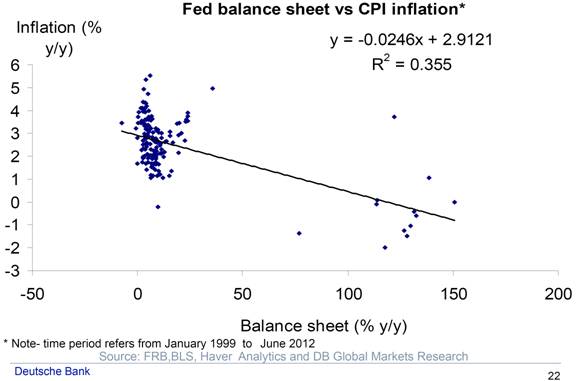
Figure from Torsten Slok, “Under Which Conditions Will Fed Money Printing Create High Inflation?” Deutsche Bank (July 2012). [not online]
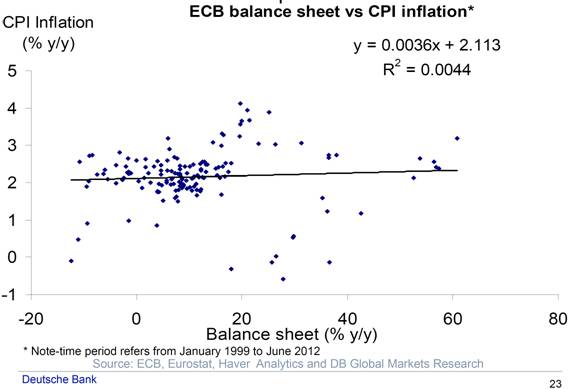
Figure from Torsten Slok, “Under Which Conditions Will Fed Money Printing Create High Inflation?” Deutsche Bank (July 2012). [not online]
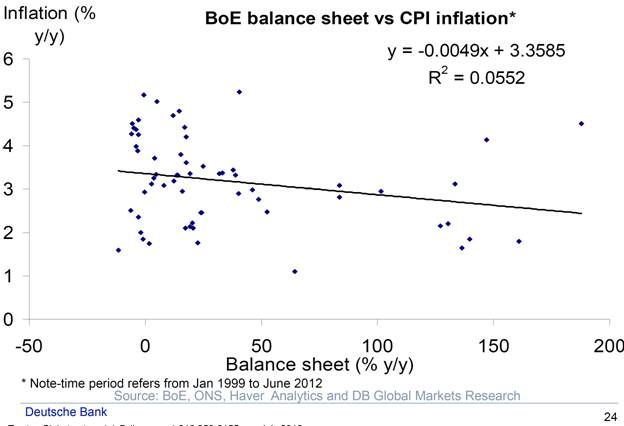
Figure from Torsten Slok, “Under Which Conditions Will Fed Money Printing Create High Inflation?” Deutsche Bank (July 2012). [not online]
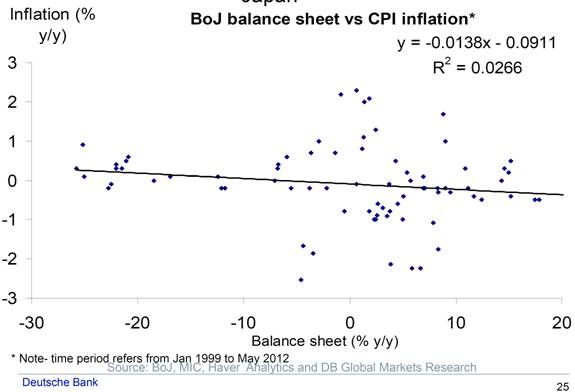
Figure from Torsten Slok, “Under Which Conditions Will Fed Money Printing Create High Inflation?” Deutsche Bank (July 2012). [not online]
The first figure is an update on the figure I plotted a year and half ago [1]. I will leave readers to see if they can discern a strong and positive correlation.
Update, 8/14, 8am Pacific: Several comments argue for lags, etc. As I indicated in the post, the first figure updates one I generated in link [1] (apparently those commenters did not follow the link). Different lags, and different “best fit” lines (including “smoothers”) are shown there. Correlations with a different monetary aggregate here.
If you think this is evidence for anything, then why aren’t you calling for a complete cessation of Fed activity/a balance sheet contraction? Given the negative correlation, it implies higher inflation rates.
Or this in’t evidence. Only one good macro paper showed correlations and correlations alone.
Whats the time lag between CPI and Balance Sheet expansion that you use?
At first glance:
1. No lag?
2. These look like quarterly observations over 13+ years. Quarterly inflation shows substantial serial autocorrelation.
3. Causality runs which way? (Great Recession causes low inflation and low interest rates, allowing Fed, ECB, BoE, etc. to blow out the balance sheet?)
In “The Unreliability of Inflation Indicators”, inclusion of M2 did increase the precision of inflation forecast. The other point is not so much the size of the Fed balance sheet as what the money is used for specifically if it ends up going into actual loans and economic activity. Otherwise, yes agreed “nothing to see here, move on please”.
http://www.adsanalytics.com/dashboard/docs/dashboard.php?treepage=tree_definition_main.php&chart=chart_m
Why did you choose the timeframe that you did? Two bubbles and two recessions?
Hmm,
You are suffering from correlation/causation confusion.
I agree with your premise. Balance sheet expansion will not lead to inflation.
BUT
you call this empirical evidence? 1999-2012? are we 2nd year college students?
Menzie, would you actually draw the top line as it is? This is a statistics question. Whatever fit was generated links together a bunch of data that has no meaningful relation. I have similar questions about the ECB line and more about the BofE line but the Fed one leaps out.
I believe that you have causality in the wrong direction. It’s not that enlarged balance sheets lead to inflation, but rather deflation leads to enlarged balance sheets. Reversing the causality would make sense out of the regressions.
By Christopher Johnson
LONDON | Tue Aug 14, 2012 8:29am EDT
LONDON (Reuters) – Oil prices are racing higher as investors bet that central bank cash will soon boost a market afraid of Middle East war and worried about North Sea supplies, but the rally looks increasingly inflated by speculative guesswork.
Oil is up almost a third in six weeks at a time when the world economy, and hence fuel demand, are extremely weak.
Today’s oil price assumes the U.S. Federal Reserve will soon launch a new round of quantitative easing to stimulate the economy, or that bellicose rhetoric between Israel and Iran will lead to conflict, or that North Sea production problems will be long-lasting.
But none of these factors is a safe bet and if they were removed, the price of oil could fall quite sharply.
“The market is decoupling from fundamentals,” said Carsten Fritsch, an analyst at Germany’s Commerzbank in Frankfurt. “Much of the strength is based on factors – such as more U.S. economic stimulus – that are far from guaranteed.”
Brent crude oil hit $115 per barrel on Monday, its highest for three months and up 30 percent since the end of June. Oil hit an all-time high of $147 in mid-2008 just before the onset of the credit crisis, which sent prices down to $36 just six month later.
Menzie,
It appears that many here have noticed the same thing where you seem to have an agenda and choose your data to prove your agenda. This is not economic analysis but advocacy.
This is my primary concern with econometrics. Econometrics is great if it is used as an unbiased test to prove and develop theory, but econometrics have become either a political tool or simple Sudoku to entertain those who simply enjoy calculation.
Serious analysis is impartial.
See update: Several comments argue for lags, etc. As I indicated in the post, the first figure updates one I generated in link [1]. Different lags, and different “best fit” lines (including “smoothers”) are shown there. Correlations with a different monetary aggregate here. I would be much obliged if anybody thinks the story changes dramatically with these robustness tests, and if so why. If you generate graphs that prove your point, I would be happy to consider posting, as long as proper documentation is provided (and the underlying data, so I can replicate, and subject to robustness tests).
compare balance sheet expansion to the price of gold and the correlation becomes clear.
Menzie
How about a similar chart for the FED balance sheet vs employemnt growth.
Ryan should have said that the FED can do whatever it likes because it’s actions have no impact on inflation and employment growth.
Sharing Ricardo concern,strange reasoning since the domain of definition of inflation is not the same for all countries represented in the graphs ploted.
With the same good faith one may read the Philipps curve and conclude that since unemployment is high inflation is low.
I’m with efh here. I don’t really see what is supporting oil prices at these levels. It’s not 2008, though. Demand was strong then, supply was weak. Now it’s easier to argue the reverse.
Investors are either banking on a general rally, significant monetary easing, or supply constraints. I’m not sure I agree with any of these, albeit Iran remains a wildcard.
It’s not about proving anything to anyone, for Prof. Chinn simply throwing mud at people he dislikes is pleasure enough. The only way he would have been any happier is if he could have used a log plot.
D.F. Linton: Please specify what mud has been thrown. I didn’t cast any aspersions on anybody. I merely plotted some data (actuallly, posted graphs plotted by someone else).
Steven and efh,
There is certainly a component of the oil price that is driven by world events but the price of oil is not really historically high if adjusted by almost any inflation adjustment. If the world economies recover and the money supply levels are maintained WTC could comfortably rest in the low $100 range. If the price of oil drops anywhere close to $36/bbl it will mean a serious economic decline and deflation.
Ricardo –
Our estimate for the carrying capacity of the US–the oil price at which oil consumption begins to decline–is $95 Brent. For China, it’s $115 Brent. The price of Brent today is $115, well above the OECD carrying capacity and right at the limit for China, by our estimates.
At the same time, the oil supply is up 1.9 mbpd (about 2%) in the last year. If the advanced economies cannot hold oil consumption and the emerging economies at best can barely grow consumption, where is the incremental supply going?
Something’s not right. Our estimates may be wrong, there may be supply-demand dynamics I don’t see from last month’s data, or the current oil price is not sustainable. Best guess: The oil price is not sustainable.
The regressions square with common sense. If GM issued 10% more stock and sold it for 10% more assets, then that ‘expansion of the balance sheet’ would have no effect on the price of GM stock. Similarly, when central banks issue 10% more money, they normally get 10% more assets, and the value of the money is unchanged.
Menzie Okay, I give up. Almost everyone here seems to think they see some significant relationship in the regression line. Looks like nothing to me. It’s not even a spurious relationship…just not any relationship at all. All I see is an R-square statistic that tells me zero percent of the variation in the dependent variable is explained by the independent variable. What am I missing that others are seeing?
Steven,
Good questions, thanks.
First, I do not see that you have considered the monetary component of the oil price. As a commodity the more money in circulation the higher the price.
Second, your supply and demand metrics are using todays recessionary demand as your baseline. You seem to be judging your demand only on price. Oil demand is much more dependent on economic activity than on price. As I stated if the world economies begin to recover demand will spike up. New supplies of oil cannot be developed quickly so there will be a sudden shortage. The situation will be similar to that of the early 2000s when sudden demand caused the price of oil to shoot up much higher than its monetary situation would have forecast.
As you know there is less than a 30 day supply held on hand. If demand increases significantly that 30 day reserve can be quickly depleted causing a spike in prices.
Actually your estimates and mine are not that far apart. You are at $95 and I am at $105. That is why I said it could settle in the low $100 range.
The price of oil is being depressed because of an expectation of weak demand because of the economic malaise.
If the Central bank uses IT as his policy regime this is exactly what you would find. The Central Bank expands or reduces its balance sheet to offset shocks to the economy and stabilize its inflation rate around the inflation target.
I think this analogy made by Nick Rowe is perfect to illustrate what I am trying to say.
“Everybody knows that if you press down on the gas pedal the car goes faster, other things equal, right? And everybody knows that if a car is going uphill the car goes slower, other things equal, right?
But suppose you were someone who didn’t know those two things. And you were a passenger in a car watching the driver trying to keep a constant speed on a hilly road. You would see the gas pedal going up and down. You would see the car going downhill and uphill. But if the driver were skilled, and the car powerful enough, you would see the speed stay constant.
So, if you were simply looking at this particular “data generating process”, you could easily conclude: “Look! The position of the gas pedal has no effect on the speed!”; and “Look! Whether the car is going uphill or downhill has no effect on the speed!”; and “All you guys who think that gas pedals and hills affect speed are wrong!” (http://worthwhile.typepad.com/worthwhile_canadian_initi/2012/07/why-are-almost-all-economists-unaware-of-milton-friedmans-thermostat.html#more)
PS: english is not my native language, so if there is any mistake I apologize.