The price of Brent crude oil fell $35/barrel between April and June. But increases this summer have taken about $25 of that back.
|
The increase in crude oil prices also wiped out most of the gains realized by American gasoline consumers this spring. Here in California, the gasoline price spike back up has been significantly bigger than the national average due to a fire at a major San Francisco Bay refinery.
|
|
| New Jersey Historical Gas Price Charts Provided by GasBuddy.com |
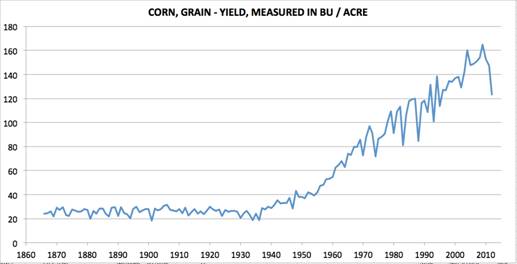
In coming months, these developments may offset some of the recent softness in U.S. inflation. Another contributing factor to that could come from the big drop in corn production resulting from drought in much of the U.S., which will matter for both food and fuel prices. Hopefully those problems will at least provide new momentum for repeal of the ethanol mandate.
|
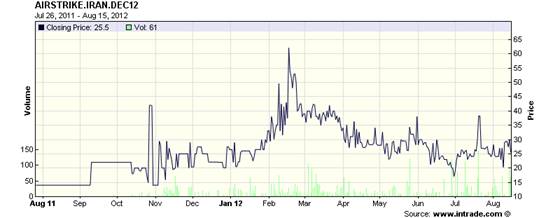
What’s behind the rise in the price of Brent? Some financial reports have stressed rising tensions with Iran. However, one objective, if imperfect, quantitative measure of that comes from the market price of Intrade’s contract for an imminent attack on Iran. This has moved relatively little since April.
|
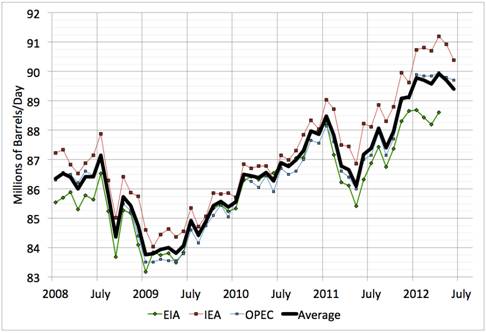
Another reason may be that total world oil production (including natural gas liquids and biofuels) has been stagnant since January, though at a level 3-1/2 million barrels/day higher than during the Libyan cutbacks in 2011, and 2 mb/d above the pre-Libyan peak in January 2011.
|
I believe that the most important factor driving oil prices recently has been changing assessments of how strong the world economy will perform over the next 6 months. The decline in oil prices in April-June and the subsequent rebound is mirrored in stock indexes like the S&P500. A stronger economy should mean both higher corporate profits and higher demand for oil. Markets are apparently betting that favorable economic trends in places like the U.S. and China are enough to outweigh the discouraging numbers coming out of Europe.
|
Whether markets have that right remains to be seen.
I found this interesting comment while scanning my daily sites: ” In 2006, President George W. Bush was wrong when he said we were addicted to oil. The real truth is, oil, and other carbon-based fuels, are merely the affordable means by which we can satisfy our true addictions – long life, good health, prosperity, technological progress, adequate food supplies, internet services, freedom of movement, protection from environmental threats, and so on. As I’ve said numerous times after living in Africa, – without energy, life is brutal and short.”
It is from here: http://www.drroyspencer.com/2012/08/fun-with-summer-statistics-part-2-the-northern-hemisphere-land/
big drop in corn production resulting from drought in much of the U.S., which will matter for both food and fuel prices.
In the short run the bad corn crop has (and will have) the effect of temporarily reducing food prices as farmers kill off feeder cattle and lean hogs. Over the medium to long run livestock and broiler prices will go back up. But there is good news for Mayor Bloomberg…high fructose sugar will make those jumbo drinks even more expensive.
JDH wrote:
I believe that the most important factor driving oil prices recently has been changing assessments of how strong the world economy will perform over the next 6 months.
Steven Kopits,
It appears that the Professor and I make the same assessment.
“Markets are apparently betting…”
Isn’t this evidence of “speculating”?
The key from an inflation point of view (which seems to be dominating conversation at the moment), of course, is the extent of the pass-through of commodity prices into inflation: our sense is that since the mid-1980s this has been negligible. Although a variety of competing explanations have been put forward—including the declining share of oil in US production and increased flexibility in wage setting, improvements in the credibility of monetary policymaking are the compelling reason. As inflation expectations have been very stable in recent years, second-round effects of oil price increases via the wage-setting process are small.
Crude example below:
http://www.adsanalytics.com/dashboard/docs/dashboard.php?treepage=tree_definition_main.php&chart=chart_infl_crudeppi
ADS
A fair amount of the recent increase in Brent is likely due to the decrease in production at the North Sea Buzzard field, see John Kemp’s explanation at Reuters:
http://www.reuters.com/article/2012/08/09/column-kemp-oil-nsea-idUSL6E8J980Y20120809
And
http://www.reuters.com/article/2012/07/17/us-column-kemp-oil-brent-idUSBRE86G0KS20120717
Ricardo –
I don’t dispute Jim’s assessment–I am largely aligned with it. But $115 is a high price notwithstanding. Year on year and month on month, US consumption is down. China is up, but only back to where it was in January. Can China ramp ups its oil consumption growth above $115? It wasn’t able to last year.
There is also significant disparity in forecasts. The STEO is flat for 2012, but some private forecasters are above 2 mbpd increase.
And, yes, Anon, it is speculating in the sense of anticipating a stronger market; but it is not price manipulation. In July, there were net inventory draws of 440,000 bpd, ie, demand was running ahead of supply.
The average annual price of Brent rose from $55 in 2005 to $111 in 2011, with one year over year decline, in 2009. Average to date for 2012, through July, is $112.
Annual global crude oil production stopped increasing in 2005. We have seen a small (about 0.5%/year) rate of increase in annual total liquids production, inclusive of low net energy biofuels.
But Global Net Exports of oil (GNE), based on our data table for the top 33 net oil exporters in 2005, fell from 46 mbpd in 2005 to 44 mbpd in 2011.
Available Net Exports (ANE, or GNE less Chindia’s Net Imports) fell from 40 mbpd in 2005 to 35 mbpd in 2011.
Note that six of the major net oil exporters in 2005 (those with 100,000 bpd or more of net exports) were net importers in 2011, or they had fallen below 100,000 bpd.
In other words, we lost an average of one major net exporter per year from 2005 to 2011.
In my opinion the dominant trend we are seeing is that the developing countries, led by China, are consuming an increasing share of a declining volume of Global Net Exports of oil.
Both the future and current price of oil and other fossil fuels will go down as the news about already developed “cold fusion” (LENR) devices spread.
This post fails to mention that global crude oil markets were over supplied to the tune of 2.5mm bbls/day in H1 2012.
Not sure about that — if you look at SPX sectors relative you find the oil sector has been the strongest driver of the rally since June, while indicators of economic sentiment (e.g. consumer discretionary vs consumer staples) suggest weakness. Looks to me like oil is fundamental and Israel/Iran is the reason.
Steven Kopits,
Understood.
I think it is a difference between demand theory analysis and supply theory analysis. Does the price determine the supply or does the supply determine the price? Keynesians would manipulate the price to determine the supply but as both you and the Professor note it is acutally economic activity that determines the supply not price. Supply actually determines the price contrary to what those who misquote JB Say would postulate.
Looking at the long term chart of oil, one may detect a long formation of a head and shoulder.On one year horizon it exhibits the slow formation of a double top.
One may have missed the heating oil price uptrend as it is now going into a double top formation.
One may still miss the long standing requirements for a coherent update on progresses made on Banks regulations,balance sheets and profit and losses updates,derivatives weighing,causes and causations of this great recession.
One should not forget that central Banks are carrying 18 trillions USD assets on their balance sheets and steadfast counterparties in derivatives are needed.
The reforms required may fall into the category of the “great gestation”,nine months for the human being,twenty one months for the elephants and still looking for the related specy at the chapter 60 months.
Jeffrey Brown, carrying on the conversation from the Japan discussion, I stated that the Japanese are quite worried about the future supply of energy and in passing mentioned that they were checking out methane hydrate. You responded that there are no commercial methane hydrate operations. But I was not disagreeing with your assessment of Japan. I was pointing out that it is worried and desperately seeking alternative sources.
The Germans developed a process to make fuel from coal when they were cut off from oil supplies and South Africa made coal to liquids into a lifeline during the sanctions period. I don’t know whether Japan can tap its domestic methane hydrates. But it will try.
DOE is also looking at methane hydrates. You can follow its work here: http://www.netl.doe.gov/technologies/oil-gas/futuresupply/methanehydrates/newsletter/newsletter.htm
Check out “Ignik Sikumi Gas Hydrate Field Trial Completed”: http://www.netl.doe.gov/technologies/oil-gas/publications/Hydrates/Newsletter/MHNews_2012_June.pdf#Page=1
There is a video discussion here: http://www.netl.doe.gov/technologies/oil-gas/FutureSupply/MethaneHydrates/rd-program/ANSWell/co2_ch4exchange.html
The Japanese are partners in the DOE experiments.
Of course all fossil fuel supplies are finite over the long run. However it seems that only in the area of motor fuel is the substitution effect discounted.
One thing that strikes me about your position is that whenever someone points out alternatives you minimize them so as to keep validating your predictions on oil and economies. For instance, you mention the depletion rates of wells in Texas. But energy company estimates of total shale gas resources take into account the known depletion rates. They also take into account the huge total area of untapped shale gas resources.
To get to the truth, follow the smart money. ExxonMobil is known for choosing the most profitable investments in the industry. Its purchase of XTO Energy and its decision to build a major chemical complex in Texas clearly show that it sees decades of profit from shale gas.
http://www.reuters.com/article/2012/06/01/us-exxonmobil-plant-idUSBRE85002W20120601
Ricardo –
Right. There are supply-constrained models, my speciality, and demand-constrained models, which represent normal supply-demand modeling. It’s quite rare for a good to be supply-constrained, therefore it’s not an approach that analysts typically use.
Let me give you an example: In 2005, CERA predicted that the oil supply in 2010 would be 100 mbpd. It didn’t even reach 90. Why the mistake? Because CERA made a demand forecast, which suggested that global demand would be 100 mbpd in 2010. This was in fact correct! So CERA figured the supply would adjust accordingly. Notwithstanding, the supply stalled out and posted very little growth in the second half decade. As a result, the increase in demand didn’t show up in barrels, it showed up in price. (In all fairness to CERA, I would have made exactly the same mistake at the time.) So for demand-constrained forecasting, you’re solving for volumes; in supply-constrained forecasting, you’re solving for price. This is why you’ll often see me referring to the notion of “carrying capacity” and “inherent demand”. These have no meaning is demand-constrained forecasting, but are essential concepts in the supply-constrained variety.
****
In oil, price determines the supply. When oil prices are high, companies invest. When prices are low, they hold back.
Now, in a supply-constrained model, the price can be well above the signal price (the incentivizing price)–just as it is today. If the oil price fell to say, $80, the incentive to produce would hardly be less. And if it rose to $150, there would be no more activity than there is now. The industry is running flat out as it is.
The binding constraints are either geological (North Sea), political (much of OPEC) or organizational/asset-linked (Brazil). Price is not currently a binding constraint on production.
If the oil supply were sufficiently elastic, then you’re right, supply would drive price–as we see with US shale gas. As it’s not, the price of oil drives such supply response as the industry can muster.
@Freude Bud: All oil is going up, not just Brent. The Buzzard field outage is lopping about 200,000 b/d off Forties production in September. But don’t forget that the US is running nearly 500,000 b/d less Nigerian crude this year than last, and most of that has been going to Europe. There’s also 1.4mn b/d of Libyan production around now that wasn’t here last year.
Crude has been going into storage this year, and it’s not being refined, by and large. An odd situation, given that backwardation is prevalent in almost every oil market (excepting WTI, of course). There may have been a fair bit of precautionary stockbuilding going on before the Iran sanctions came into effect. It looks like some of the crude surplus is beginning to move downstream, though.
@Anonymous: Of course that’s the same as speculating. You say it like it’s a bad thing.
I won’t support the repeal of the RFS unless it’s explicitly tied to an actual good policy. That is the exact opposite of what most in Washington are encouraging. The current lobby in Washington’s line is to repeal and leave it behind. The AFPM (nee NPRA) and API are frothing at the mouth for a “free market” solution that doesn’t take into account their CO2 emission externality. Ed Dolan is right, repeal and replace is a good idea, but keeping the RFS around, inefficiencies and all, is better than letting carbon polluters have a free ride.
@Down With This Sort of Thing
Actually, crude has been coming out of storage in the US for the last couple months, though on a year over year basis stocks are quite high. They’ve been drawn down on in quite large numbers, see:
http://www.eia.gov/oog/info/twip/twip.asp
Also, although WTI and Brent are decoupled, there is some piggybacking going on, I’d think.
Re: colonelmoore
I think that the key phrase is an incremental difference versus a material difference.
For example, increasing annual natural gas production from the Barnett Shale, through 2011, made an incremental difference, but not a material difference in total Texas natural gas production, since total Texas natural gas production has been declining since 2008.
Texas has the longest recent history with intense, modern drilling and completion efforts in shale plays.
So, here’s the question:
Why would Texas natural gas production, and our experience with shale gas plays, not serve as a model for total US oil and gas production?
Down With This Sort Of Thing @Anonymous: Of course that’s the same as speculating. You say it like it’s a bad thing.
I don’t care whether it’s a good or bad thing. It’s just that in a couple of previous posts the existence of speculation in the oil market has been soundly rejected and anyone suggesting otherwise been exposed as a fraud (https://econbrowser.com/archives/2012/07/guest_contribut_21.html). And then I read “Markets are apparently betting…”, and it occurs to me… wait a minute that sounds like casino language…
Anonymous: As I explained here:
To clarify slightly, regarding the Texas natural gas data, I am relying on one data base, the Railroad Commission, for both Barnett Shale production and for total Texas natural gas well production.
Steven Kopits,
I am enjoying this discussion, btw.
I do agree that production does react to price. That was the cause of the massivee decline in production at the end of the 20th Century with this shortage being the primary cause of the huge run up in prices in the beginning of the 21st. But the run up in price was a reflection of the response to demand.
If the world economies recover there will be a huge demand for oil and companies will respond. I do not agree that there would not be increased production if oil went to $150/bbl.
In my recent trip to Colombia I saw first hand their production. If the land owner in Colombia owned the oil under his land Colombia would be producing twice as much oil as it is. My Colombian friend had a farm that was sitting on and oil reserve. In the US we would consider him rich because of this. For him the oil is a slight bit of a nuisance. The government owns the oil and only pays him a small rent for a plot of land where the pump station is located. I told him that in the US the oil is owned by the land owner who pays a tax and he said if he owned the oil he would drop 5 wells.
Government ownership of oil destroys the incentive to produce. The land owner only receives rent at most. The government workers who transport the oil are paid a salary no matter how much they produce, as are the refiners or shippers. When payment is received for the oil it goes into the general government fund and only the politicians benefit, but even they are looking a total revenue without very little incentive to improve their oil production. There is a reason that over half of the oil wells in the world are in the US.
If businesses become starved for oil they will make sure there is production. There will be incentive to produce.
As a commodity oil production is based on price but the price is determined by other productive activity. Oil is essentially a raw material. If there is no production in the economies of the world generally there will be no demand for oil and the price will drop leading to reduced production. But an increased money supply does not increase production but only price. That is why you can say that $150/bbl oil will have less of a production incentive today than it would have had in 2000.
I think we may be talking about different production.
Some specific numbers for Texas natural gas:
Here are some recently updated (late July, 2012) Texas RRC data for Barnett Shale natural gas production and for total Texas natural gas well production (note that we are using a common data source).
From 2008 to 2011, the RRC (so far, subject to revision) shows that Barnett Shale gas production increased by 20%, from 4.4 BCF/day in 2008 to 5.3 BCF/day in 2011:
http://www.rrc.state.tx.us/barnettshale/NewarkEastField_1993-2011.pdf
However, this increase was not sufficient to keep total Texas natural gas well production on an upward slope, and we have (so far) seen three straight years of declining Texas natural gas well production, with annual Texas gas well production down 6.1% from 2008 to 2011, from 19.3 BCF/day in 2008 to 18.2 BCF/day in 2011:
http://www.rrc.state.tx.us/data/production/ogismcon.pdf
In other words, the data show that several years of year over year increases in Barnett Shale gas production could not keep total Texas natural gas well production on an upward slope (using a common data source).
However, my primary point, as noted above, is that the data show that the dominant post-2005 trend we are seeing is that the developing countries, led by China, have been so far been consuming an increasing share of a declining volume of Global Net Exports of oil (GNE).
The following link shows the ratio of GNE to Chindia’s Net Imports of oil (CNI) from 2002 to 2011, versus total global public debt:
http://i1095.photobucket.com/albums/i475/westexas/GNE-CNI_total-debt_PS1.png
The ratio fell from 8.9 in 2005 to 5.3 in 2011, a decline rate of 8.6%/year. At a 1.0 ratio, the Chindia region alone would theoretically consume 100% of Global Net Exports of oil.
Meanwhile, the Economist Magazine shows that total global public debt increased at 7.8%/year from 2005 to 2011.
Ricardo –
Glad you like the discussion. I personally come to learn and teach. I always appreciate when I learn something I didn’t know.
There’s plenty of demand for oil now. How do we know? Because the price of oil is above the carrying capacity of the US economy. At this price, China is sourcing its oil from OECD consumers, not oil producers. If oil fell below, say $80-85, then we could say there’s “plenty” of oil. What we’re seeing in oil today is absolutely, positively not a lack of demand. If there were a lack of demand, then we would expect the oil producing regions to be lagging, as they were in the 1990s. But they’re booming. What we see today is exactly what we’ve seen since 2005. There’s not enough oil to go around, and thus China and the other emerging economies are forced to source their oil from incumbent consumers. In fact, they are sourcing 85% (!) of their incremental consumption from OECD consumers. The data is entirely unequivocal on this point.
As I am daily in the oil field services markets (where we have debates, for example, on the absorptive capacity of the operators (oil companies) for newbuild, deepwater drilling rigs), I can assure you that our industry is running flat out. For example, the incoming 100 deepwater floaters will require about 40,000 crew to man them. Where does the industry find 40k experienced crew in the next three years when their existing employees are all at retirement age and already leaving in large numbers?
Everyone is making good money in the industry. Everyone is running flat out. More money would be good, but everyone’s already working as hard as they can, and new people can’t be recruited and trained overnight. And remember, all this work has not really increased the oil supply by all that much. So, the limits today are truly human, asset-linked, political, and geological. For the time being, money is not an issue.
@Anonymous: Nobody denies the existence of speculation in the oil market. What’s at issue is its impact on price. There are plenty of hedge funds that trade oil with no intention of accepting physical delivery. But they don’t systematically drive up the price of oil by doing so, and the vast bulk of economic research into the subject backs this up. Speculators benefit commercial oil firms because they enable them to hedge their future price exposure, and they smooth out volatility by doing so. Speculators take on price risk so that oil companies don’t have to.
“Markets are apparently betting” is a simplistic and incomplete way of describing what goes on in commodity derivatives markets. It doesn’t take account of the hedging function that futures serve.
@Freude Bud: There are mechanisms to tie physical WTI and North Sea crude prices, so they’re not totally decoupled. Imports of Atlantic basin crude on the pipelines up to Chicago have dropped to almost nothing, which is partly why the US is importing so much less crude that prices off Dated Brent. And the Seaway pipeline is shipping up to 140,000 b/d of crude from Cushing to Houston, which makes WTI more responsive to crude economics on the Gulf coast, and ultimately to the wider Atlantic basin market.
I think the real price driver is more subtle. It’s energy. It takes about 160 exajoules of energy from oil per year to keep the world humming.
Energy return on oil has been dropping since the 1960s. Back then, there was a lot of energy slack in the system. An energy return of 100:1 vs. 50:1 didn’t make a lot of difference to the pricing. In 2005, however, we went down to an energetic return of 10:1. The energy of one barrel of oil only got us 10 more. That sounds like a lot, but that energy had to supply both the oil industry itself AND the remaining economic activity of civilization.
So, it seems that at 10:1, there wasn’t enough slack in the system to counter price fluctuation. Supply shortages became real energy shortages, with a concomitant rise in price. It now takes a lot more effort, and money, to generate that 160 exajoules per year.
Which is how it will be from here on out.
Steven Kopits,
Sorry for the delayed response.
I do not disagree that oil producers today are working all out to meet demand but as we have seen the world supply and demand for oil has not changed significantly in recent years. This is primarily due to politics. Most of the profits from oil in world production go to government. That was the point of my discussion of Colombia. It is the restraint on oil production by government that is causing the oil producers to work all out.
But if the demand for oil increases significantly governments will either increase production or be replaced.
I also agree with you that for the time being money is not a constraint. Actually the world governments have taken a little bit of a breath from their massive monetary expansions of the early 2000s and the monetary extremes seen since 2000 have somewhat stabilized.
If the world economies, especially the US, actually begin to recover, money will once again become an issue. If the world’s CBs choke off money creation fearing inflation when growth returns, they will send the world into a Volker-type deflationary recession as the demand for money is not satisfied.