The August numbers are in. From MarketWatch:
China posted a wider-than-expected trade surplus in August as imports unexpectedly contracted from the year-ago period, suggesting anemic domestic demand, according to data released Monday.
Exports exceeded imports by $26.7 billion during the month, beating expectations for a $17.2 billion surplus in a Dow Jones Newswires survey of economists.
Monthly exports rose 2.7% from a year earlier, indicating relatively weak overseas demand, with the gain missing a 3% projection from a Reuters poll of economists.
But imports surprised by dropping 2.6% from August 2011, failing expectations for a 3.4% increase from the Dow Jones Newswires survey and a 3.5% forecast gain in the Reuters survey.
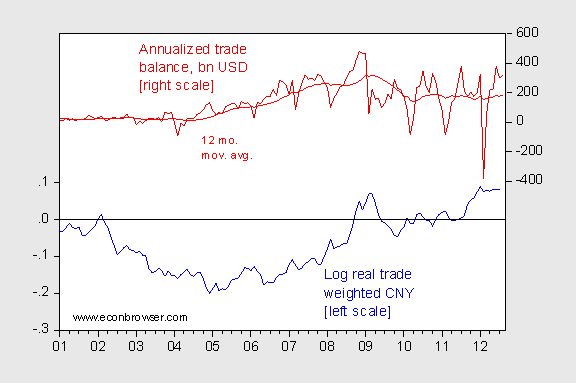
The evolution of the trade balance and the Chinese real exchange rate is shown in Figure 1.

Figure 1: Annualized Chinese trade balance, bn USD, not seasonally adjusted (dark red, right axis), twelve month moving average (red), and log real trade weighted (broad basket) Chinese yuan (left scale). Source: IMF Direction of Trade, ADB ARIC, Bank for International Settlements, and author’s calculations.
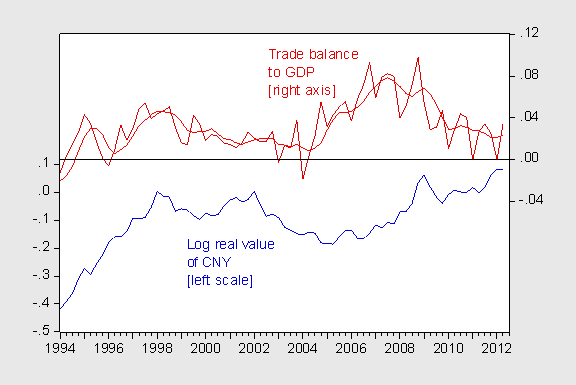
Note that as the exchange rate appreciates, quantities adjust – at least in the most recent episode. This is more apparent when trade balance is normalized by GDP, as in Figure 2.

Figure 2 : Chinese trade balance, n.s.a., to GDP, s.a. (dark red, right axis), twelve month moving average (red), and log real trade weighted (broad basket) Chinese yuan (left scale). Chinese trade in USD converted to CNY by exchange rate. Source: IMF Direction of Trade, ADB ARIC, Bureau of National Statistics, Bank for International Settlements, and author’s calculations.
For more on Chinese trade elasticities, see [0] [1].
I remember a year ago having discussions with other China analysts over the issue of the sustainability of this downswing in the Chinese current account balance. Note that reduction in the surplus preceded the global slowdown.
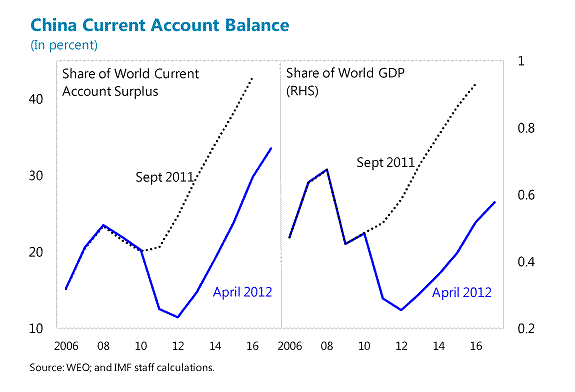
Back in April, the IMF released a working paper forwarding the explanations for the revision in the Chinese CA outlook, which was quite substantial, as shown in Figure 3:

Figure 3: Source: Ahuja et al. (2012).
It’s important to note that the forecasts are conditional: “these forecasts assume a constant real effective exchange rate, the [April 2012] World Economic Outlook projections for global demand, and a path of steady, medium-term fiscal consolidation in China.” The assumption of constant real effective exchange rate (for purposes of consistency with other forecasts in the WEO) explains in part why the CA begins to improve again. As I’ve noted elsewhere, continued real appreciation is a necessary part of adjustment over the longer term.
The authors conclude:
… the decline in China’s external surplus has been impressive and should be
welcomed. However, this adjustment has largely been the result of very high levels of
investment, a weak global environment, and a pace of increase of commodity prices that
outstrips the rising price of Chinese manufactured goods. While all three of these factors are
likely to continue to put downward pressure on the external imbalance, this does not
represent the “rebalancing” in China advocated by the IMF over the past several years. In
particular, the available official data which cover the period through the end of 2010 do not
yet indicate that the shift in the external imbalance is due to consumption rising as a share of GDP or national savings falling.
Just as the current account surprised on the downside, it might surpise on the upside going forward. From yesterday’s NYT:
Many Chinese economic indicators already show a slowdown this spring, with fixed-asset investment growing at its weakest pace in May since 2001. The annual growth rate for industrial production has edged below 10 percent, while electricity generation was up only 3.2 percent in May from a year earlier and up only 1.5 percent in April.
The question is whether the actual slowdown is even worse. Skewed government data would help explain why prices for commodities like oil, coal and copper fell heavily this spring even though official Chinese statistics show a more modest deceleration in economic activity.
So to the extent a step up in investment might have contributed to the current account decline, a big down step in private investment will result in a CA reversal, unless offset by government investment (and or consumption or private consumption) (see the saving-investment approach to the current account, discussed here). However, an increase in government investment will only exacerbate the longer term challenges of rebalancing the Chinese economy toward more consumption.[2]
Interesting. I’d be curious to see the trade numbers ex-oil as you do for the US, if you’re so inclined.
Can you describe more what is meant by “anemic domestic demand”. Is it final, consumer demand or industrial demand or both? Given the stories of inventory piling up, the news isn’t surprising.
Just as an aside, Chinese oil demand has recovered a bit.
At the height of the spring price spike, China’s y-o-y oil demand growth fell to a mere 1.3% in March (3 mma), and has since recovered to 4.6% in August.
This suggests, as I have earlier noted, that China can probably handle $115 Brent, but probably not $125 Brent.
Since this time in 2008 (actually, July, after which the comps begin to fall apart due to the recession), the oil supply is up 1.7 mbpd, no great improvement notwithstanding shale oil production.
And of this, 1.4 mbpd is natural gas liquids; thus crude oil production is only 0.3 mbpd higher than July 2008. This is not very much, and explains why oil prices are so high.
Yeah, you can see the “slowdown” in China with select US economic “indicators”. However, the financial side of the US is more robust which brings the current US indicators into a bit of problem with reality.
Hi Menzie,
Thanks for the update. I’m actually wondering how China’s industrial policy (in terms of subsidies and other preferential treatments conferred to State-Owned Enterprises) is affecting domestic Chinese productivity, and whether or not this has a positive or negative correlation with China’s ongoing CA surplus. Would you happen to know where I could learn more about this?
Great report as always 🙂
By the way, the Dragon Index computed by A Capital, a growth capital fund, finds that Europe is the preferred location for Chinese FDI, excluding natural resource deals. (See: http://www.cfo-insight.com/markets-economy/global-economy/chinese-fdi-prefers-europe/)
How come? I think this has to be interpreted with caution, but still I wonder why they focus on Europe!?