Can the wild swings in the price of oil over the last few weeks have anything to do with supply and demand?
 |
The Wall Street Journal carried this account last week:
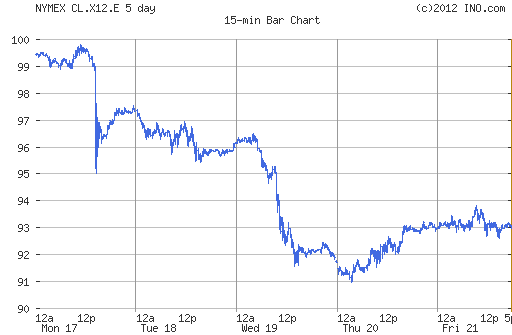
Oil prices dropped more than $3 in less than a minute late in the trading day on Monday, just as trading volume spiked. The move also dragged down prices of gold, copper and even the euro.
“Traders were looking like deer in the headlights,” said Peter Donovan, a floor trader at Vantage Trading on the New York Mercantile Exchange. “I called four different desks, and they all said, ‘we don’t know.’ ”
The move came at about 1:54 p.m. EDT. West Texas Intermediate crude for October delivery plummeted to $94.83 a barrel on the Nymex, from more than $98. Some 12,500 contracts changed hands in a minute, compared with less than 500 a minute previously.
The move sparked talk of an erroneous trade—called a “fat-finger” error in industry parlance—or a computer algorithm gone awry.
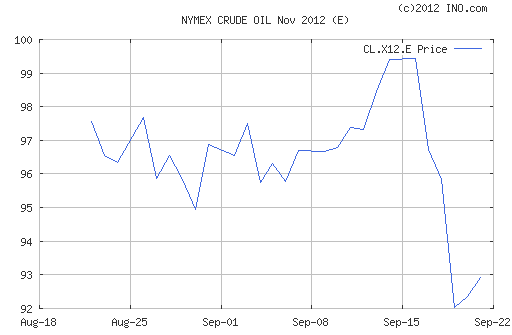
Fat finger or no, there was an even bigger drop on Wednesday, leaving the price of West Texas Intermediate well below where it had been prior to Fed Chair Ben Bernanke’s Jackson Hole speech on August 31 and the Fed’s announcement of QE3 on September 13.
 |
Those who doubt that oil prices are determined solely by fundamentals would naturally ask, what aspect of the supply or demand for oil could have possibly changed in the course of less than a minute last Monday? The obvious and correct answer is, there was no change in either the supply or the demand for physical oil over the course of that minute. The minute-by-minute price of a NYMEX contract is determined by how many people are wanting to buy that financial contract and at what price, not by how much gasoline motorists burned in their cars that minute. But since changes in the price of crude oil are the key determinant of the price consumers pay for gasoline, doesn’t that establish pretty clearly that the whims or fat fingers of financial traders are ultimately determining the price we all pay at the pump?
In one sense, the answer to that question is yes– last week’s decline in the price of crude oil will soon show up as a lower price Americans pay for gasoline. But here’s the problem you run into if you try to carry that theory too far. There are at the end of this chain real people who burn real gasoline when they drive real cars. And how much gasoline they burn depends in part on the price they pay– with a higher price, some people use a little bit less. Not a lot less– the price of gasoline could change quite a lot and it would take some time before you could be sure you see a response in the data. That small (and often sluggish) response is why the price of oil can and does move quite a bit on a minute-by-minute basis, seemingly driven by forces having nothing to do with the final users of the product.
But if the price of oil that emerges from that process turns out to be one at which the quantity of the physical product that is consumed is a different amount from the physical quantity produced, something has to give. Indeed, the bigger price drops we saw on Wednesday followed news that U.S. inventories of crude were significantly higher than expected:
Oil dropped to a one-month low after U.S. crude inventories surged the most since March as production and imports rebounded from Hurricane Isaac.
Futures decreased as much as 3.3 percent after the Energy Department said supplies rose 8.53 million barrels last week, more than eight times what was projected in a Bloomberg survey. Imports arrived at the highest rate since January and output rose. Crude fell before the report on speculation Saudi Arabia is moving to reduce prices.
 |
There are several channels by which QE3 may end up influencing the quantity of oil physically produced and consumed. A lower value for the U.S. dollar would mean a greater quantity demanded worldwide at a given dollar price of oil. A higher level of economic activity (the ultimate goal of QE3) would also boost demand for the physical product. And lower real interest rates may make it profitable to store more oil physically, leaving less available for the ultimate users of the product. So I would have expected QE3 overall to be one factor that could contribute to a higher dollar price for oil.
But any investors who have been assuming that QE3 will boost the price of oil for no reason other than the fact that other traders expect it to raise the price of oil may find themselves tripping painfully over the fat finger of reality.
“Some 12,500 contracts changed hands in a minute, compared with less than 500 a minute previously”.
All these guys buying and selling contracts expect to profit from their activity. The laws in the U.S. make this possible. Why? Why not? Sales are necessary to provide a market. A market is a very good way to allocate scare resources. So this system exists to benefit everybody in the U.S.
My question is this: “Who has looked at the question of whether it is feasible to collect sales taxes on each of these sales?”
Some sales are necessary. But no pubic interest would be harmed if sales taxes reduce sales per mimute to 100 rather than 500.
QE3 is irrevelant. Most of the market knew before and hand about the rest knows now……everything the FED does…….does not exist. They don’t control the money supply…..private banks do. The only thing the FED has in its pocket is the 1 year note.
All “QE” is electronic credit IOU’s that if the market comes calling the government…..then……would buy up what is on the FED’s balance sheet.
Similiar to the lost 7 trillion on the banks balance sheet. It wasn’t printed away. It was essentially suspended in time as the market ignores it basically.
This kind of “faith” based financing is quite revealing. So why would Oil prices rise on QE3? No new money was put into the system.
Those buying futures are often looking to hedge positions, rather than make a profit per se.
But what’s your goal, Reformer? Do you want to raise tax revenue? Trades are subject to capital gains and other taxes. So perhaps you want to raise corporate tax rates? Is a financial transactions tax the best way to do that?
And would transactions taxes reduce the probability of “fat fingers” event? I don’t see that it would. It would serve to perhaps bankrupt those companies which suffer computer glitches, for example, Knight Securities. But I’m not convinced it would prevent either computer errors or herd behavior in the event of sudden market shocks.
Better than fat fingered is the line from Spy, which referred to Trump but is reusable: short-fingered vulgarian.
When looking at actual oil price with a cubic interest,the IEA report on the level of oil strategic reserves within OECD countries as of June 2012 , shows ample oil stocks.
Most of the countries surveyed are holding reserves above the 90 days import level requirement.
CME data November 2012 light sweet crude oil price, volume and open interest are not showing a fat finger but a finger built up with volume:
(http://www.cmegroup.com/trading/energy/crude-oil/light-sweet-crude.html
No oil price top,corroborating an ensuing recession but good and steady volume built up on November 2012 futures.
Further studies, may look for symmetries in actual oil price versus past geo political developments.
Often,pure markets see what we do not see.
Sep. 17 marked a big escalation in the Japan-China island dispute. All the China country reports are being rewritten to reflect the heightened political and social risk. The world had not priced the negative economic effect of trouble in China on oil demand.
What is the difference between the huge swings in the price of oil today versus the period before Richard Nixon closed the gold window? If you look at a graph of the oil price pre-1971 you find an almost flat line. The price of oil did not fluctuate. After 1971 the price of oil has been the most extreme of any commodity in history.
How is it that an announcement by the FED can cause such huge swings? Could it be that traders are actually looking at the monetary foolishness of the FED? Is it possible that there is big money in our election attempting to manipulate the market? Volume changing from 500 contracts to 12,500, does that seem normal?
Just for the record I was short oil. When it hit $100/bbl briefly that was a huge sell signal.
So what now? Well oil is underpriced. The big sell off was not normal or caused by an supply/demand issue and if you believe it was you are deluded. Whether the FED, the SOR, or European economic decline, oil is set to bounce. Does that mean that it will not continue to fall for a short time? Certainly it could. But the price pressure is for higher prices.
So since the QE3 announcement, the interest rate on the 10 year is up, and the price of oil is down. Completely counterintuitive, right?
In my opinion, focusing on average annual crude oil prices filters out a lot of the short term trading noise. And of course, based on WTI crack spreads (currently about $36, versus about $11 for Brent), Americans are fully exposed to global crude oil prices. WTI is only really relevant to Mid-continent producers and refiners, notwithstanding CNBC’s obsession with WTI prices.
In any case, the average annual Brent price rose from $25 in 2002 to $111 in 2011 (with one year over year decline in 2009). This is an average rate of increase of about 17%/year. If we assume that the annual 2012 Brent price will be about the same as 2011, the 10 year 2002 to 2012 rate of increase in annual Brent crude oil prices will have been about 15%/year.
As I have previously noted, the primary contributor to this double digit average rate of increase in oil prices is a (so far) small post-2005 decline in Global Net Exports of oil (GNE*), with the Chindia region (so far) consuming an increasing share of GNE.
In 2002, the ratio of GNE to Chindia’s Net Imports (CNI) was 11.0. By 2011, the ratio had fallen to 5.3. This is a nine year 2002 to 2011 rate of decline in the GNE/CNI ratio of 8.1%/year. The 2005 to 2011 rate of decline in the GNE/CNI ratio was 8.7%/year, and the ratio has fallen for six straight years, from 2005 to 2011.
GNE/CNI ratio:
http://i1095.photobucket.com/albums/i475/westexas/ECIPlots2.jpg
At an 8.7%/year rate of decline, the GNE/CNI ratio would theoretically hit 1.0 around 2030, 18 years from now, meaning that the Chindia region alone would theoretically consume 100% of GNE around the year 2030. Of course, this won’t happen (and there are signs of slowing demand in the Chindia region), but that is the 2005 to 2011 trend, and the rate of decline in the GNE/CNI ratio accelerated in recent years.
But the bottom line in my opinion is that the 10 year double digit rate of increase global annual crude oil prices is due to fundamentals–as we have seen an almost double digit rate of decline in the ratio of Global Net Exports of oil to the Chindia region’s net imports.
*GNE = Net exports from top 33 net exporters in 2005, BP + Minor EIA data
Incidentally, one of the characteristics of net export declines is that given an ongoing production decline rate in an oil exporting country, the net export decline rate will: (1) Exceed the production decline rate and the net export decline rate will (2) Accelerate with time–unless consumption in the oil exporting country falls at the same rate as the rate of decline in production, or at a faster rate.
We have nine years of post-2002 annual GNE/CNI data (ratio of Global Net Exports of oil to Chindia’s Net Imports).
Note the pattern in the nine year 2002 to 2011 GNE/CNI rates of change, broken into three year segments.
GNE/CNI Rates of Change
2002 to 2005: -7.2%/year
2005 to 2008: -7.8%/year
2008 to 2011: -9.5%/year
We can argue about what will happen, but what has happened is clear. The rate of decline in the ratio of Global Net Exports of oil to Chindia’s Net Imports has steadily fallen, and the rate of decline in the ratio has accelerated.
Minor clarification:
We can argue about what will happen, but what has happened is clear. The ratio of Global Net Exports of oil to Chindia’s Net Imports has steadily fallen, and the rate of decline in the ratio has accelerated.
Has anyone else been amused by the number of “fat fingers” we have see the past few years? It seems everytime there is a big move down in the markets there is some fat finger in the mix pointing away from the FED and the Exchange Stabilization Fund.
So since the QE3 announcement, the interest rate on the 10 year is up, and the price of oil is down. Completely counterintuitive, right?
Nope, on interest rates, that is exactly what you want to happen. The short term rates has fallen, steepening the yield curve. That is the real goal of QE.
Oil prices are the Asian slowdown.