As U.S. retail gasoline prices once again near $4.00 a gallon, does this pose a threat to the economy and President Obama’s prospects for re-election? My answer is no.
The graph below plots average U.S. gasoline prices, adjusted for inflation, over the last decade. This is now the fourth time we’ve been near the $4 threshold. It first happened in June 2008, again in May 2011, and again in April of this year. In fact, on each of those previous 3 occasions the average U.S. retail price of gasoline was higher than it is today.
 |
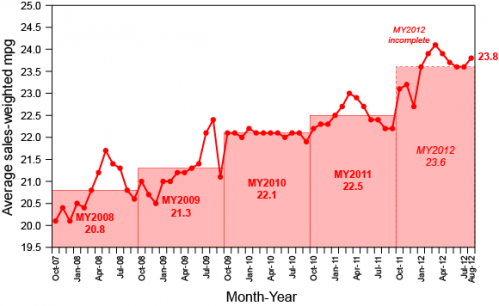
The first time something like this happened in 2008, it was quite a jolt to consumers and to the economy. In fact, the U.S. is still in the process of adjusting to that shock 4 years ago. The vehicles that many Americans were driving at the time just don’t make sense if you have to pay $60 or more every time you visit the gasoline station. Even so, you don’t get rid of the old gas-guzzler right away, but make sure you change when you buy a new one. The average fuel economy of new U.S. cars purchased has been steadily increasing since 2008.
 |
Total vehicle miles traveled also takes time to adjust, as people change their home, job locations and other habits.
 |
The initial adjustments associated with that process were quite disruptive to the economy. For example, sales of light trucks and SUVs manufactured in North America plunged in the first half of 2008, and the hit to the auto sector made an important contribution to the first year of the Great Recession. Sales of this category for August of this year were still 20% below the average August value over 2003-2007.
 |
By contrast, sales of lighter cars are now back up near their historical average, allowing the auto sector to be able to make a solid contribution to recent U.S. economic growth.
 |
It’s also interesting to look at how the response of consumer sentiment to gasoline prices has changed over time. The blue line in the graph below shows the same real gasoline price series plotted in Figure 1 above, except now drawn on a negative scale (shown on the right-hand axis); that is, the lower the blue line, the higher the price of gasoline. I plot it this way to highlight its relation to consumer sentiment, shown in black and labeled on the left-hand axis. When real gasoline prices first reached $3.50/gallon in 2005, consumer sentiment plunged sharply. When it happened again in 2006, the response was more modest, and on the third time in 2007, it didn’t seem to faze consumers. It was only when gasoline prices went on from there to make new highs in 2008 that we saw sentiment plunge again.
 |
By the second time gas threatened $4/gallon in the spring of 2011, the memory of 2008 had receded somewhat, and consumer sentiment fell sharply. It was much more muted when the same thing happened again just one year later. And right at the moment? Consumers seem to be shrugging it off. Nobody is surprised this time, having seen the same thing twice before over the last year and a half. Many of the adjustments people are making today were in fact set in motion 4 years ago.
There is quite a bit of empirical support for the claim that the second or third time oil prices move back near a previous high, the economic disruption is significantly less than the first time; see for example the evidence and literature reviewed in my 2003 Journal of Econometrics paper (ungated version here) and two recent surveys [1], [2].
$4/gallon? Been there, done that.
Ah, serendipity of sorts. I just posted the following on the Big Picture blog – and it’s apropos for this posting.
Some not so inconsequential trivia for the day.
Guess which state is most impacted by the cost of gasoline.
Take the average number of gallons consumed per personal vehicle.
Times that by the average price per gallon.
Multiply that by the average number of cars per household by state
Divide the cost per household by the median income per household by state.
The answer is:
Kentucky.
The average consumption of gas per car is 1009 gallons, second only to Arizona. The cost per median household is 21.95% of their gross income.
Obviously, this is an abstraction. It assumes 2.3 car per household burning on average 2320.7 gallons per year, and the median household income of $40,072 (I used the last data I could find on average fuel prices for KY).
Still, allowing for variances, it’s an astonishing number. That Kentuckians use more gas that say, Texans (they use 942 gallons per car on average), seemed bizarre. Yet, that is what the Federal Highway Administration calculates, and their numbers are solid. The only explanation that comes to mind, outside of perhaps local car culture, is that a higher percentage of Kentuckians live in rural and semi-rural communities, with longer driving distances for their work/shopping/entertainment.
At any rate, I thought it was an interesting little bit of information to share.
VMT is my favorite economic indicator, buy the data lags a couple months.
The first time it spikes, people are afraid it’s going to stay high forever. The third time it spikes, people are convinced it will fall back again, at least momentarily. This translates into different consumer behavior, especially with cars and trucks.
2ndlook,
Here is a batch of fairly aged data (2000) on urban density by state. Kentucky is 38th, Texas 16th. So that would explain Kentuckians spending more than Texans on gasoline, but does not explain Kentucky being the most gasoline-consumptive state. Southern states seem to rank low on urban density – even Georgia, but these data are 12 years old, so maybe don’t account for Atlanta’s recent growth.
Oops…
HERE are the data:
http://www.demographia.com/db-urban2000state.htm
An interesting opinion piece in the Sunday NYT, with a very interesting graph:
Do Tax Cuts Lead to Economic Growth (Link to article shown below):
http://www.nytimes.com/imagepages/2012/09/15/opinion/15captial-graph.html?ref=sunday
Each point on the above graph, taken from the article, represents the average annual US economic growth per year over a five year period, starting at that point.
Note the severe contraction in average five year growth starting in 2002. The author of this article attempts to link faster growth to higher tax rates and slower growth rates to tax cuts, with the peak five year average growth period being from early 1995 to early 2000.
Note that the average rate of increase in annual Brent crude oil prices from 1995 to 2000 was about 1%/year, from $17 in 1995 to $18 in 2000.
However, the average rate of increase in annual Brent crude oil prices from 2002 to 2011 was almost 17% per year.
Perhaps this 17% per year average rate of increase in annual Brent crude oil prices had an impact on post-2002 US average five year economic growth?
Note that based on WTI crack spreads, US consumers are paying prices for refined products that are based on global crude oil prices.
Annual Brent crude oil prices through 2011:
http://www.eia.gov/dnav/pet/hist/LeafHandler.ashx?n=PET&s=RBRTE&f=A
I suspect that Quantitative Easing (QE) is more a result of rising oil prices than a cause, as oil importing OECD countries try desperately to keep their economies growing, through increased deficit spending–financed by real creditors and by accommodative central bankers–as we have seen a bidding war break out for a declining volume of Global Net Exports of oil, with the developing countries, led by China, so far at least consuming an increasing share of a declining (post-2005) volume of Global Net Exports of oil.
Following is a graph of the GNE/CNI ratio versus total global public debt:
http://i1095.photobucket.com/albums/i475/westexas/GNEvsDebt.jpg
GNE = Global Net Oil Exports*
CNI = Chindia’s Combined Net Oil Imports
*Top 33 net oil exporters in 2005, total petroleum liquids, BP Data + Minor EIA data
Link to NYT Opinion piece:
http://www.nytimes.com/2012/09/16/opinion/sunday/do-tax-cuts-lead-to-economic-growth.html?_r=1&ref=opinion
“When real gasoline prices first reached $3.50/gallon in 2005, consumer sentiment plunged sharply. When it happened again in 2006, the response was more modest, and on the third time in 2007, it didn’t seem to faze consumers”
I don’t see this. In 2006, the gas price plunge didn’t reach the 2005 lows, and after the 2007 gas price plunge consumer confidence DID continue its long descent. But overall I’m sure you are right–we are only going to see big effects if gas prices hit new highs.
The U.S. economy is driven by consumer spending if consumers do not spend (currently there is no “law” penalizing them for not doing their fair share of spending)bad things happen like QE3 or QE10. The price of gas is a factor but one among many.
With Obama, higher gas prices are the least of our worries.
How do you react to high gas prices? Drive less? Sell the quad-cab-4WD-pickup for a prius? At some point, there is just nothing more you can do to react to those prices, and you just have to accept them, or stop driving entirely.
ADS index is at lowest level since end of 2009.
Yay! Great article. I’ve probably mentioned this to you in the past but the only improvement I could suggest on your “What is an Oil Shock” paper from back in the day was including a variable that represents the percentage oil purchases are of total expenditures. With oil at $110, we are at a relatively high % of expenditures from a historical perspective – thus is we were to have a oil price shock from here…e.g. prices doubled-and-a-half to $275 or something along those lines, the effect would be even more pronounced then when we went from $60 to $150 in 2008. I got better information criterion when including this expenditure weighted variable in your specification.
I guess you don’t need to be into econometrics to know that $275 oil would derail the economy though 😉
Elevated gas prices don’t fully explain the reason our vehicle miles driven chart is fast trending downwards. What else is going on?
Looming recession? Not necessarily… this time around… (Housing starts are trending up. Plus, less volatility on top of a downward trend in oil prices mitigates the macro-scariness.)
Innovation? Well, yes!
We are losing the “Be there or be square” boomer cruiser mentality. Lowering gas prices a few percent here or there won’t deter the consumer from choosing from any number of alternative low cost technological substitutes for “being there”.
Prices paid at the pump provides immediate negative feedback to the consumer, reinforcing the notion that grizzly gas guzzlers can tune in, turn on, and kick the oil addiction regardless of what lifestyle they’ve grown up with.
I’m guessing it is both novel and less expensive (for shamanically challenged folks) to telecommute, socialize and shop on-line. It makes the old school pastime of “cruising” less meaningful and anachronistic.
Because consumers can choose to interact in a way that substitutes electronic connectivity for physical co-presence, the social-network phenomenon is truly a game changer.
The internet is “commuting” the onerous pay to play hydrocarbon lifestyle costs with the dramatically lower perceived costs of lithium-ion battery powered social mobility.
Today’s consumers are no longer joined at the hip to the automobile. Shouldn’t we recognize the contribution of modern semiconductor technology and the gross deflationary impact it has had on computing costs?
Isn’t low cost internet usage at least partially responsible for slackening aggregate demand for high cost, energy intensive lifestyles?
Yes, and it is the key to a successful deleveraging process now in full swing by the greater world population.
Moore’s law (wherein computing power grows exponentially over time) runs like the grain of rice on the first square of the chessboard.
Look out above!
JDH wrote:
As U.S. retail gasoline prices once again near $4.00 a gallon, does this pose a threat to the economy and President Obama’s prospects for re-election?
Professor,
The answer is no then yes. $4.00 gasoline does not pose a threat to the economy, but the average person, rightly or wrongly, does blame President Obama. By opposing drilling in the Gulf and the Keystone pipeline, Obama has created the impression that he is responsible shortages and for high gasoline prices. When prices are high he is blamed. Politics is about perception not reality.
I agree with almost everything here, except I think you understate the importance of marginal price movements. No, we won’t get any big general consumer retrenchment from a marginal gas price movement. No, it’s no real threat to Obama’s re-election, unless he stumbles somehow and this turns into a neck-and-neck race. But a move from $3.80 to $4 does matter to the US economy. Especially since it’s happening amid slowing global trade and less than robust US growth. It’s one more reason to worry.
Sell the quad-cab-4WD-pickup for a prius? At some point, there is just nothing more you can do to react to those prices, and you just have to accept them, or stop driving entirely.
The fallacy of the extremes.
The quad-cab guy buys a dual-cab next time around which gets 10-20% better gas mileage. The prius guy buys the plugin prius and cuts his gas usage 10-20%. Incremental improvements up and down the range moves the mean. One does not have to hop from the bottom to the top … and few can or do.
Of course efficiency improvements are just one factor, as Hamilton shows above.
gas prices are headed back to 3.50.
For a lot of people, the economic pain is the cost of a couple cups of coffee at Starbucks. The low-income earners who can’t afford a newer vehicle and struggle with the extra $30 or $40 per month in gasoline costs will continue to vote for the same party that wants to save the planet rather than fix the economy by creating policies that will promote lower energy prices.
And then the states and federal government will raise the gasoline taxes.
Incremental improvements up and down the range moves the mean.
The average national price of gasoline in 2001 was $1.61, a decade later it was $3.51.
Average fuel efficiency increased by a little over 10% doing that period. Average miles driven dropped slightly.
So, despite the more than doubling of the cost of filling a tank, and extremely modest improvement in household incomes, Americans were unwilling, or unable, to offset the higher prices by migrating to moving, in aggregate, to more efficient vehicles.
Now, there may be a tipping point – some people surmise that $5 per gallon could be it – where the migration is more extensive and serious, but I strongly suspect, as long as supply can service demand, Americans are, based on their history, more likely to just grit their teeth and pay a higher percentage of their incomes to fuel their cars and truck based chaises vehicles (light trucks, SUV’s, vans, etc).
“Elevated gas prices don’t fully explain the reason our vehicle miles driven chart is fast trending downwards. What else is going on?”
VMT are currently going up, suggesting recovery. Let’s see if it keeps going up with the August and Sept data in a couple months.
Kent Moors is “the man” in these matters, and his Law (not Moore’s Law for IC chips) explains why oil and gasoline prices double every 5 years:
http://www.indybay.org/newsitems/2012/08/20/18719938.php
Incidentally, millions of us will be forced off the road.
Moors’ (not Moore’s) Law shows that the demand for EASY oil finally got ahead of the supply in 2005 as production of conventional crude peaked AND China’s motorization reached critical mass. A graph at the Moors’ Law for Oil site links these two trends.
Good-bye SUVs (S.U.V./R.I.P.).
Note that foreign trade, the basis of the world system, is collapsing under the weight of oil and bunker fuel (for ships) and jet-fuel prices.
The latest bounce in miles traveled shows an encouraging positive slope at the moment, true.
Could it also be correlated to the slight increase in local construction projects and recent utility upgrades as much as a general economic recovery? Perhaps.
Teasing out the relationship between the 1990 dip (Japan’s housing/tech inversion) and our 2007-present excursion downward suggests that there will be an eventual increase in general transportation activity as the employment v. housing situation progresses towards a happier equilibrium.
Lower oil/gas prices wouldn’t hurt that recovery one bit, but what likely won’t be an ongoing secular trend — mindless miles driven in search of a diversion — will continue to fade unless folks find more effective ways to monetize their talents by traveling more miles.
Even with an overwhelming investment in the transportation infrastructure, consumers will increasingly find technological outreach an attractive substitute to personal vehicle use.
As consumers unlock new ways to “mobilize” their points’ of view, fewer and fewer people will find driving an economically suitable means for gratuitous social connectivity.
People automatically assume the horse and buggy was rendered obsolete by the automobile. Might the telephone had something to do with that as well? (Not to mention Tesla’s little invention… AC power generation and distribution.)
1597 –
“mindless miles driven in search of a diversion”?
It’s not 1973 anymore. Who do you know that drives mindless miles anywhere? Everyone I know is scheduled to the hilt. There’s no cruisin’ for chicks at the local diner nowadays (at least not in Princeton–we cruise for them at the library, of course).
I am of the view that falling vehicle miles is bad news indeed for the economy. It means we are losing mobility. If you want to hire an extra worker, then they can’t travel on average, and they certainly can’t use another drop of fuel.
This is potentially a serious constraint on economic recovery. If it were, for example, we would expect new jobs to have lower wages and lower productivity–and that’s what we see in both the US and UK. A lack of oil won’t prevent people from working, but we would expect it to slow their uptake and limit their productivity–unless society can be re-organized in such a way as to make mobility unnecessary.
Thus, the issue is the GDP elasticity of VMT (and other forms of mobility), which is in turn a function of the VMT elasticity of oil consumption.
The comments are spot on regarding VMT, oil and the economy. But no one’s done the research and analytical work to properly establish the relationships.
Please accept my gratitude for the comments and responses. Hopefully, further discussion will shed light on the many perspectives regarding our peculiar economic circumstances. With data!
Which is why this blog rocks!
One humorous note about cruising and why it is on my mind — my 90 yr old Pop is just such an inveterate driver — he just recently circumnavigated the entire US and parts of Canada — on a motorcycle!
Apparently, building pontoon bridges for Gen. Patton in WWII Germany inculcated in my dad the ability to inspire others through exemplary action.
“I drove to the Rhine River and went across on the pontoon bridge. I stopped in the middle to take a piss and then picked up some dirt on the far side in emulation of William the Conqueror.” General George S. Patton, March 1945.
Judging from that famous picture, he just needed to take a leak. I enjoy that activity, too. Albeit without Willy’s 109’s smashing bugs and fuel depots… (whilst otherwise hiding in the clouds).
Here’s wishing I could have flown the Messerschmitt 104, er, F-104. Now that’s traveling fine style!
Just speculation, but could it be KY higher fuel use is attributed to travelers filling up and keep going? Also UPS has a large air hub in Louisville which could account for additional fuel usage.
Boris,
I doubt that out of state travelers account for any significant increase in gasoline consumption – the numbers would be too small relative to the resident population. Kentucky isn’t a small population state; in fact it’s just at the median, with 4.339 millions.
Also, consider Mississippi, among the top 5 in per vehicle gasoline consumption, and without being a traveler hub.
I suspect that as an earlier poster mentioned, the comparative low density, the cultural unwillingness to relocate closer to work if it means leaving a county that one’s family has lived for many generations, is one of the significant vectors.
In addition, in America especially, people don’t seem to be rational agents when it comes to their personal vehicles. Choices aren’t really made purely from a cost/benefit analysis. For example: From a limited search, it seems that Kentucky has much higher than national average number of pickup trucks, mostly used for non-business – according to the data from the state’s DMV.
Inefficient vehicles appears to be much more of a lifestyle decision than anything else.
Which is why I’m skeptical of any significant voluntary improvement in gas usage. We’ll only change when it either becomes financially unbearable, or if the heavy hand of government forces us (sarcasm very intended).
H/T Doug Short:
Gasoline Volume Sales, Demographics
and our Changing Culture
Details, details… dish!
@ Buzzcut:
“Sell the quad-cab-4WD-pickup for a prius?”
Er, you do know that last century tech plain jane mainstream hybrids come, not just as a prius, but in every vehicle type and style now, including large pickup trucks?
http://www.fueleconomy.gov/feg/hybrids.jsp
If you were up to date (to the latter part of last century, anyway) and already had a prius (third best selling car on the planet), you could sell the last century tech gas hog prius for an AWD turbo high compression plug in hybrid wagon (great for hauling and covered) (see Volvo XC60) that can tow a huge fishing boat or a horse trailer AND gets much better around town and daily short commute mileage than the lardo Prius v wagon. Or you can change to a plug in hybrid Chevy Silverado (VIA Motors) pickup truck. Also, Chrysler is now field testing their micro-gridable (ideal in power outages and natural disacter recovery) plug in Dodge Ram pickups in prep for production sooner rather than later. Or you can split the difference and get a plug in hatchback (very practical for hauling) or crossover style vehicle, some of which can use large tires if that’s your thing, like the plug-in Mitsubishi Outlander or Ford C-Max Energi or, heaven forbid, a Chevy Volt, which has better handling and quickness than a ’55 ‘Vette and can fit and haul far more and outclasses and outsells the current Audi A6 and Mercedes S class in the US.
If a mainstream large family sedan works for you, then maybe the recently recommended plug-in Accord?
http://www.usatoday.com/money/cars/story/2012/09/15/plug-in-hybrid-accord-is-the-best-new-accord/57782580/1
There’s always something better coming out.
http://www.motorauthority.com/news/1071869_volvos-u-s-chief-talks-about-the-xc60-plug-in-hybrid-video
http://www.fueleconomy.gov/feg/phevnews.shtml
With a plug-in hybrid, just fill ’em with gas like you are used to from last century, and plug ’em in only when it suits you, which is getting easier every day. In addition to home, public plug-in stations now dominate all other alternative fuel types and can use cleaner natural gas (when it powers the grid, about 25% or more nationally) when the station doesn’t already have a solar, wind or other alternative offset (many of them do):
http://www.afdc.energy.gov/fuels/stations_counts.html
Welcome to this century, which started over a decade ago. Yes, we would all like more efficient AND more competent yet low cost pickup trucks and other vehicle types. The fastest way to get there is to stop making the now obsolete, inefficient stuff (to scale up the better stuff) or at least price the old stuff high enough to cover a fraction of what it’s costing society to keep it hanging around.
This also gets better mileage than a prius, by the way, and is the fastest car of all on street tires to ever do the ‘Ring. Yep, it’s a plug-in hybrid:
http://www.autoweek.com/article/20120919/carnews/120919813
Long live the “micro-grid”.
Really, a horseless carriage with a grid-tie synchronous inverter… That’s innovation makin’ hay! (Especially during peak TOU.)
Blah,blah ,Blah, This is a truly failed presidency way beyond factors like the price of gasoline! His offensive,arrogant manner combined with his public dislike of America is why he needs to go.
The Libya saga combined with drug cartel gangs shooting their way into the United states, killing our border patrols, the same ones that received instructions”to run and hide if they are threatened” from homeland security is why Obama needs to go. Now we hear the embassy in Libya asked for more protection before the raid. Do you know how our ambassador was killed? The official report? Public in Europe and Arab countries? He was sodomized to death!Official report says so, too delicate for the American public to hear. And you think the price of gasoline is a factor in his re election? That is mild compared to the numerous offenses to America this man has committed!
Must be a presidential election in the USA….
So what is the new pain threshold going forward? $4.50/gallon?
Re the truck sales grafs … I’d rather you’d had gotten rid of the chaff of month-to-month variations and just done an annual comparison, through August, of each year. And, because of the recession dinging vehicle sales in general, I wish you had done just one graph, with annual rates of truck sales as a percentage of total passenger vehicle sales.
Or, at the least, if you want monthly breakouts, still, just give us the one graph, with ratios.
After all, the issue of how much or how little that ratio has changed since 2007 is the nut graf of this whole blog post, and you’re essentially hiding it.