Over a hundred and fifty years ago, the “Know Nothing Movement” rose to prominence in American politics. The “Know Nothings” were thusly known not because they were ignorant, but because they denied being adherents of a xenophobic, nativist party. But I think this time around, it is appropriate to characterize one group as being a true “Know Nothing” party in the sense that they reject the gifts of the Enlightenment.
In particular, the election provides a stark contrast between those who believe in math, and those who believe that by means of a mantra, math can be avoided. This point is demonstrated examining the claims made by the two Presidential candidates, although clearly math-denialism extends to senatorial and Congressional candidates. Table 1 presents the main components of each presidential candidate’s plan – in the case of the Romney plan, they are to the best of our knowledge at the given moment.
Table 1: Source: Deutsche Bank, Global Economic Perspectives, 31 October 2012 [not online], based on TPC data
As the Tax Policy Center has observed, to the best of our knowledge (given the quantum physics nature of the Governor’s positions), the Romney tax plan implies a loss of $5.1 trillion over the FY2013-22 period. Figure 1 below shows the amount that can be made up by eliminating all (yet to be specified) deductions, and all deductions while allowing amounts up to $25 thousand (the number Governor Romney picked out of the air during the debates). Clearly, eliminating all identifiable tax expenditures does not come close to making up for the revenue loss.
Figure 1: Total revenue loss from individual tax rate reduction, corporate tax reduction, ending capital gains and dividend tax elimination for incomes below $200K, ending AMT and estate tax = $5.1 trillion, FY2013-22; additional revenue from eliminating all tax expenditures (red, right bar), or eliminating tax expenditures but allowing individual deductions up to $25K (red, left bar), dynamic macroeconomic response according to Mankiw-Weinzerl (2006) model extrapolated from TPC (green bar), and resulting implied net tax revenue loss (blue bar). Source: For total tax revenue loss, and additional tax revenue from eliminating deductions, Center for a Responsible Federal Budget (1) and CRFB (2); and for dynamic response, TPC, pp. 14-15, extrapolated to FY2013-22 loss.
The blue bars indicate the amount of “magic-ness” necessary to make the proposed tax changes revenue neutral, as the Governor has promised (when asked whether the math adds up, in the second Presidential debate). Further, notice that allowing for dynamic macro response does not fill the gap (unless one uses the highly imaginative – some might say hallucinatory – Heritage/CDA type of scoring as was used for the Ryan plan [1] [2]) Using the $25 thousand limit for deductions (of unspecified nature) cited by Governor Romney leaves a $3.1 trillion hole. Eliminating all deductions still leaves a $2.4 trillion hole. Further explorations can be conducted on your own using this interactive website.
Now compare the Congressional Budget Office score of the President’s budget.
Figure 1 from CBO, An Analysis of the President’s 2013 Budget (March 2012).
To remind readers, the CBO along with the Joint Committee on Taxation is Congress’s nonpartisan budget analysis arm (the Congressional Research Service, which according to some accounts has been pressured to adjust its analyses, is also a nonpartisan support agency for the legislature, housed in the Library of Congress).
According to the CBO, the additional deficit due to tax provisions relative to baseline over FY2013-22 is $2.35 trillion (Table 3). It is important to note that this estimate does not include any macroeconomic impact on tax revenues arising from tax or spending provisions.
Moreover, this discussion has omitted the implications of spending side provisions. As laid out in the CBO analysis, the President’s plan indicates $1.15 trillion reduction in the deficit from outlay reductions. Governor Romney has proposed massive spending reductions on the domestic side, while increasing defense spending by $2 trillion over a horizon of varying lengths, depending upon the day in which the Governor is speaking on the subject. [3]
The extent of the cuts are shown here:
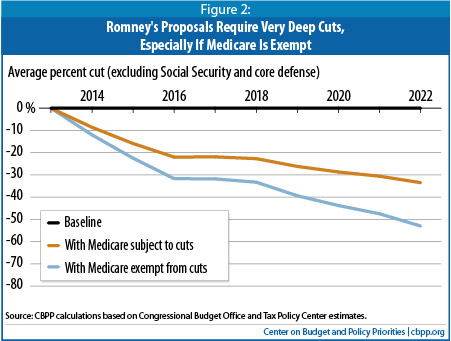
Figure 2 from CBPP (Sept. 24, 2012).
If one were to factor into the calculations the contractionary effects of these massive spending cuts, it’s quite likely the reduction in tax revenues would be much larger than the $5.1 trillion tabulated above.
As IHS-Global Insight concluded (“Comparing Presidential Fiscal Plans,” 10/31/2012), while both candidates plans are contractionary relative to baseline:
The weakness in growth—compared to baseline—is longer-lasting in the Romney simulation because of the cuts in government spending required to reduce government spending to his target of 20% of GDP by fiscal 2016. Monetary policy is already extremely loose, and cannot offset the extra fiscal squeeze, although the weaker economy in the Romney simulation does allow the Federal Reserve to raise rates more slowly than in the baseline (where it tightens starting in mid-2015). One caveat here is that a Romney administration might bring in a more hawkish successor to Federal Reserve Board chairman Ben Bernanke when his term expires in 2014. If this were to happen, then there might not be even a partial offset to the fiscal squeeze.
Unfortunately, CBO’s and JCT’s methodology is biased against tax and government spending reductions and biased in favor of tax increases and government spending increases. For legislative consistency, CBO uses JCT’s analysis of tax law changes in its own analysis of proposed legislation effects.
To quote JCT from its own testimony and document (JCX-48-11, Sept 21, 2011) (and JCT has said the same thing for many years):
JCT assumes for revenue projections that a tax increase will never reduce aggregate economic activity (GDP) and a tax reduction will never increase aggregate economic activity (GDP): a tax reduction does not produce increased tax revenues from higher GDP and a tax increase does not reduce tax revenue from decreased GDP.
Obama’s proposals are tailored to game the rules used by JCT and CBO to reflect a Congressional mythical view of the US economy that favors increase in taxes and government spending. Romney’s proposal’s general concept, which is not modeled by CBO and JCT, is that there are incentives and disincentives reflected in the tax code that increase and decrease economic activity such as private capital investment, workforce participation, work hours, business formations, etc., which have real GDP effects.
Under the current JCT-CBO methodology, reformation of the tax code to provide increased GDP growth through greater private investment incentives, increased workforce participation and increased work hours without losing tax revenue is impossible.
All in interesting quantitative essays, good students have been led to believe that there is a relationship between GDP growth and corporate profits.
Seeking alpha has a different quantitative exposition.
“The Relationship Between Corporate Profits and U.S. GDP Growth Appears to Have Ended”
And This time was different
Should one go back to the munificent lost decades, financial corporations were posting a 30 percent contribution to the SP total profits. One may, in light of this arithmetic, understand better the pro domo plea for better potential and a required expected gigantic bounce back in profits from the financial spheres.
Relax Menzie, it’s Obama.
The math is very simple. There is revenue, expenditure, and change in debt.
We have a data on all of these.
Obama’s view, in the budget you presented to us, shows Federal spending at 22.5% of GDP. It includes massive tax increases to 2015, corporate tax payments rising at twice nominal GDP growth, and Medicare and Medicaid spending well in excess of GDP growth.
But what Obama has actually demonstrated is a willingness to tolerate massive increases in debt; the claim that Obama is a fiscal conservative of some sort is entirely unsubstantiated by the historical record. Thus, with Obama we are left with high spending and either high taxes or continued rapid increase in debt. His historical preference is for debt, not fiscal prudence. Indeed, he is, by the plain numbers, the most fiscally irresponsible president in the history of the country.
With Romney, the target for Federal spending is 20% of GDP, 1/8th less than Obama. Romney has in the past proved his credentials in restructuring, whether corporate or institutional (Olympics). So he knows what this sort of activity is about.
Now, the question arises as to where Congress comes out. There is a “know nothing” faction there which does appear to have a non-math inclination. Can Romney find common ground with these folks? His waffling may undermine his mandate with Congressional Republicans and makes one wonder whether he has the stomach for the fight. For this reason, I would have preferred Christie–I know he’s capable of cracking heads.
However, if I am a Republican Congressman, I have a huge incentive to front-load the pain. If they don’t get the budget under control, then they will be deserted by their own voters in the mid-terms. So I would gamble that I am cutting into an expanding economy and voters will hopefully forget in two years the tax increases and spending cuts inflicted in January. So let’s see where things come out.
But any way I look at it, I want a change. I want a new management team in there, someone with at least some track record of private sector success and restructuring. The team needs a new coach.
In my opinion, oil importing OECD countries have been going increasingly into debt, financed by real creditors and by accommodative central banks, in order to keep their economies going, in the face of a doubling in annual global crude oil prices, from $55 in 2005 to about $111 in 2011/2012 (and US consumers are almost fully exposed to global crude oil prices).
And following is my latest explanation of why I think that Business As Usual is simply not possible. I think that we will have to bid farewell to a “Wants” based economy. I think that we are going to be lucky to maintain a “Needs” based economy.
And in my opinion, it is sheer fantasy to believe that we can maintain anything like the current level of government spending.
Some thoughts on Reserve to Production (R/P) Ratios, in regard to oil supplies
(Or why it’s much later than we think)
I’ve been recently running some numbers on Reserve to Production Ratios (R/P), i.e., EUR divided by most recent annual production.
In general I think that this is the key, and largely overlooked, problem that we are facing, especially in the context of the ratio of CNE (Cumulative Net Exports) to annual net exports of oil.
When we divide reserves by annual production per year, you get the number of years of production, at that production rate. Of course, this is somewhat of an artificial metric, given that production declines are inevitable, but it is nevertheless a useful metric. And of course, we are generally looking forward, i.e., dealing with estimated reserves.
But in general, we are replacing older long field life reserves, with high R/P ratios, with short field life reserves, with low R/P ratios, e.g., US shale oil plays. This of course leads to the “Red Queen” problem, where one has to run faster and faster, just to stay in place.
Note that slowly increasing production from unconventional sources like the Canadian tar sands play would be an exception to the generally falling R/P trend (but net oil exports from the seven major net exporters in the Americas fell from 6.1 mbpd in 2004 to 5.1 mbpd in 2011, inclusive of slowly rising net exports from Canada.)
Some net export numbers:
IUKE + VAM (Indonesia, UK, Egypt, Vietnam, Argentina, Malaysia):
The combined Six Country case history hit a production plateau in 1995, at 6.9 mbpd, with production ranging from 6.9 to 7.0 mbpd (total petroleum liqudis) for 1995 to 1999 inclusive. In 2001, production was only 6% below the 1995 production rate. These six countries, as of 2011, were all members of AFPEC (Association of Former Petroleum Exporting Countries).
Remaining Six Country post-1995 CNE (Cumulative Net Exports) at end of 2001: 1.8 Gb, annual of 0.73 Gb. RCNE = Remaining CNE.
Actual RCNE to NE ratio at end of 2001 was 2.5 (2.5 years of actual net exports at 2001 net export rate).
If we extrapolate the 1995 to 2011 rate of decline in the ECI ratio (ratio of total petroleum liquids production to consumption), the predicted RCNE to NE ratio at the end of 2001 was: 3.7/0.73 = 5.1 years.
In other words, the predicted Six Country RCNE to NE ratio was twice as optimistic, based on extrapolating six years of data, as the actual RCNE to NE ratio.
So, with that, let’s extrapolate some six year (2005 to 2011) GNE* (Global Net Exports) and Available Net Exports (ANE, or GNE less Chindia’s net imports) data.
For GNE, we extrapolate the 2005 to 2011 rate of decline in the Global ECI ratio. For ANE, we extrapolate the 2005 to 2011 rate of decline in the GNE/CNI ratio (ratio of GNE to Chindia’s Net Imports).
GNE:
Estimated RCNE to NE ratio at end of 2011:
347 Gb/16 Gb per year = 22 years
ANE:
Estimated RCNE to NE ratio at end of 2011:
87/12.8 = 7 years
In other words, using a methodology that was too optimistic–by a factor of two–for the Six Country case history suggests that at the 2011 ANE net export rate, the total remaining supply of cumulative net exports that will be available to importers other than China & India would be depleted in about 7 years.
*GNE = Top 33 net exporters in 2005, BP + Minor EIA data, total petroleum liquids
“Gap” Charts:
Global Net Exports, 18 mbpd Gap:
(2002-2005 rate of change: +5.3%/year; 2005-2011 rate of change: -0.7%year)
http://i1095.photobucket.com/albums/i475/westexas/GNE_02-11_Gap-1.jpg
Available Net Exports (GNE Less Chindia’s Net Imports), 17 mbpd Gap:
(2002-2005 rate of change: +4.4%/year; 2005-2011 rate of change: -2.2%year)
http://i1095.photobucket.com/albums/i475/westexas/ANE_02-11_gap-1.jpg
Yes, you can sell the product for a loss, if you make it up in volume.
Romney’s tax plan is similar.
It’s going to take bipartisanship to pass and implement a long run solution to our fiscal imbalance. Those plans are little more than a starting point for negotiation. (Although Obama seems to think that compromise means accepting his entire position, or you won’t get a seat at his table.) Obama’s rhetoric and actions guarantee he will not be able to acheive any level of compromise with a Republican dominated Congress.
Off topic: Anecdotally voting is very heavy in suburban MN this morning. I have no idea what that means for the candidates. Long lines, people coming into work late. Word out on the floor is people are glad it’s finally over! They are like shell-shocked survivors.
Many people reporting voting NO on the anti gay marriage ammendment. Do you vote NO then vote for Mitt Romney? Perhaps. Perhaps not.
Regards.
Small correction regarding the Six Country case history:
If we extrapolate the 1995 to 2001 rate of decline in the ECI ratio (ratio of total petroleum liquids production to consumption), the predicted RCNE to NE ratio at the end of 2001 was: 3.7/0.73 = 5.1 years.
I would think heavy turnover would tend to favor Obama. Romney’s better case scenario revolves around the enthusiasm gap, ie, that Republicans voted proportionately more than Democrats. If that proves untrue, the it would seem to favor Obama.
Heavy turnout probably ruins all the polls based on D+N, where N > 4 or 5. (And this is virtually all of the polls.)
If turnout exceeds 2008 it is likely to be driven by Republicans and Independents because it was sidekick McCain vs superhero Obama in 2008.
I can’t imagine a scenario where Democrats and Independents are more motivated to vote for Obama today relative to 2008.
Likewise, I can’t imagine a scenario where Republicans and Independents are less motivated to vote for Romney today relative to a lackluster McCain in 2008.
Thus, a large turnout should reflect a larger proportion of Romney leaning voters than Obama leaning voters.
Thus, a large turnout should reflect a larger proportion of Romney leaning voters than Obama leaning voters. EDIT: Relative to 2008
The various poll aggregators say this:
1. Electoral Scoreboard 2012: Obama 304, Romney 234
2. Princeton Election Consortium: Obama 303, Romney 235
3. FiveThirtyEight: Obama 313, Romney 225.
I’m curious to see if Nate Silver’s more elaborate methods do better than, for example, the much simpler Electoral Scoreboard. They basically take the median of all polls.
It’s very difficult to figure out which model works when it only applies to a limited sample. With these elections every 4 years and everyone working from the same polling data, it’s kind of hard to see which is better unless one can identify a specific failure. Given that the differences in projection turn on a few states going one way versus the other, we have little to differentiate the models.
Steven Kopits I want a new management team in there, someone with at least some track record of private sector success and restructuring.
Huh??? Why do you believe private sector experience is at all relevant? If anything presidents and governors with private sector experience have been pretty bad. Herbert Hoover comes to mind. In macroeconomics that private sector experience can be a real hindrance because business types typically view things from a “household” economics perspective. The only argument for private sector experience as a plus would be in executive skills, but Romney’s private sector accomplishments haven’t really shown us any executive skills. And the way he has run his campaign tells us that he is not very good at managing large organizations.
in the past proved his credentials in restructuring,
If Romney thinks our current economic problems can be fixed by “restructuring,” then Romney really doesn’t understand this recession. There may very well be structural problems with our economy, but those problems existed long before the Great Recession and fixing them won’t solve the immediate problem, which is weak aggregate demand. Again, this talk of “restructuring” reflects a businessman’s approach to macroeconomics. It’s just wrongheaded. The time to worry about structural problems is when the economy is pushing against the production frontier, not when there is a significant output gap.
Thus, with Obama we are left with high spending and either high taxes or continued rapid increase in debt.
Check the data. The deficit is coming down…and that’s not really a good thing. And in case you forgot, Obama actually cut taxes below the Bush levels. But if you think we can get to a balanced budget without tax increases, then you’re smoking something that will give you the munchies. As to spending at 20% of GDP…you need to ask yourself if you’re including transfer payments. If yes, then there’s no chance of that. Demographics dominate. If you’re not including transfer payments, then we’re already below 20%. Federal government spending (consumption and investment) accounts for 8% of GDP. Most government spending and investment comes from state and local governments (~12%).
Dear Professors Hamilton and Chinn,
I would value your thoughts about so-called Modern Monetary Theory, MMT.
Although I am an amateur economist, I see the central idea being that Uncle Sam (or any other currency issuing government) cannot run out of dollars. As long as Uncle Sam borrows in US dollars, he can always pay his debts or meet any other obligations.
Furthermore, banks loans are not limited by their reserves, which are merely accounts created and filled by the Fed to facilitate the clearing of transactions among banks.
I have learned what I know about this from the energetic, but chatty, Australian economist Dr. Bill Mitchell.
http://bilbo.economicoutlook.net/blog/
Thank you for your comments and thoughts.
Bernard Leikind
Encinitas, CA (near San Diego)
I forgot in my last comment another poll aggregator:
Votamatic: Obama 332, Romney 206
So much energy spent on analysing hypothetical budgets to be submitted by yet to be elected presidents – whee!
And we don’t know what form of kicking the can down the road the House and Senate will agree to with regard to the fiscal cliff? Or the political composition of both?
What is the point? Instead put your lips together, blow through them and flap them with your fingers as you blow. There now – don’t you feel better? Isn’t the noise fun? And just as useful?
Dr. Chinn,
Would you care to comment on how the recently passed Democrat-led Senate budget has responsibly addressed the deficit?
Professors Chinn and Hamilton,
As long as I am asking you to consider answering economics questions for an amateur, I have a few more.
If as part of its normal operations the Fed buys a T-bill, or some other debt instrument of Uncle Sam, does the Treasury Department pay the interest due to the Fed?
If a T-bill owned by the Fed matures, does the Treasury Department pay it off by transferring money from a Treasury account to a Fed account and receive the T-bill in return?
Do T-bills that the Fed owns appear as part of federal debt owned by the pubic? That is, does the Fed pay off Uncle Sam’s debt when it buys that debt? It seems to me that it does.
I read that the Fed is buying a significant fraction of the debt issued by the Treasury these days. Could the Fed just buy all of it and, thereby, solve the debt limit crisis?
I hope that you will consider this general line of questions worth at least a short expert blog post.
Congratulations Mr President. Now, what are you going to do about that debt mountain?
Chin & Hamilton
What would happen if the House gave the strong fiscal medicine of no increase in the debt limit, compared to the impacts of continuing $1 trillion/year deficits?
David Hagen-
I’ll tell you what would happen. Republicans, probably Boehner and McConnell, would get assassinated by leeches.