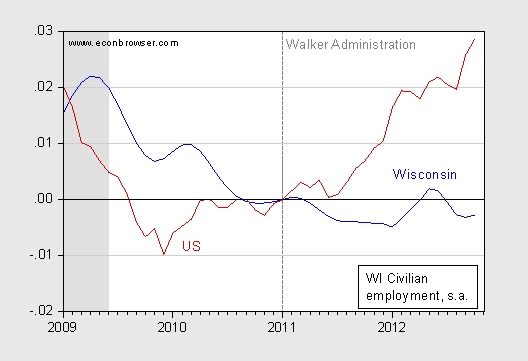
Civilian employment in Wisconsin is less than it was when Governor Walker took office in January 2011. In contrast, US employment is almost 3% higher.

Figure 1: Log civilian employment in Wisconsin (blue), and in US (red), seasonally adjusted, 2011M01=0. Source: BLS (October release).
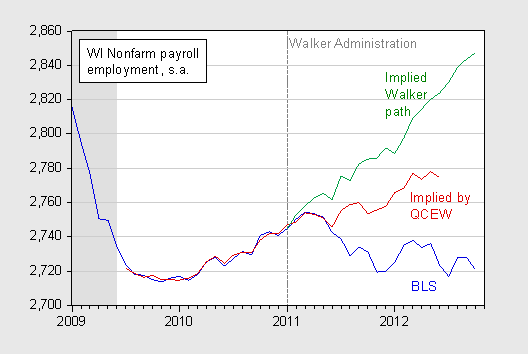
I do not usually focus on the household series, but since there has been some debate over the accuracy of the BLS state level establishment series [1] [2], I have decided to rely upon the household series to document Wisconsin’s poor relative performance. For purposes of comparison, the establishment series is depicted below.

Figure 2: Nonfarm payroll employment in Wisconsin according to BLS (blue), implied by relationship with Quarterly Census of Employment and Wages (QCEW) (see this post) (red), and path of nonfarm payroll employment promised by Governor Walker (private employment plus actual government employment) (green). Source: BLS (October release), DWD, and author’s calculations.
Note that even taking the QCEW numbers, nonfarm payroll employment is only 1.1% above 2011M01 levels, instead of 0.8% below (log terms). If the BLS trend through 2012M10 is correct, then even taking the QCEW numbers means that October employment is less than 1% above 2011M01 levels. In contrast, US nonfarm payroll employment is 2.5% higher.
In one sense, the divergence in trends is not surprising. Cutting government spending when the exchange rate is fixed usually leads to contraction relative to trend. [3] See also [4]
im not a fan of unemployment rates from the household survey, but BLS did show a decline in the rate for wisconsin (covered by the media) from 7.3% to 6.9%, and wondered what your thoughts were…
http://www.bls.gov/news.release/laus.nr0.htm
Menzie
Your interest in Wisconsin is certainly is understandable, you live there. But are you telling the whole story? I noticed this statement in the October BLS news release. “Fourteen states reported statistically significant over-the-month unemployment rate decreases in October. The largest of these occurred in South Carolina (-0.5 percentage point), followed by Alaska and Wisconsin (-0.4 point each).” That certainly sounds encouraging for your state.
http://www.bls.gov/news.release/pdf/laus.pdf
But I live in Colorado. Democrats have been in control before and throughout the crisis. One such policy developed has been to improve public employees ability to begin to form unions, opposite of Wisconsin. But as best as I can read statistics, Colorado has performed worse than Wisconsin. After topping out close to Wisconsin’s level at the worse of the time of crisis, Colorado’s unemployment rate has remained above or at the national rate, and continues to be higher than Wisconsin. I believe, unemployment rate was 8% in the October release.
Perhaps a comparison using your special statistical emphasis on Colorado would be informative in comparison.
Congrats, Menzie.
You’ve had Walker’s number from the very beginning and now the data is proving that you were right.
I can’t wait to read the idiotic comments from the people who have criticized you on this blog.
They’ve been wrong about everything, but not one of them is man-enough to admit it.
Why pick on Wisconsin alone. North Dakota has a similar pattern for the past six months [May-Oct]. You know, North Dakota with that staggeringly unemployment rate of 3.1% [up from 3.0%]. That’s similar to Wisconsin’s unemployment rate pattern which is 6.9% [up from 6.8%].
Those are so much worse than the U.S. average unemployment of 7.9% which is down from 8.2%. And look at California’s booming economy which has improved its unemployment rate to 10.1% from 10.8%.
What IS the matter with Wisconsin and North Dakota that they can’t improve on their unemployment rates? It must be those conservative politicians and those oil companies. If they could only raise taxes the way California has, everything would be just wonderful. Why can’t we all be like California?
Bruce Hall: All I can say — thank goodness no critiques of using log scales which display a massive ignorance of mathematics this time around! Besides a comment on the unemployment rate (the ratio of two variables), do you have any insight on the divergence of employment trends, which is the topic of the post?
Of Wisconsin’s top 10 employers 6 are government agencies. The other 4 are one is health care which might as well be government then three retailers. Obviously Wisconsin has a bloated government labor force.
Wisconsin’s productive economy is primarily manufacturing equipment. With the reelection of President Obama, manufacturing will probably continue to decline.
It is highly probable that the public unions will increase their power and their take from the public trough. This will drive productive businesses out of Wisconsin.
Those of you in Wisconsin hold on to your seats. You are in for a rocky ride and a continued decline in employment.
How much has WI spending on social services and the like contracted? Has it contracted “more” than in other states? Has the cutting hit more areas that fund private services?
That is, much government spending is money for private companies to deliver services. This can be anything from buses for old people to education to nursing, etc. Cut that spending and private employment drops.
But if we remember the main “political” point of the WI GOP revolution, it was that changing policy would make a clear difference that would be noticeable quickly. That has not come true, which makes my point that most of this stuff is just argument with much less real world impact than imagined by partisans. There is no magic method for attracting business. Have a bad location, declining industry, etc. and you will not overcome that through policy.
Menzie, the country’s unemployment rate has bounced around with a slight downward trend from a fairly high level… ditto for California. Perhaps the states of Wisconsin and North Dakota have achieved “situational full employment” given the national conditions.
Wisconsin, unfortunately, can’t improve the national demand for Harleys and cheese and doesn’t have North Dakota’s or California’s oil resources [which California is proud to not exploit].
Looking back, Wisconsin didn’t fall as badly as the nation or tax and spend states like California, so it is reasonable that its recovery should have plateaued earlier [after rising earlier].
I haven’t investigated the data, but wonder what Wisconsin would look like extracting the city of Milwaukee and how Michigan, for example, would look like extracting the cities of Detroit, Flint, Pontiac, and Benton Harbor… bastions of liberal politics. I have my suspicions how that would look.
Menzie, I don’t believe I have ever criticized the use of logarithmic scale graphs which are quite useful for displaying rates of change. What I do take issue with is using such charts to compare rates of change when the bases are significantly different.
Comparing the rate of water filling an empty glass to water filling a full glass might be “unfair” to the full glass while giving undo “credit” to the empty one. [and, no, I’m not suggesting that there is fixed limit to an economy, but there is a practical limitation given the external factors influencing it and the economic activity you select as your starting point.
Here in Michigan, the rate of employment growth has been pretty good, but no one would trade a healthy economy for the one we have had for 5 years just to claim that our rate of employment growth was strong.
Bruce Hall: But your statement clearly indicates you thought that use of log scale would accentuate the upward slope of the temperature anomaly, which (as 2slugbaits clearly highlighted) displays a complete and utter ignorance of what logs do, thereby throwing into doubt any inferences you make of a quantitative nature.
Menzie, I presume you are referring to this comment:
A weather event is not climate nor proof of specific change. 16 years of flat global temperatures may be considered significant with regard to a climate trend… may.
http://clivebest.com/blog/?p=4237
Even using log-scale charts, you’ll still come up with a flatline for warming.
You obviously did not look at the data to which I was referring. My little dig regarding log-scale charts was pointed at all of the back-and-forth on that issue… which in this case was irrelevant because the data was a flat line trend.
So, I’ll presume you have a lot of reading with your day job and ignore the “displays a complete and utter ignorance of what logs do” nonsense. Having investments, I do like to use the log scale charts rather than absolute scales because it is easier to make comparisons over time as values change. Just thought I’d give you a hint.
Bruce Hall: Excuse my befuddlement, but the phrase “Even using log-scale charts…” seems to indicate that even if one resorted to using logs, it would appear flat. I don’t know why you’d need to say “even” if the curve is flat, since a log transform doesn’t steepen a flat curve. But I’ll just chalk it up to my inability to understand how you communicate.
Menzie-Please keep telling this story. Walker has been an unmitigated disaster for the state of Wisconsin. It pains me that Walker has managed to completely destroy this wonderful state and no one seems to be holding him accountable. This is not the Wisconsin I know. AT first I thought Walker would make Wisconsin into a parody of one of the poorer U.S. states, but now I think he is determined to somehow make Wisconsin into a U.S. financial version of Greece.
Menzie, Did you get the graph I emailed you showing how the natural rate of unemployment has jumped 3%?
It is based on the equation…
UT = u – cu + cu(ls)
UT is an index of total unused available capacity of labor and capital.
u = unemployment (unused labor)
cu = capacity utilization (used capital)
cu(ls) = availability constraint on capacity utilization as a function of labor share of income.
When unemployment is plotted (dispersion) against the UT values since 1967, there is a clear upsloping cloud with a y-intercept between 4% and 5%.
unemployment = 0.23 * UT + 4.5%
r2 = .63
The y-intercept was the natural rate of unemployment, where capacity utilization and unemployment stop moving and it seems like a full employment situation. It is really reaching the limits of available capacity as constrained by the labor share of income.
Since January 2010, the plot shifted up to form a new line in territory never seen before…
unemployment = 0.2 * UT + 7.7%
r2= .9
7.7% is now the approximate natural rate of unemployment. This has wild consequences for the economy, like recessions with greater amplitude.
The prediction is that unemployment nationwide is not going below 7.3%. The economy is right now close to the zero lower bound of its unused available capacity in terms of labor and capital. This means that unemployment is not going down much anymore. You will see.
You might think the US unemployment is good and will continue to get better, but just wait. It is not going as far down as you seem to think.
Bruce-
Ha. Touche.
Wisconsin unemployment was unnaturally high pre-Walker. Sorry reality sucks when you can’t leech of the Govt/Union teat.
To the loser is that posted at 7:10am- What are you talking about? Wisconsin unemployment was 7.6% when Walker took over in January 2011 while the U.S. was at 9.1%. It was unnaturally LOW. The real credit goes to the governor before Walker, who got unemployment down from 9.4% to 7.6% in a year.
I can show you the evidence that Walker policies have cost Wisconsin 100,000 jobs, as that’s how far behind the U.S. pace we have been since this guy took office. I can also show you plenty of Philly Fed surveys and per capita income stats that also show how Wisconsin was fine before Walker, and sure isn’t fine now.
Notice that Walker’s supporters are rich jag-offs and out-of-staters? Those of us who actually LIVE AND WORK IN WISCONSIN know the facts, and know better.