Revisions to some of the key indicators bring us back to the same old story– the U.S. economy continues to grow, but at a slower rate than any of us would like.
The Bureau of Economic Analysis released on Thursday a revised estimate that U.S. real GDP grew at a 2.7% annual rate in the third quarter, up from the initial estimate of 2%. So things are better than we thought? Not really.
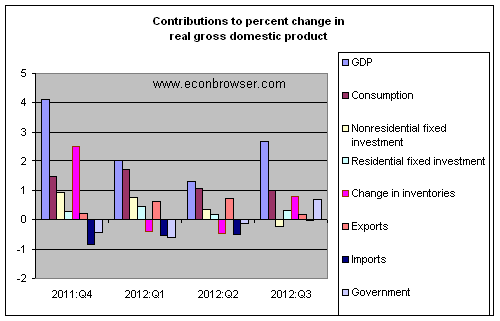
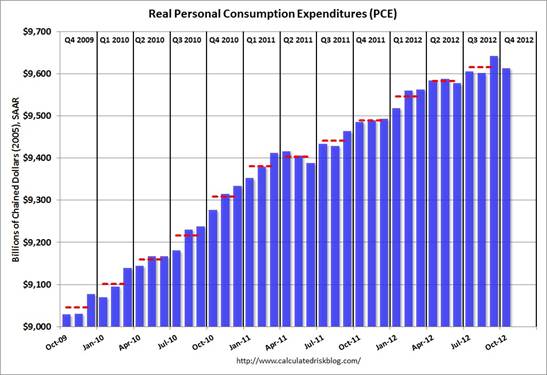
The revised figures do show an improvement of 0.4 percentage points in the contribution of exports, which are now claimed to have added about 0.2 percentage points to the 2.7% growth figure instead of subtracting 0.2% as originally reported. But this was erased by a 0.4 percentage point reduction in the contribution of consumption spending. More than all of the reported improvement from 2% to 2.7% GDP growth could be attributed to a higher rate of inventory accumulation than previously estimated. To put it another way, real final sales for the third quarter were originally reported to have grown at a 2.1% annual rate, whereas the new numbers have the figure at only 1.9%. The bottom line is that growth in demand for U.S. goods and services overall remains weak, even weaker than originally reported.
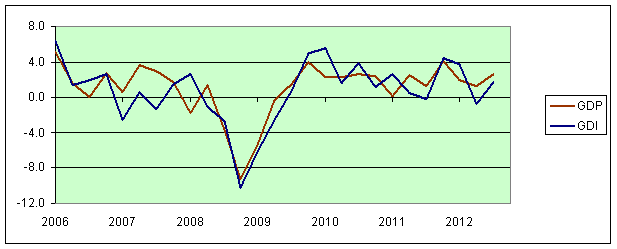
The new BEA report also gives us the first look at an alternative estimate of third-quarter GDP that is built up from separate data on the income people are earning rather than goods and services being produced. Conceptually, an estimate of GDP constructed using either method should produce the identical number. But in practice, one arrives at different numbers using different data sources. With this second GDP release, the BEA begins to report the “statistical discrepancy” between these two calculations. Fed economist Jeremy Nalewaik maintains that if one subtracts this statistical discrepancy from reported GDP, the resulting series (sometimes referred to as gross domestic income, or GDI) may offer a slightly better indicator of the state of the economy, particularly around business cycle turning points. The bad news is that, according to GDI, the U.S. economy only grew at a 1.7% rate in the third quarter and actually fell at a 0.7% rate in quarter 2. My personal preference is to average the GDP and GDI growth rates, which calculation would tell us the U.S. economy grew at a 0.3% rate in the second quarter and 2.2% in the third, with about 0.8 percentage points of the latter representing inventory accumulation.
 |
Another important and more favorable set of revisions were those accompanying the BLS employment report released at the start of November. In addition to reporting healthy job growth for October, this report revised up the numbers initially given for September and August. I predicted that these employment revisions would in turn lead to a substantial revision in the recession probability index maintained by University of Oregon Professor Jeremy Piger, and indeed they did. Perhaps you remember this graph, which represented the value of this index based on data available as of October 29, and was subject to widespread misinterpretation.
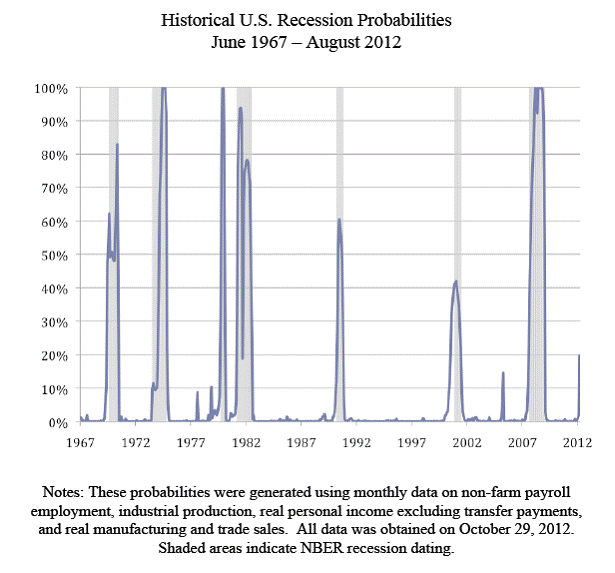 |
Professor Piger has just updated this chart, and here’s what it looks like today:
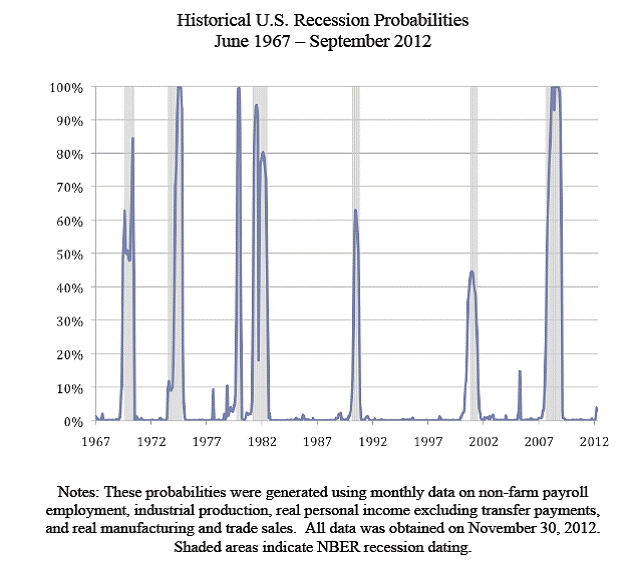 |
I wonder how many of the outlets that trumpeted the first figure will now be faithful and objective enough to report the update?
Similarly to the GDP-based Econbrowser Recession Indictor Index, Piger reports the inference with a 2-month delay to allow for data revisions and trend recognition. For example, the first figure above used data through October 29 to calculate where the economy was as of August. However, that inference is influenced by the data on hand as of October 29, which showed weak employment growth for August and September. As new, more favorable data for August, September, and now October became available, the inference about August became more optimistic. Note that, by contrast, the Econbrowser Recession Indicator Index (currently at 7.9%) is intended as a pure real-time summary and is never revised.
But some weaker data may be in store for us. Hurricane Sandy ([1], [2]) may well depress the next employment report due out Friday. Last week’s Regional manufacturing surveys and various housing measures all suggested some weakening, and consumption spending is starting the fourth quarter down from the month before.
 |
Then there’s the fiscal bluff. I am not optimistic this is going to be resolved before January, and worry that the uncertainty itself is starting to affect the investment and hiring decisions of firms uncertain about their sales and spending decisions by consumers uncertain about their taxes.
So my expectation is that below-average growth rates for the U.S. will continue.
The 2-qtr. annualized rate of real private final sales is again decelerating below 2% from near 3% during the previous 5 quarters and from the 4% cyclical peak so far to date.
The 5-year real private final sales per capita rate is still negative, and the 10-year rate continues to trend below 1%. The average of the 2-qtr. annualized and 5- and 10-year rates has markedly decelerated again to the level in ’08 when the economy had already entered recession, and at or below the rate of every recession since the 1950s.
Autocorrelation spectral anlaysis of real GDP and real GDP per capita going back as long as there are reasonable estimates indicate an average ~40-month business (Kitchin) cycle, as well as a ~70-month stock market cycle.
Real private final sales (2007 = 100) appear to have peaked for the cycle with stock prices and corporate profits, and the change rates suggest that the economy is already in recession, or soon will be.
Hurricane Sandy and the fiscal cliff, fiscal bluff, or fiscal black hole will not be the cause of a US recession, because secular demographic, debt-deflationary, and cyclical global forces were already exerting a drag on very slow trend real GDP per capita in any case.
Economists will not see the recession coming, just as they never do, at least not so as to say so publicly.
Global resource constraints and demographic and fiscal drag effects will only exacerbate the next global cyclical contraction.
The 70-month average change of the S&P 500 and the 5- to 6-year real change of the S&P 500 during secular bear markets since the 1880s implies that another cyclical bear market for stock prices is imminent, lasting into a trough for profits and stock prices in ’14 to as late as ’15.
Ultimately, the only way out of the once-in-a-lifetime Long Wave debt-deflationary depression is by way of time; asset liquidation/financial capital consumption; debt write-offs, restructuring, and/or pay down; large-scale capacity consolidation, asset spin-offs, jettisoning lines of business, and depreciation; and the Boomers getting out of the way for the Millennials to come of age and exert their desires and demands on the establishment status quo to remake the system in their image out from under the Boomers’ shadow.
The faster debt is written down to wages and production, and asset prices decline to levels that again encourage investment in labor returns versus speculative financial instruments, the sooner the debt-deflationary regime resolves and the economy can settle at a sustainable level of real GDP per capita. We’re not even close.
There is a large democracy in the ability given to the economists to make representations and select their suitable variables and their indexes at a given time.
That is,the CPI consumers price index and that is worth looking at it since its inflexion point as of 2010.
Fed St louis
Consumer Price Index for All Urban Consumers: All Items
The ADS business indicator has proved to be a timely and reliable indicator.
Professor,
With no growth in sight, and mounts of digital money to be created all over the world, is it time to rush to gold?
Most economists advise that extraordinary measures (ZIPR and printing) should stop when economy starts growing again. However, satisfactory growth has not happened in the past 4 years, and it appears unlikely to materialize for many years to come.
The Federal Reserve alone promises to print one trillion dollars next year. All other central banks must follow the suite. In reality, with huge debts and deficits there is a little choice for Western governments but to print.
How many years of trillion dollar deficits be monetized with little or no inflation?
I think it’s important to keep in mind that Republicans are unlikely to vote for tax increases without something substantial in return—and this does not appear to be in the works.
As neither Republicans nor Democrats appear keen to renew the payroll tax holiday, this is likely to expire. The Bush tax cuts, however, will be all-or-nothing for the Republicans, so Democrats will either have to renew all or let all lapse. They may choose to renew the whole package.
If so, then ironically, it will be the salaried, not the high earning classes, who will cough up the “down payment” on deficit reduction. Thus, the Obama administration will be faced with either a regressive payroll tax increase, or a wide-scale tax increase.
I prefer the fiscal cliff. I am concerned that even Obama supporters–judging from my wife and brother–have no idea of the magnitude of necessary tax hikes. If a small hike is enacted, these folks will think they have done enough, when in fact–and as Rich Berger has pointed out–the likely net raise of higher taxes on the top 4% are likely to produce on the range of half of nominal expectations–say $80 billion–due to tax avoidance measures. But that’s still $10,000 in increased taxes on an income of $250,000. Not chicken feed at all.
(To Rich’s point: I would point to the UK millionaires tax as just one example: http://dailycaller.com/2012/11/28/as-uk-millionaires-flee-country-over-tax-hikes-british-treasury-loses-billions/)
In any event, a $10k increase on a $250k income will close the deficit by less than 10% even as the top tax paying classes will believed they have “paid a bit more”. The consensus for further increases on the wealthy–even among Democrat supporters–might well not exist.
Thus, if we’re going to raise taxes, let’s go all in–payroll and Bush–and bite the bullet, because I sincerely doubt in can be done in smaller steps. Even the Democrats won’t support subsequent raises for at least 2-3 years.
And if we fail to raise revenues (as a first step), the US will be on the path for a financial crisis somewhere from the middle of the decade.
There was a lively exchange on incomes two posts ago. Here, I’d like to comment on the role of financial aid in the budgets of well-to-do households:
Tax Increases and the Impact on Private and Public Schools
I’d like to explore the impact of tuition pricing discrimination and tax increases on households receiving financial aid, and the implications for the educational system.
In Princeton, the typical private school charges $25,000-$30,000 per year, figure $100,000 for three children including sundries (books, uniforms, sports gear, etc.). This translates into about $150,000 of pre-tax income. Thus, after education expenses, someone making $250,000 would have $100,000 pre-tax income left for all non-school related expenses.
Housing can comfortably cost $5,000 per month. Taxes alone on a typical house would be $15,000. Thus, an additional $100,000 pre-tax income would be spent on housing alone, and the household would have literally not enough to feed, clothe or transport its members.
To make the numbers work, private schools discriminate on pricing, such that a household with $250,000 in income and three children in private school might expect then to receive “financial aid” from the schools in an amount of something less than half nominal tuition. Thus, by the standards of private schools in Princeton, someone earning $250,000 per year counts as “poor” in the sense of having to obtain aid to keep children in private school—odd as this may seem.
Now, this financial aid is essentially conditioned on sweeping all other income from the family’s budget. Thus, financial aid is yearly means tested and the maximum amount extracted from the family budget. As a practical matter, this means that there is very little discretionary cash left in the household. And over time, in an era of rising prices and stagnant wages, this means the schools manage to extract incremental gains from the household budget. As a consequence, well-to-do but not Top 1% households with children in private school will tend to have discretionary spend capability inferior to that of, say, a single person making a quarter of the income. The very nature of financial aid means that all marginal cash largely finds its way to tuition payments.
As a result, households with incomes in, say, the top 15-20%, but not in the Top 1%, face marginal rates of public and “private” taxation that approach 80% or more. If one’s salary were to increase by $10,000, approximately $4,000 would go to state and Federal taxes, and an additional $4,000 in reduced financial aid. In Princeton, with the parameters stated above, this situation would persist to an income in the $300,000-$330,000 range. Thus, someone making $320,000 in Princeton could conceivably have children on financial aid, bizarre as this may seem.
Above this threshold, however, the effective “tax rate” drops back to about 42% (35% Fed + 7% state). Therefore, once clear of the financial aid vise, a large share marginal income is largely captured by the household. But for those households with incomes between, say, $100,000 and $300,000, the effective marginal rate of “taxation”—if they have children in private school—is about 80%.
*******************
Making a serious dent in the Federal budget deficit will require a meaningful contribution from not only the Top 4% ($250,000+), but from the Top 20%, at a minimum. I would estimate the expiration of the Bush Tax cuts and the payroll tax holiday to be on the order of $14,000 for a household like ours.
For those with children in private school, the decision will be stark. By design, financial aid schemes sweep all surplus cash from the household budget. Thus, when faced with a material increase in taxes, the only available means to meet this call for families with solid incomes and children receiving financial aid is to transfer this burden either to the private school (ask for more aid) or to withdraw their children and put them into public school. In many schools, the percent of students on financial aid can reach 40% or more of the student body.
Transferring these students to the public school system is not without cost, either. In Princeton, the average elementary and middle school student requires $18,000 annually to educate in the public school system. Thus, every child in private school is effectively a transfer—a “reverse tax expenditure”—of $18,000 to the local municipality. There is, in fact, no greater subsidy to the government than the choice to educate children privately. For three children, this would save the local government $56,000 in annual education costs—equal to about 60% of the total tax bill (state, federal, and real estate taxes together) for a family making about $250,000 per year. Thus, one result of an increased Federal tax rate on upper incomes would be burden shifting to the local school district.
To be clear: I am not suggesting that $250,000 makes one poor. Nor am I suggesting everyone should go to private school, or that people with good incomes shouldn’t pay taxes. I am, however, arguing that families with good incomes and children on financial aid will have discretionary spending associated with middle or even lower middle incomes. The nature of means testing and financial aid almost guarantee this outcome.
Further, it would appear that nominal tuitions have followed the stretching of incomes, and are now attenuated to such an extent that even households in the Top 2% of incomes—exceeding $300,000 per year—might be expected to have children on financial aid in the high income coastal states. This particular structure means that negative shocks to income—for example, substantial tax hikes—will tend to be transmitted almost directly into the educational system for such households, as the substantial cost of education and the nature of financial aid imply that reduced educational spending will be the primary means by which such households can reduce expenses to meet increased tax obligations.
John Hussman’s take:
http://www.hussmanfunds.com/wmc/wmc121203.htm
So, if the US economy cycles into recession, how are the Keynesians going to explain it, exactly?
Trillion dollar deficit, QE at full throttle, not a bubble (except govt debt) anywhere, and the economy cycles into recession? How is that?
As I have commented before, most of the papers written on oil shocks (including Jim’s) look at the response under conditions of price inelasticity. We have to do some more work on the response of the economy under conditions of elasticity.
It’s that efficiency thing.
Steven, tangentially to your points, the spending of the top 1-10% of US households accounts for approximately 15-33% of GDP, and 40-45% of GDP for the top 20%.
Wealth and income are so concentrated to the top 1-10% (85% of financial wealth and nearly half of income), and tax receipts and GDP dependent upon the wealth and income of the top 10%, that any net increase in taxes on the top 10% will be a direct hit to current and incremental consumer spending.
Thus, any gain in annual fiscal deficit reduction will be offset by a larger net loss of consumer spending, which itself will not permit gov’t spending to increase.
It’s like using one’s meager after-tax pay raise to make modest larger or additional payments to reduce one’s credit card balance with no additional net income after tax and debt service to increase one’s spending.
In the meantime, total local, state, and federal gov’t debt is at 140% of private GDP, total compounding interest to term for total credit market debt owed is at 100% of private GDP, and total gov’t spending is now an equivalent of 100% of private wages.
IOW, tweaking marginal federal tax rates to reduce the annual fiscal deficit will not increase real GDP per capita, nor will it eliminate the local, state, and federal fiscal cliff, i.e., the debt Jubilee constraints, only perhaps imperceptibly slow the rate of acceleration towards the cliff while risking one or more of the wheels falling off the magic bus (or crazy train) in the meantime.
In simple terms, the Obama Tax Hikes will reduce employment and income growth to the point where tax revenue will fall even though rates are higher.
Steven, There is very little room for improvement in unemployment and capacity utilization. My calculations show only 2% points for both combined. That means that if unemployment improves by 1%, capacity utilization can only improve by 1%. This is a strict limit of production in the economy and exists separate from government. I use my own equation to know this.
The natural rate of unemployment has also shifted up to around 7.5% according to my calculations.
I am a Keynesian but I can explain a recession very easily using the dynamics of factor utilization (capital and labor) in the economy.
Shorter Steven Kopits: “After I have spent all of my money on rich-people stuff, I don’t feel so rich anymore. I’m just as poor as poor people.”
It’s not that disagree, gents. But historically, US Fed spending has been in the 18.5-20.0% of GDP range. Do I think we’ll get spending under that level, even under a Tea Party government? No, I don’t. (We could, of course, if we paid politicians for performance, but that’s another story.)
So I think we need to get revenues back into historical ranges.
I think this is also very important for behavioral reasons. Many coastal liberals–Top 1%-ers–supported Obama, because they didn’t feel the cost of his largesse. Once they have to pay for all this stuff, we’ll see what their appetite for big government actually is.
“Many coastal liberals–Top 1%-ers–supported Obama, because they didn’t feel the cost of his largesse. Once they have to pay for all this stuff, we’ll see what their appetite for big government actually is.”
Yes, indeed, as well as the many who have been hired in DC at $100,000-$150,000 salaries or higher who are doing nothing useful to justify such positions during a time of fiscal constraint and the bottom 90% sucking hot wind and eating hope.
Regarding largess, however, note that federal spending for fiscal years ’11 and ’12 did not grow, largely because of imperial war spending being reduced and unemployment insurance payouts falling.
But that will change during the next recession when the fiscal deficit will reach and exceed 100% of federal receipts after Social Security and Medicare receipts and the U rate characteristically increases 50-100% and profits/GDP fall from the record 11% today to 4-5% at recessionary troughs, as is the historical precedent.
No matter what is done, the fiscal cliff awaits the accelerating crazy train of debt, slow or no growth of real GDP per capita, and once-in-history Boomer drag effects. All aboard for the fiscal train wreck! Tickets are free, but the actual cost of the ride may be your life.
Steve, in general I agree with you, but I’d be careful about using federal spending divided by GDP as a good measure of the size of government.
Since we’ve had sub-par GDP growth for several years now, we’re far away from potential GDP, and the denominator of that fraction is smaller than what it “should” be. Plus the numerator is inflated because of unemployment and welfare payments. So I think it’s hard to draw many conclusions from spending as a percent of GDP right now.
I’d love to see spending get down to 18 or 18.5% of GDP. Trimming discretionary spending won’t be enough to get us down there. We need to get GDP higher. We need better growth!
My main concerns:
We probably should get tax revenue back to historal norms.
.Income tax rates don’t make much of a difference for a fiscal consolidation.
.Elimination of dead weight loss of tax structure should be the primary mechanisms for raising revenue (considering GDP growth a given).
.Though it historically doesn’t matter whether spending is done with debt or tax revenue, I believe that our high interest cost despite such low rates and our reliance on the Fed (iirc, the Fed can sustain current policy for less than 10 years, however, it would need to ease more to keep rates low without spending reduction) and gullibility of foreigners to keeps interest rates at safe levels put us in a very dangerous state. What exactly is the treasury sensitivity to demand? A very small change in interest rates could spell disaster for our budget.
Spending is by far the most important factor in successful fiscal consolidation.
I believe the Keynsian window closed after Q1 2009. Spending to keep us out of recession is a fantasy. We a sacrificing long-term growth to keep up appearances. I’d rather see a technical recession so we can return to a more normal growth path than continue this zombie state.
Steven Kopits:
$5,000 a month on housing? Are you drunk?
http://www.redfin.com/NJ/Princeton/261-State-Rd-08540/home/36693817
I don’t think that requires $5,000 a month. 4 bed, 2 bath. Plenty of room for your 3 little 1%ers!
Anon, there never was a “Keynesian” window nor is there a attempt at it.
One of the reasons for the accelerating 3rd quarter GDP is Wall Street’s credit machine. Without, you have no growth.
The financial transfer mechancism vis Wall Street is everything. I mean, everything.
Econtalk podcast: Casey Mulligan of the University of Chicago and the author of The Redistribution Recession, talks with EconTalk host Russ Roberts about the ideas in the book. Mulligan argues that increases in the benefits available to unemployed workers explains the depth of the Great Recession that began in 2007 and the slowness of the recovery particularly in the labor market. Mulligan argues that other macroeconomic explanations ignore the microeconomic incentives facing workers and employers.
Aaron, you cite Casey Mulligan? The guy who claims that 20 million workers suddenly decided to consume more leisure time by going on vacation. The guy who implies that soup kitchens caused the Great Depression? This is supply side economics on LSD.
You should actually listen and read the work. You’re embarrassing yourself with such knee-jerk, vacuous, propaganda.
Such statements are gross mis-representations of his work.
@Nick:
Crunching the numbers on the $465k home, assuming a 30 year mortgage with a 10% down payment, interest rate of 4%, taxes at the princton township rate (1.787% effective rate), and home owner’s insurance of $1,000 per year, the mortgage payment comes out to just $2,853.78.
http://cgi.money.cnn.com/tools/mortgagecalc/
Property tax rate info here:
http://www.princetontwp.org/MC_tax_rates.pdf
A quick check of the same site shows a few comparable homes in the same zip code listed for that price or less, and expanding the search into Mercer county (from just the township) you could have a comparable family home for around half that if you wanted to. And that’s just off of one listing site.
I couldn’t find much data on private school tuition but my gut tells me it’s probably possible to economize there as well.
@Steve: Do you think some of your assumptions might warrant reconsideration? It seems implausible that any family making $250k would be in the situation you posit, vis a vis barely making ends meet, except by choosing to live beyond their considerable means.
@Steven Kopits:
Additionally, perhapse the well-to-do-but-not-rich should not try to compete for status goods like spots in exclusive private schools with people much richer than they are? Would that not be one way to resolve the financial aid dillema?
@Rodrigo
Thanks for running the mortgage numbers. I was too lazy, but $5,000 a month on housing is just nuts. I guess you really do need at least a half acre, 5 bathrooms, 6 bedrooms, a media room, a 3 car garage and an outdoor pool to survive in Princeton.
And in regards to competition at private schools: @Steven Kopits just has to send those kids to private school! Where else would they get private tutors and admissions coaches to get them into 3rd or 2nd tier liberal arts schools, when their SAT and ACT scores aren’t quite up to the mark? After all, if they were in public school, they would be doomed to Rutgers, Penn State, or the University of Maryland. As long as they’re in private school, they’re guaranteed admission to at least Gettysburg or maybe even Bucknell!
There are many reasons to send a child to private school. My personal tastes run to the brainy, but no doubt many families there are wealthy. Not all wealthy families are brainy; not all brainy families are wealthy.
I have had my children in both public and private schools in Princeton, and therefore have experience with both systems. Both systems have excellent students; indeed, I might give an edge to the public schools in this regard as they tend to have a good number of faculty or otherwise university-related children.
The difference is in the demeanor of faculty and staff and their attitude towards parents and students. That’s because a public school is a cost center; a private school is a profit center. If you’re a cost center, every additional student is just a chore. They hurt, rather than help, the economics of the school. If you’re a profit center, you know parents are making huge sacrifices to have their children there, so you want to make them feel good. Every additional student is a resource; at the same time, the school is under no obligation to take more students than it can handle.
These differences become part of respective cultures over time.
I personally would like to see more people attend excellent schools. In Princeton, it probably costs less to educate children in fancy private schools than in the public ones. So, in fact, it is the public school kids who are going to the expensive schools–they are just not getting their money’s worth.
This situation could, of course, be easily remedied with a voucher system. If the money follows the student, the schools will be profit centers, and public schools will in effect begin to behave like private schools. The money is already there; it’s more a matter of incentives.
“In Princeton, it probably costs less to educate children in fancy private schools than in the public ones. So, in fact, it is the public school kids who are going to the expensive schools–they are just not getting their money’s worth.”
http://en.wikipedia.org/wiki/Princeton_Public_Schools
According to the NJ Dept. of Ed. 2009 Spending Guide, the district spent $17,290 per pupil and the state average was $13,632. You estimated above that private school tuition runs $25,000 to $35,000 per year, so it seems like educating students in good public schools costs substantially less than doing it in private schools. Also, the system seems to include a healthy subsidy for the children of the well-to-do-but-not-rich, whose parents mostly pay less in property taxes than the cost of their educations.
It almost seems like sending your kids to good Princeton public schools is a much better value than paying $30k per head to attend private schools, the benefits of exclusive status and connections notwithstanding.
I’ll ask you again more directly – do you think some of your assumptions in this discussion need rethinking? Does it provoke reflection that the factual elements of your examples turned out to be wrong in ways that undermined your arguments?
Why are you so rigorous in your thinking about work (I read your oil posts) but so fuzzy in your thinking about things like this?
Kopits: “In Princeton, it probably costs less to educate children in fancy private schools than in the public ones.”
Princeton School District, which has about 30% higher spending than the average New Jersey school district spends $17,300 per pupil, which is significantly less than the $25,000 to $30,000 you claim for private schools. Those costs include teachers, administration, operations and maintenance.
Note that public schools include the cost of providing services for special needs children with cognitive and behavioral disabilities, blindness and deafness. Further note that private schools are subsidized by taxpayers through sales and property tax exemptions.
Dr. Hamilton:
Sometimes I get the sense that elaborate posts with all sorts of data being referenced and great charts are based on this:
http://dilbert.com/strips/comic/2012-12-05/?utm_source=feedburner&utm_medium=feed&utm_campaign=Feed%3A+DilbertDailyStrip+%28Dilbert+Daily+Strip%29
😉