I attended the American Geophysical Union meeting in San Francisco two weeks ago at which I heard a very interesting presentation by David Hughes of the Post Carbon Institute. He is more pessimistic about future production potential from U.S. shale gas and tight oil formations than some other analysts. Here I report some of the data on tight oil production that led to his conclusion.
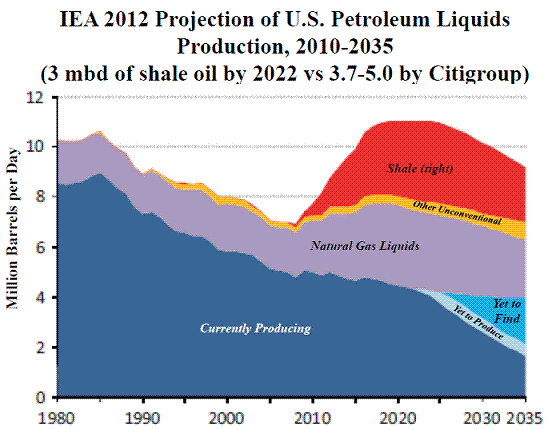
A number of analysts have issued optimistic assessments of the future production potential of U.S. shale or tight oil. For example, the International Energy Agency recently predicted that the U.S. would be producing over 10 million barrels per day of oil and natural gas liquids by 2020 before resuming a gradual decline. Citigroup is even more optimistic.
 |
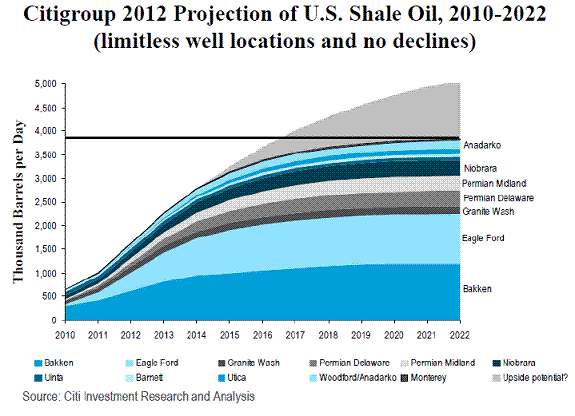 |
David Hughes has been studying detailed data on each individual well in shale gas and tight oil formations in the United States as part of a study that will be released by the Post Carbon Institute in February. The most successful new oil-producing region is the Bakken in North Dakota and Montana, which currently accounts for 42% of the U.S. tight oil total and accounts for about 1/5 of the tight oil production that is projected by Citigroup for 2022. Hughes finds that once output from a typical Bakken well begins to decline, within 24 months its production flow is down to 1/5 the level achieved at its peak. This is in line with estimated decline rates separately published by the North Dakota Department of Mineral Resources.
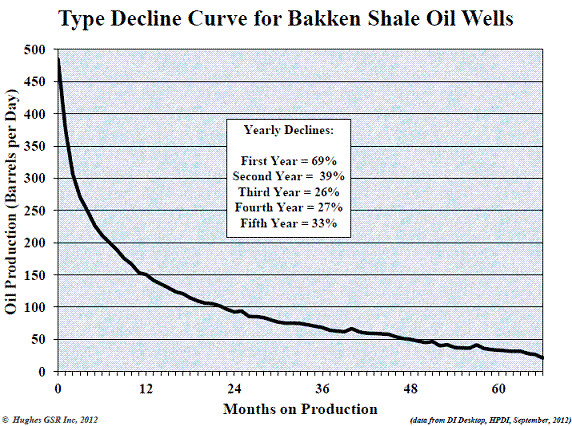 |
Given the observed decline rates on existing wells, it is then a straightforward mechanical exercise to ask the following question. Suppose that no new wells were drilled after 2010. What would the path of Bakken oil production then look like?
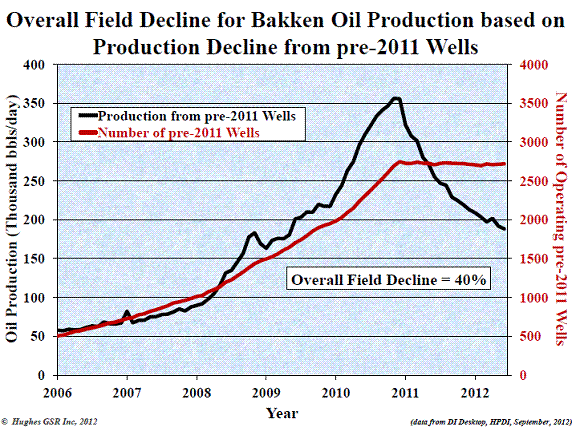 |
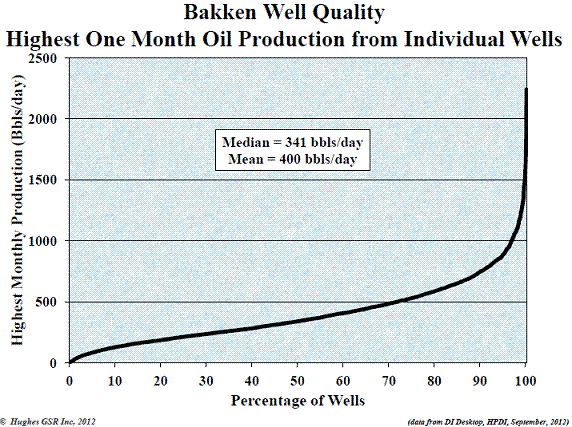
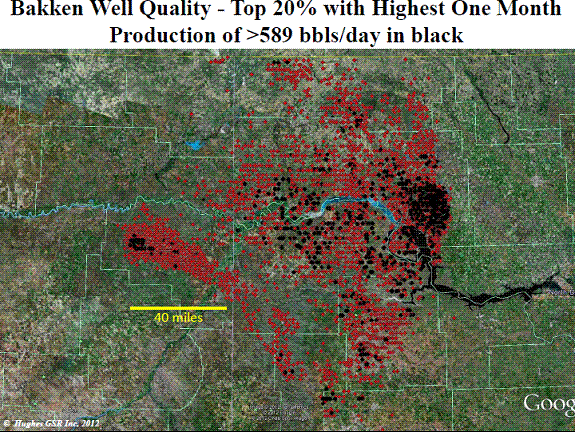
Increasing the annual production thus requires not just new wells but an increasing number of new wells each year; Hughes estimates that 820 new wells are needed just to offset Bakken field decline. But a second feature in the data posing challenges for that plan is that while a few wells in the Bakken have proven to be very productive, the average well productivity is much lower. A limited number of lucrative sweet spots account for much of the success so far.
 |
 |
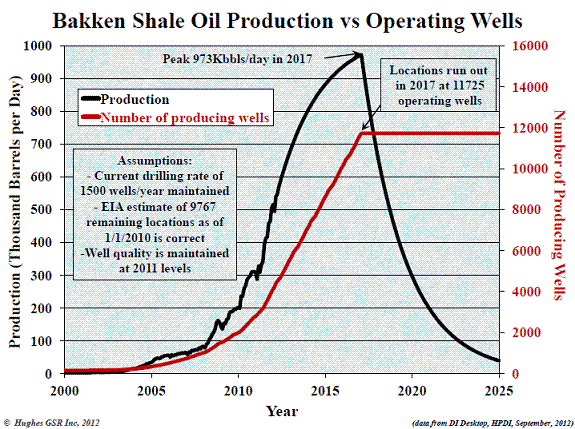
Hughes argues that there are limits to the number of new wells that will plausibly be drilled each year and the number of available well locations. These factors make achieving the IEA or Citigroup objectives difficult and mean a much more rapid decline in the production rate after the peak is reached. For example, here are Hughes’ calculations if the current drilling rate were maintained– 1500 new wells per year leading to a tripling in the number of operating wells– and if the EIA’s estimate of remaining productive locations is accepted. By contrast, the Citigroup projection of a continuous plateau after reaching peak production would require tens of thousands more well locations than estimated to be available by the EIA.
 |
Oil produced from shale or tight formations is going to be very helpful to the U.S. economy. But this is an expensive way to try to get oil, and there may have been some overselling of how much these fields are actually going to deliver.
The decline rate in production from a well is similar to what I used to see when I was involved with gas drilling in W. Va. Same with the number of big versus average (and lower) producers.
Not in any way an expert in this field, this presentation fits my preconceptions.
Note the decline profile of Bakken tight oil to well number, extraction/well, and proved recoverable reserves to extraction/consumption. The peak in extraction will occur at diminishing returns to bbl no later than late ’14 to early ’16, a bit sooner than Hughes’s estimate (close enough).
The Bakken production will be a negligible blip on the long-term decline curve in crude, tight oil, and tar sands extraction per capita, falling overall net energy per capita, and contracting real GDP per capita.
We cannot have real GDP growth per capita AND the price of crude oil at $85-$110 to permit profitable extraction of Bakken tight and Canadian tar sands.
The reason we cannot anticipate the peak is our lack of understanding of the relationship between debt growth to wages and production, wealth and income concentration/hoarding and resulting decline in debt-money velocity, real GDP per capita, and what we can afford to extract and burn in terms of the primary energy source per capita.
We reached the limit bound of growth of debt-money and fossil fuel extraction in ’05-’08, and recently for public debt to GDP and net energy extraction/consumption to GDP in ’10-’12.
According to the schedule number one Bakken in 2012 – 500,000 barrels.
In fact, in October 2012 – 750,000
in responding to the world energy outlook from the IEA, i covered the rapid decline in the bakken in my own newsletter and in a guest post at angry bear, citing a report from the N.Dakota Dept of Resources (pdf), which has a chart similar to your 3rd above; then last week i put together a quick post Thursday night on oil well flaring in N Dakota and Texas, which can clearly be seen from space…
they are buring off gas at the rate of more than 100 million cubic feet per day in N Dakota alone, enough to heat a city of 1/2 million; apparently because to build the infrastructure to capture it would delay the oil exploitation by 2 years…
got gas? oil well flaring as seen from space includes satellite photos, a video with sound effects, along with a short explanation…
I’m not sure I have much to add on this, other than that the Post Carbon Institute has a pretty hard peak oil slant. But that doesn’t necessarily invalidate the analysis.
O&G Journal has prepared a similar area-based analysis which suggests the Bakken could produce at 1 mbpd well into the 2020s.
If I look at annual growth rates on a monthly basis, recent months have been posting 60%+ gains year on year, and this growth rate is near historical highs for the region. A near term collapse is not evident.
Notwithstanding, the decline rates are what they are. There is a need to continuously ramp the pace of drilling not only to increase, but to hold, production levels over time.
But we don’t need liquids–compressed natural gas works just as well in existing engines.
Here is a question I asked at the recent ASPO-USA conference in Austin, Texas:
“Let’s assume, because of the decline in shale gas drilling, that we see a year over year decline in US natural gas production from 2012 to 2013. Let’s further assume that spot natural gas prices are between $6 to $8 per MMBTU in the fourth quarter of 2013. And let’s assume that because of the price signal, US companies increase their natural gas drilling efforts. Given the fact that the overall decline rate from existing natural gas wellbores in 2013 is higher, perhaps much higher, than in 2003, will it be possible for US producers to offset the underlying decline rate in natural gas production and resume an indefinite rate of increase in US natural gas production?”
As Steven noted, this steady increase in the underlying decline rate from shale gas and shale oil plays is the key problem. The overall decline rate from existing wellbores is increasing, month by month and year by year.
On the oil side, in my opinion it is an enormous mistake to assume that thousands and thousands of wellbores that are quickly headed toward stripper well status, 10 bpd or less, will be sufficient to offset the ongoing decline in Global Net Exports of oil (GNE*), with the developing countries, led by China, so far at least consuming an increasing share of a declining volume of GNE.
A graph showing the 2002 to 2011 decline in the GNE to CNI ratio (ratio of Global Net Exports of oil to Chindia’s Net Imports):
http://i1095.photobucket.com/albums/i475/westexas/Slide03.jpg
The extrapolation is based on the 2005 to 2011 rate of decline in the ratio.
Here is an excerpt of a paper I am working on:
*GNE = Net exports from top 33 net oil exporters in 2005, BP + Minor EIA data, total petroleum liquids
Is there a link to a PDF of this presentation? Very interesting.
-Thanks
@Vlas. You are incorrect. Bakken production in October 2012 was 682393 barrels
https://www.dmr.nd.gov/oilgas/stats/historicalbakkenoilstats.pdf
My analysis included data up to May 2012 when Bakken production was 578382 barrels
@AM The link to the presentation is at
http://aspousa.org/wp-content/uploads/2012/12/HUGHES_Austin-2012.pdf
I gave the same presentation at the AGU.
While the various estimates of real oil production are valuable, I find it questionable that the issue of what this oil will cost is almost completely ignored.
Currently, several sources estimate that the marginal cost of bring this new oil on line is already in the $80 to $100 range and will probably rise in real terms as we go forward.
So maybe the most important issue is not how much oil will be produced but rather how the economy will adjust to an ever rising real cost of oil.
California just published rules for fracking in the Monterey Shale, a field four times larger than Bakken. Did that come up at the AGU meeting in SF? http://www.garp.org/risk-news-and-resources/risk-headlines/story.aspx?newsid=56353
Some overselling?
Here’s how it works:
Front-end lender finances the initial drilling
Driller/Operator digs the well and sells the asset
Back-end investor buys the oil
Driller/Operator collects fees for producing the well.
In case there’s any questions, the front-end lenders are the same ones who were doing the front-end financing on mortgage loans in the early and mid 2000’s. And the investors who are buying the oil–same as the ones who were buying mortgage bonds.
And yes, the incentives are just as skewed now as they were then. And the “top talent” making the investing decisions are just as ignorant and incompetent as they were then.
More importantly, are you ready to escape the simulations on December 21, 2012?
Here is my confusion. Why is there such a rush to get the Bakkan oil to market, to the point that you would flare gas rather than take the time to get the infrastructure there to capture it?
Cushing is flooded with crude, to the point that WTI sells as a substantial discount to Brent, which is unprecedented.
Buzzcut, the article from the oil & gas journal i linked to claims the reason that the Bakken gas is being flared instead of captured is that building the infrastructure would have delayed oil exploitation by 2 years…
unfortunately, using my link requests that one sign in; however, you should be able to view the article by accessing it from google, searching for “Restricting North Dakota gas-flaring would delay oil output, impose costs“
quoting said cited article:
“The Bakken is said to yield 6-12 gal of NGLs per thousand cubic feet of natural gas. This makes it one of the richer gas plays in the US. The cost of flaring thus is greater in North Dakota’s Bakken than in other plays (Table 2).
The value of these NGLs varies according to the market but can easily add $6-12/bbl of oil if captured and processed. This is a strong incentive to the oil producer faced with transportation discounts that lower wellhead values of North Dakota crude oil because of distance to major refining centers.
I listen to many oil company conference calls, and do financial analysis of same. In addition to the Bakken, there’s the Mississippi Lime, Permian, Eagle Ford, Marcellus, and at least a dozen other shale plays. In Canada there are several as well- XOM’s buy of Celtic as an example. Well completion times have dropped, and efficiency is increasing all along the supply chain. Wells are being spaced more closely together, with one pad serving multiple well locations due to the use of horizontal drilling. The speed of improved drilling efficiency is breathtaking.
EOG is shipping Bakken crude by rail until pipeline capacity is adequate.
That said, if crude trades below $75./bbl., some of these plays will become uneconomic. That’s what would stop development. If Mr. Hughes assuming stable prices in his analysis he will be wrong.
Following up on RichL above, there are so many unknown opportunities for additional shale oil and maybe even oil extracted in other ways that I take IEA’s forecast worth a grain of salt.
That said, we still need to shake the oil habit before we destroy the earth and end the potential for mobility and growth.
I interpret the last graph in the article and RichL’s comment as saying that there’s a lot of shale out there we could be drilling, and we’ll need to bring a Bakken’s worth of new shale on line every five-to-seven years, and we’ll bring the new projects to peak production faster and cheaper. Not exactly Peak Oil, but definitely Red Queen.
And somewhere in here, we’re supposed to be finding a way to use this wonderful oil without spewing CO2 into the atmosphere.
My standard estimate is that about 0.1% of the people in the world have some understanding of what I call “Net Export Math.” I am beginning to think that this estimate is too high. Most of us are aware of Dr. Bartlett’s famous comment about humans and their failure to understand the exponential function, but the problem with Net Export Math is that one has to explain multiple exponential functions.
But I think that the larger problem is psychological, even for Peak Oilers. The implications are so troubling, that most of us, even in the Peak Oil crowd, who are aware of Net Export Math are somewhere between disbelief and denial.
In any case, following are two charts that I think clearly illustrate our predicament.
Net Export Math Explained in Two Charts
The ECI ratio, which is simply the ratio of total petroleum liquids production to liquids consumption, gives us a measure of how much net export capacity a given oil exporting country has.
The rate of change in the ECI ratio, given a multiyear decline in the ratio (and absent exogenous effects on production such as political unrest, e.g., Russia in the early 1990’s, and clearly voluntary reductions in production, e.g., Saudi Arabia in the early 1980’s), appears to provide us with a reasonable estimate of when a given oil exporting country might approach zero net exports. Furthermore, some simple math allows us to estimate remaining Cumulative Net Exports (CNE).
The GNE/CNI ratio, which is the ratio of Global Net Exports of oil (GNE) to Chindia’s Net Imports (CNI) is very similar to the ECI ratio.
The following chart shows normalized ECI values for the Six Country Case History (with 1995, the Index Year, = 100%) and normalized ECI values for GNE and for Saudi net exports (with 2005, the Index Year, = 100%). Also shown are normalized GNE/CNI values (with 2005, the Index Year, = 100%).
http://i1095.photobucket.com/albums/i475/westexas/Slide12-1.jpg
The index years, 1995 for the Six Country Case History, and 2005 for Saudi and global data, were inflection points, when production and net exports virtually stopped increasing, or peaked.
The next chart shows estimated Post-Index Year Remaining CNE (Cumulative Net Exports), by year, for the Six Country Case History, For Global Net Exports, For Saudi Arabia and for Available Net Exports. The estimates are based on extrapolating the six year rates of decline following the Index Years, i.e., the production/net export inflection points.
http://i1095.photobucket.com/albums/i475/westexas/Slide2-6_zps3f248dc1.jpg
At the end of 2001, estimated remaining post-1995 CNE for the Six Country Case History were down to 39%, or about 3.5 Gb (billion barrels). The actual value at the end of 2001 was 25%.
At the end of 2011, estimated remaining post-2005 CNE for Saudi Arabia were down to 62%, or about 28 Gb.
At the end of 2011, estimated remaining post-2005 Global CNE for were down to 78%, or about 349 Gb.
At the end of 2011, estimated remaining post-2005 Available CNE for were down to 52%, or about 87 Gb.
In other words, based on extrapolating the 2005 to 2011 rate of decline in the GNE/CNI ratio, at the end of 2011 the estimated total post-2005 cumulative volume of Global Net Exports of oil that will be available to about 153 net oil importing countries was down by about half.
Re: RichL
I would add that the rate of increase in the underlying rate of decline from existing wellbores is also breathtaking.
Professor,
Over the years you have been pretty hard on the Saudi oil production and especially the peak oil production aspects of Saudi oil. Now we know that the US will probably pass the Saudi’s in oil production because of new found techinques and new reserves.
Those of us who question the peak oil theory point out that the unknown reserves are huge world wide; we are virtually floating on a sea of oil that is only to be discovered. Additionally, technology will always improve and increase energy production. Oil has only been the primary source of energy for a little over 100 years. The next advance in technology in energy will make oil a minor player. No one knows what it will be but it will come, just as oil became dominant.
So extreme positions on either side of the issue are mere speculation.
Jeffrey, count me among the 0.1% who “gets it”.
Moreover, what most economists don’t yet recognize (can’t say publicly) and many in the “awl biness” do not get is that US real private GDP per capita can’t grow with deep water, shale, and tar sands requiring crude at $85-$110/bbl to be profitable to extract.
And now China has hit the “middle-income trap” with falling FDI from the US and Japan, which is largely a function of Boomer demographic drag effects, Peak Oil and oil exports, and the world reaching the debt Jubilee point as a share of private GDP. China’s growth is set to markedly decelerate hereafter with a sharp decline in investment, production, and exports.
One sees articles proclaiming how US oil imports and consumption are falling at the same time shale and crude production is rising, implying that the US is on track to become “energy independent”. What is apparently hiding in plain sight from the authors’ view is that the rate of real US private economic activity per capita is continuing to decelerate from the ’00 high, and contracting since ’07-’08. We’re consuming and importing less crude oil because we’re collectively getting poorer.
In the meantime, one need not remind the US banksters of private US economic conditions, as they continue to liquidate their balance sheets, with plans to add another $1 trillion in cash from the Fed to their $1.68 trillion they have today while not increasing lending overall, owing to their real net margin being negative after charge-offs and delinquencies.
Clearly, the banksters know something that stock market speculators do not . . .
Excellent presentation, a counterpoint to the mania that paints a small increase in production as a ‘Revolution’.
What nobody talks about is the consumption side, that being the folks who ultimately pay for the Revolution by charging it on their credit cards, by taking out car loans and mortgages or by having their governments borrow for them. Because the world has been charging for decades, the ability to charge further is constrained due to related costs.
How the credit constrained are going to afford the high priced fuel has not been addressed.
Also not addressed is the fact that customers compete with oil well drillers for the same pool of lendable funds. If funds are made available, demand expands much faster than supply because it is easier to manufacture vast amounts of cars, highways and tract houses than it is to find and exploit the more complex and difficult petroleum deposits. The drillers must always ‘catch up’ and they never can for long.
At the same time, consumers must have a steadily increasing flow of credit to remain as going concerns: debt service cost and need to refinance maturing debt are unrelenting. The drillers can sell oil but the customers have nothing to sell but their REQUIREMENT for oil which translates to that requirement for credit. This requirement is a wasting asset, invisible to economists who never consider it.
The cost for credit added to the cost of fuel has already bankrupted some customers (Europe) and is on the way to bankrupt the rest. Cost matters, in fact it is the only thing that does! When an input cost rises the input becomes too valuable to waste and the wasting enterprise is stranded.
The drillers are extracting more oil, let us give them credit for it … this is also irrelevant to anything. Drillers cannot find remunerative uses for the oil that are any different from the wasting uses of the past 100 years. Nobody has bothered to look for any better uses for oil other than to borrow … then burn oil for no real gain/for fun. This is a bad business plan and we are in the process of paying for it.
Bruce Carman at December 20, 2012 11:01 AM
A few points for you to consider:
1) Substitution of domestic oil production for imported oil benefits GDP by increasing domestic economic activity. Remember that same $75 per barrel cost of shale oil extraction is also $75 of economic activity – mostly domestic in nature – in the cost of drilling, fracking and transporting. One man’s cost is another man’s job and the net between the sales price and the extraction cost is someone’s profit either to be reinvested or distributed as dividends..
Thus while higher oil prices do lessen real GDP over what GDP would be with lower oil prices, increased domestic substitution for a product that was formerly imported, increases real GDP.
2) Technology and productivity will reduce extraction costs. I do not know specific numbers, but I do understand that improvements in drilling techniques such as walking pad rigs and faster drilling rates have greatly increased the productivity of each drill rig by as much as 200% – 300%. Thus while past demand has kept billing rates high, productivity improvements have lowered costs. In a free market, these things will reach equilibrium as companies invest in more rigs and fracking equipment and cost competition forces production costs to drop.
3) An economy is not static. Productivity and efficiency improvements continuously occur. Case in point is the automobile. If a car is purchased today that has twice the fuel efficiency of the car that it replaces, then the fuel cost to operate it is unchanged even if the fuel price has doubled. Certainly real GDP is affected in the sense that capital and resources are invested, not in improving living standards, but in restoring standards by increasing efficiencies, but overtime productivity lowers the costs of these efficiency changes and real GDP growth marches on.
4) As the joke goes, you do not need to outrun the bear, you only need to outrun the other guys who are with you.
Due to the technology advances in oil and gas extraction, the USA strongly appears to have a multi-year competitive advantage in natural gas production and cost. This in turn means that we can “outrun” our competitors in energy intensive industries such as refining, chemicals, forging, iron and steel, fertilizers, cement, etc. Thus again the USA will be able to produce more goods domestically as opposed to imports as well as being able to increase exports. Since we are not a full employment, these actions will create jobs (as well as profits for reinvestment or distribution) that will increase GDP.
Three years ago I thought our future was hopeless because of our declining domestic oil and gas resources. The technical advances that has permitted shale oil and gas extraction to be economically feasible has given us a new opportunity to produce ourselves the oil that we had to import before and to rebuild our industrial base by becoming a low cost producer in certain energy intensive areas.
We are in a sense in a “win-win” situation relative to many other nations. If oil prices increase, domestic production will increase and less oil will be imported and if oil prices fall, while domestic production may fall, the overall economy benefits from lower import costs.
Dear ima. Your analysis looks very good – until we ask how long this approach can be maintained. Do you have children? To use your metaphor, you may find that you have to run flat-out over increasingly difficult terrain just to stay ahead of that bear. If you should stumble, you may never get up again. Think of your children.
Respectfully, Mitch
Re: ima
As time goes on, it becomes increasingly difficult to offset a steady increase in the underlying decline rate from existing wells, as an increasing percentage of US oil & gas production comes from very high decline rate shale plays.
For the US, the reality is that we already can’t afford to buy all of the output from US refineries, since we are a net product exporter.
And since (based on the WTI crack spread) US consumers are almost fully exposed to global oil prices–which are driven by the fact that developing countries, led by China, have been consuming an increasing share of a declining volume of Global Net Exports of oil–I suspect that the reality facing the US consumer is a continued cyclical pattern of higher annual oil price highs and higher annual oil price lows, as we are gradually shut out of the global market for exported oil.
Mitch,
IMO, we need the economic benefits of domestic oil and gas now, not later. We are working out of an economic contraction that, but for extraordinary levels deficit spending and monetary expansion, would have at least equaled the great depression of the 30s. The ability to increase our domestic energy production, in a global marketplace, where we have a difficult time competing due to labor cost imbalances.
Regarding the “we should save it for our children” theme, I do not profess to know the future, however I think that having jobs and the prospects for a viable economic future are also important gifts that we can provide our children.
On the fossil fuel front their are shale rocks, gas hydrates, Orinoco, etc. after the shale oil and other current sources are depleted.
On the technology front, who knows, but perhaps algae oils and other bio-fuels will come to the for front if and when prices in the marketplace make these alternatives economic.
One alternative that may not hold as much promise as many hope is advanced battery power storage systems. I spent the morning researching their status and came away with the opinion that there is not any ground breaking alternative that is much better than the lithium ion battery. But then again, with future technology improvements and when the marketplace makes it economic, power storage will take hold.