Time to emulate the media’s “year in review” pieces, with my own take on the most outrageous, nonsensical assertions presented in the guise of analysis. Here are my ten most hilariously deluded excursions into the fantasy world from my postings to Econbrowser. The inspirations range from (once again) the Heritage Foundation’s analyses (where have you gone, Bill Beach!) to the ongoing search for hyperinflation/crowding out.
1. March: Representative Ryan’s plan assumes a path for tax revenues, without any detail on how those tax revenues targets would be attained. Sounds like “command and control” to me! From Assume a Can Opener*:
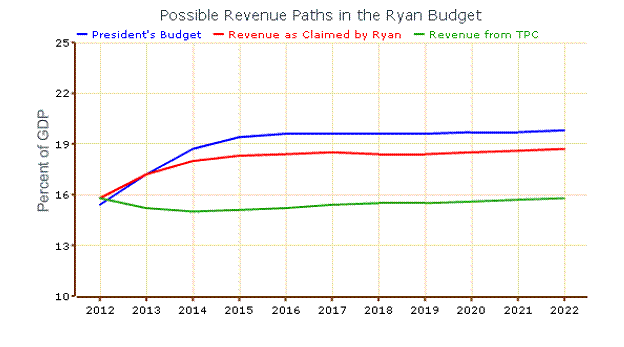
This scoring [of the Ryan plan] is visualized by the Center for a Responsible Federal Budget, hardly a leftist organization.
Figure 1 from Center for a Responsible Federal Budget.
Let me say upfront that this scoring doesn’t include tax revenue responses of either a Keynesian or supply side sort due to behavioral changes. I am confident that if one were to include the supply side responses incorporated in the Heritage Foundation’s analysis of the earlier Ryan Plan, then the circle could be squared! All one needs is some price elasticities many times larger than those in the extant literature, and et voila – a supply side miracle and a debt-to-GDP reduction as government spending is decreased. As I noted in this post, an elasticity about ten times that cited in the literature would do the trick.
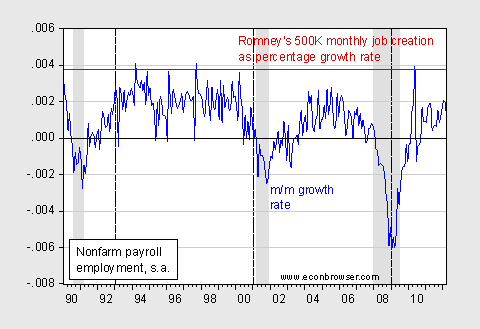
2. May: Governor Romney says 500,000 net job creation per month is typical during a recovery.
Governor Romney has said that 500,000 is the monthly job creation he expects as normal during a recovery [1]. It actually last happened in May 2010 but is otherwise pretty rare. Reader Rick Stryker argues that the 500K should be expressed in percentage terms, accounting for the size of employment. Nonetheless, breaching the equivalent in percentage terms never happened during the eight years of the G.W. Bush administrations.
Figure 1: Month on month growth rate (log differences, not annualized) in nonfarm payroll employment, s.a. (blue), and 500,000 monthly change, expressed in percentage of 2012M04 NFP. Source: BLS April release, via FRED.
In fact, over the last 21 or so years, one has to go back to the Clinton administrations to find such numbers.
3. May: David Brooks tries to play economist. From The Unbearable Lightweightness of Being David Brooks:
In Tuesday’s NYT column, entitled “The Structural Revolution”, David Brooks writes:
[I] … believe the core problems are structural, not cyclical. The recession grew out of and exposed long-term flaws in the economy. Fixing these structural problems should be the order of the day, not papering over them with more debt.
…
… we structuralists do not believe that the level of government spending is the main factor in determining how fast an economy grows. If that were true, then Greece, Britain and France would have the best economies on earth. (The so-called European austerity is partly mythical.) We believe that the creativity, skill and productivity of the work force matter most, and the openness of the system they inhabit.
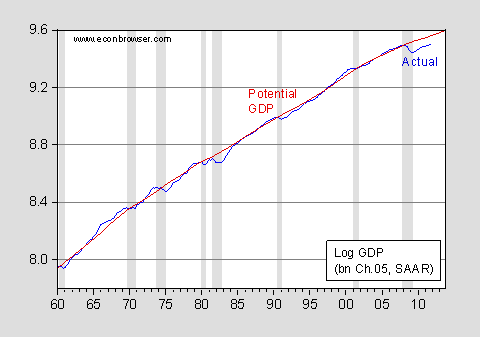
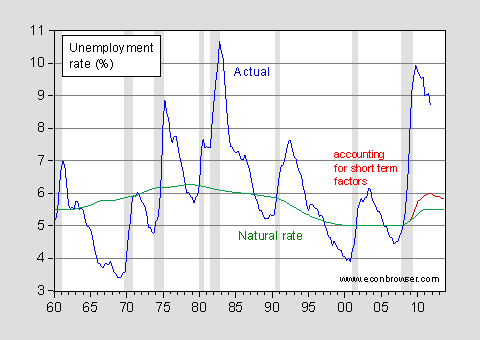
Here is the CBO’s assessment of the structural and cyclical components of GDP and of unemployment.
Figure 1: Log GDP (blue) and log potential GDP (red), bn. Ch.2005$. NBER defined recession dates shaded gray. Source: BEA, 2012Q1 advance release, CBO, Budget and Economic Outlook (January 2012), NBER and author’s calculations.
Figure 2: Unemployment rate (blue), and natural rate of unemployment – long term (green) and natural rate of unemployment – short term (red). Source: BLS vis St. Louis Fed FRED, CBO, Budget and Economic Outlook (January 2012), and NBER.
By these measures, most of the deviations are “cyclical”. There is a structural aspect, of course. The CBO’s measures take into account trends in capital stock, labor force, and multifactor productivity. If that ain’t structural, I don’t know what is.
The CBO’s assessment of the natural rate of unemployment, including the recent measures of short term natural rate, highlights the fact that structural does not necessarily mean long-lived, nor does it necessarily mean immune to measures implemented to address cyclical weakness. These measures include extended unemployment insurance, etc.
Since then, the evidence has only accumulated that the structural view is deficient. Ed Lazear and James Spletzer argue that most of the increase in unemployment is due to cyclical factors. From the abstract to the NBER Working Paper:
The recession of 2007-09 witnessed high rates of unemployment that have been slow to recede. This has led many to conclude that structural changes have occurred in the labor market and that the economy will not return to the low rates of unemployment that prevailed in the recent past. Is this true? The question is important because central banks may be able to reduce unemployment that is cyclic in nature, but not that which is structural. An analysis of labor market data suggests that there are no structural changes that can explain movements in unemployment rates over recent years. Neither industrial nor demographic shifts nor a mismatch of skills with job vacancies is behind the increased rates of unemployment. Although mismatch increased during the recession, it retreated at the same rate. The patterns observed are consistent with unemployment being caused by cyclic phenomena that are more pronounced during the current recession than in prior recessions.
This point is illustrated in Figure 7 from the Lazear and Spletzer paper:
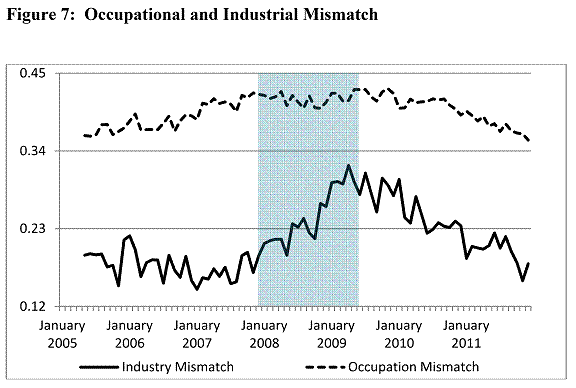
Figure 7 from Lazear and Spletzer (2012).
4. May: Governor Walker doubles down on 250,000 new jobs by 2015, in Dispatches (XXI). There has been some debate whether the BLS estimates are accurately depicting trends in Wisconsin employment; to put the best case for the Administration, I present my updated graph, incorporating data based on the Quarterly Census of Employment and Wages.
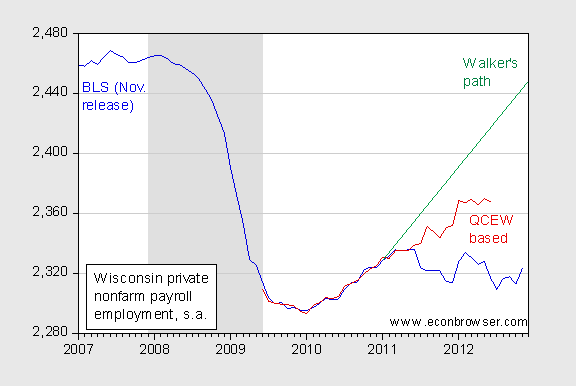
Figure 1: Wisconsin private nonfarm payroll employment from BLS November 2012 release (blue), estimated private employment based on QCEW data (see this post) (red); implied path for employment given 250,000 net job increase by 2015M01 (green), in 000’s. NBER defined recession dates shaded gray. Vertical line at 2011M01. Sources: BLS, NBER, and author’s calculations.
According to BLS estimates, as of November private employment was only 255.6 thousand short of Governor Walker’s target for January 2015. I have generated a QCEW-based estimates up to June 2012 (the last reported QCEW data); for that month, employment was 211 thousand below the January 2015 target (but only 49.5 thousand below Walker’s path, instead of 100.5 thousand indicated by the BLS series).
5. July: Waiting for high inflation (and still waiting).
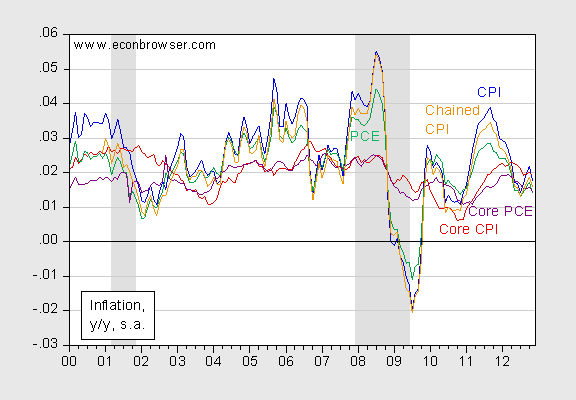
Figure 2: Year on year inflation measured using CPI (blue), core CPI (red), personal consumption expenditure deflator (green), core personal consumption expenditure deflator (purple), chained CPI (orange). NBER defined recession dates shaded gray. Source: BLS and BEA via St. Louis Fed FRED, accessed December 28, author’s calculations.
6. July: Waiting out for crowding out (as feared by Representative Ryan, and still waiting).
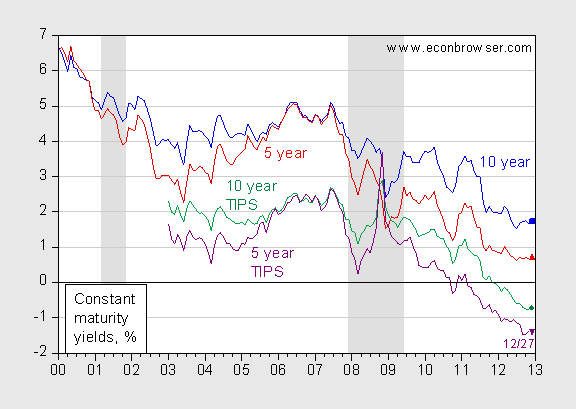
Figure 3: Ten year constant maturity Treasury yields (blue), five year (red), 10 year TIPS constant maturity yields (green), five year (purple). Observations for December pertain to 12/27. NBER defined recession dates shaded gray. Source: St. Louis Fed FRED.
7. October: At Long Last, One Member of the 47% Where He Belongs!.
8. October: if you don’t like the jobs numbers, it must a conspiracy! From Watergate! Iran-Contra! BLS 2012.10.5?:
it is so depressing to see the descent of a large portion of the commentariat into delusion and/or mendacity that I thought I would show exactly how pathetic the assertions of data manipulation are. Exhibit 1 is Jack Welch’s tweet, the subsequent flailing attempt to defend his unsubstantiated assertion on Anderson Cooper’s show, and finally on the Op-Ed page of the WSJ (perfectly appropriate, I must say). Welch himself describes the controversy:
… In my first tweet, sent the night before the unemployment figure was released, I wrote: “Tomorrow unemployment numbers for Sept. with all the assumptions Labor Department can make..wonder about participation assumption??” The response was a big yawn.
My next tweet, on Oct. 5, the one that got the attention of the Obama campaign and its supporters, read: “Unbelievable jobs numbers..these Chicago guys will do anything..can’t debate so change numbers.”
As I said that same evening in an interview on CNN, if I could write that tweet again, I would have added a few question marks at the end, as with my earlier tweet, to make it clear I was raising a question.I’ll let readers decide whether Mr. Welch is trying to have it both ways; inspecting the video of Mr. Welch on Anderson Cooper would be particularly instructive. Representative Allen West agrees with Jack Welch:
I agree with former GE CEO Jack Welch, Chicago style politics is at work here. Somehow by manipulation of data we are all of a sudden below 8 percent unemployment, a month from the Presidential election. This is Orwellian to say the least and representative of Saul Alinsky tactics from the book “Rules for Radicals”- a must read for all who want to know how the left strategize.
Since we are seeing elected officials considering hearings on the validity of these numbers [1], it seems useful to re-examine the question of whether these numbers are truly unbelievable. Let’s look at the actual numbers that are used to calculate the unemployment rate. For the mathematically challenged, a “rate” is the ratio of two numbers — the unemployed (let’s call that U ≡ L – N, where L is the labor force, and N, which is employment), and the the labor force (L).
u ≡ (L-N)/L = 1- N/L
One can then ask if the components of the unemployment rate behaved anomalously in 2012M09. Most trained economists and statisticians have refused to say they are out of the bounds of plausibility, but let me verify this explicitly by providing some time series plots.
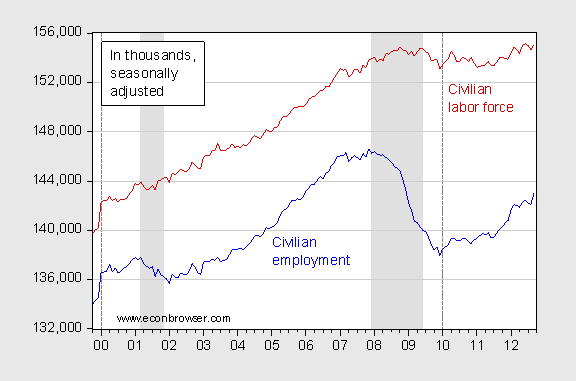
First, look at civilian employment (N) and civilian labor force (L) over the past thirteen years:
Figure 1: Civilian employment (blue) and civilian labor force (red), in thousands, seasonally adjusted. NBER defined recession dates shaded gray. Dashed lines at application of population controls associated with Census data. Source: BLS Employment Situation (CPS) September release via St. Louis Fed FRED, and NBER.
Eyeballing the two series, I would be hard pressed to see movements in September as being out of historical precedent. (Note that there is a large discrete break at the beginning of the 2000’s — and in previous decades, not shown in the graph — due to the application of population controls; analysts ignore these statistical breaks at their peril, e.g. here).
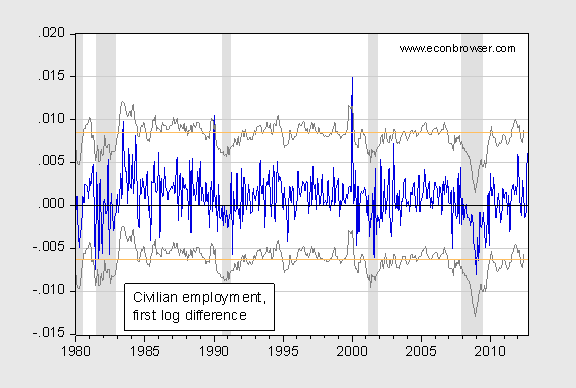
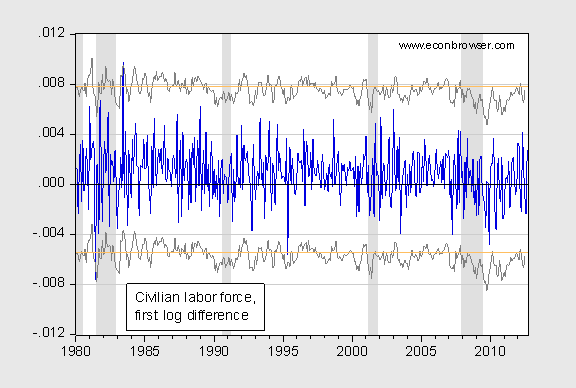
In order to formalize the argument that the movements in the two series were not out of the ordinary, I examine the log first differences of employment and labor force over the entire span of available data (1948M01-2012M09). I plot the two series and the associated plus/minus two standard error bands in Figures 2 and 3, respectively.
Figure 2: First difference of log civilian employment, seasonally adjusted (blue) and plus/minus two standard errors (5 month centered moving average) (gray), mean first difference plus/minus two standard errors (orange), all adjusted for population controls. NBER defined recession dates shaded gray. Source: BLS Employment Situation (CPS) September release via St. Louis Fed FRED, NBER, and author’s calculations.
Figure 3: First difference of log civilian labor force, seasonally adjusted (blue), and plus/minus two standard errors (5 month centered moving average) (gray), mean first difference plus/minus two standard errors (orange), all adjusted for population controls. NBER defined recession dates shaded gray. Source: BLS Employment Situation (CPS) September release via St. Louis Fed FRED, NBER, and author’s calculations.
The relevant question is whether in either figure, the blue line moves close to the gray lines, or spills over the orange line. I do not see this occurring in either figure.
Bonus comment to the post. Anonymous writes:
“ok I am too stupid to understand your egg head charts, but with this administration blatantly
lying about knowledge on libyan embassy ,can they be trusted with anything .”
The sentiments contained in that comment explain why conspiracy theories find fertile ground in certain circles (except when it involves Iran and the Contras – strange how that works).
9. November: Who needs experts when you know the answer? From The Republican Joint Economic Committee Does Public Finance:
Or, “Just because you can’t prove that the top marginal tax rate has a large impact on economic growth doesn’t mean that it doesn’t: just have faith!”
As readers will recall, recently a Congressional Research Service report on the impact of top marginal tax rates was “disappeared” after pressure by the Republican leadership was exerted. [1] The report (mostly a survey of the literature) found no statistically significant impact of top rates on growth. Yet the Republican JEC (to differentiate it from the JEC under Robert Casey)would have us start from the null hypothesis of there being an effect, and only rejecting that (null) hypothesis when sufficient evidence was found against there being an effect.
Now, the JEC-Republicans have produced a report (well, more like a blogpost) that asserts that CRS should’ve studied the effective rate. Indeed, it may very well have been the case that CRS should’ve undertaken that study. After all, I think most of us think the effective rate is important. Oh, they actually did! (Gravelle, Marples, “Tax Rates and Economic Growth,” Report R42111 (December 2011)).
Conclusion: I think the JEC-Republicans should critique the CRS report that addresses the topic the JEC-Republicans argue the CRS should’ve analyzed (and actually did), rather than the CRS report that addresses exactly what it says it address in its title. (After all, I assume that the JEC-Republicans have access to all the CRS reports.)
10. December: Macro analysis using an identity. From Why Worry about the Fiscal Cliff
Almost three years ago, some analysts (I use the term loosely) argued that the stimulus embodied in the ARRA (which was about one third tax reductions) would have no impact on GDP, i.e., would not be stimulative. Consider the following statement by Mr. Brian Riedl of the Heritage Foundation:
… Spending-stimulus advocates claim that Congress can “inject” new money into the economy, increasing demand and therefore production. This raises the obvious question: From where does the government acquire the money it pumps into the economy? Congress does not have a vault of money waiting to be distributed. Every dollar Congress injects into the economy must first be taxed or borrowed out of the economy. No new spending power is created. It is merely redistributed from one group of people to another.
…
What this implies is that if the stimulus was ineffective because each dollar spent by the government was a dollar taken away from the private sector, then we should rejoice when each dollar no longer spent on defense (paying fighter pilots guarding US airspace, maintaining nukes, etc.) is released to the private sector for purchases of yachts and mansions. (By the way, a new classical formulation leads to a similar conclusion.)
Addendum: Heritage rebuts and I provide a rejoinder. Heritage argues it never stood against the sequester on the basis of contractionary impacts. But I find it telling that they never argue that the sequester would have zero impact on GDP, which is consistent with their analysis of the ARRA. Their reluctance to do so suggests they are not comfortable with that implication, in that context.
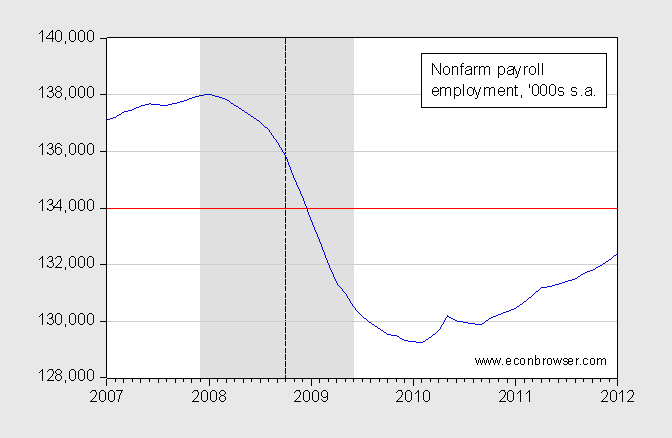
Bonus Item – February: Because no such compendium is complete without an example from Professor Mulligan. From Famous Conditional Forecasts from the Real Business Cycle Side.
As I was reviewing material to use in teaching how new classical models relate to the popular aggregate demand/aggregate supply models [0] used in policy analysis, I ran into this forecast in the real business cycle vein from October 26, 2008.
Barring a nuclear war or other violent national disaster, employment will not drop below 134,000,000 and real GDP will not drop below $11 trillion.
All this is to illustrate that in the fog of business cycles, one’s got to be careful about making forecasts (the rest of the article is a must-read, as is this rousing defense by Professor Mulligan in October 2009). Here is the actual evolution of nonfarm payroll employment.
Figure 1: Nonfarm payroll employment (000’s, January release). Dashed line at October 2008. Source: BLS via FRED.
Thanks for reading. Looking forward to another year, hopefully full of better analysis!
Thanks for performing this vital public service, and making it fun. Have a happy new year!
I’m afraid you are missing a sweet gig by dissing the wingnut welfare think tanks. Economist Dick Armey walked into FreedomWorks with an armed guard and refused to leave until he was given $8 million.
Armey: “I couldn’t leave with empty pockets.”
I wonder sometimes about Casey Mulligan. He must do some good work to be where he is but the stuff I read by him – on his blog, in the NYT – reads like it was produced by our dear commenter Ricardo. Maybe it’s him. Who knows? As a serious question: does he do some good work? If so, what? I would actually like to read it.
One may have read about the project of leaving human relics in a satellite revolving around the earth. These relics would satisfy the curiosity of aliens. Good intention,but in knowing that the probability of more advanced civilizations enjoying few billions years of more advanced intelligence is not remote, readers should petition M. Chinn and J. Hamilton not to allow Econbrowser posts to be included in these relics.
Wishing to all readers a happy decade and a thanks to both Professors for their work.
“”ok I am too stupid to understand your egg head charts, but with this administration blatantly
lying about knowledge on libyan embassy ,can they be trusted with anything .””
Reminds of the old saying about keeping ones mouth closed and only being thought a fool.
Wonder why he did not reference Chapaquiddic?
“Every dollar Congress injects into the economy must first be taxed or borrowed out of the economy.”
Let’s assume it is borrowed.
“No new spending power is created. It is merely redistributed from one group of people to another.”
Do you believe that is true?
@ Menzie Chinn: First of let me say that you are Great with both charts and words and I do like to read your posts.
@ dilbert dogbert: I would think that redistribution can also make ways to the creation of spending power and hence the question of yours is correct.
As for point #3, I beg to differ that there is no evidence for a structural problem. It appears they haven’t looked in the right place.
Here is a link to my work…
https://docs.google.com/open?id=0BzqyF_-6xLVEZ0FlVHZSaUd1bVU
I have 2 graphs that show the natural rate of unemployment has risen, but not from the causes researched above like skills mismatch.
I also end the work with graphs showing the fall in potential real GDP. In one graph, you will see the dead-weight loss in the economy. The economy continues the same but just with a dead-weight loss. Now if you look at the dead-weight loss, you might conclude it is cyclical, but my graph shows that the economy is being locked out by the labor share constraint.
How will we know if my work is correct?
Through time and data.
Good piece, except I am sympathetic to the structural arguments. Many American workers exhibit low productivity yet continue to pursue Cadillac tastes through leverage.
The information technology economy has not been kind to many American workers.
Wow. That’s a lot of whistling in a graveyard. Monetizing the debt as we are would seem to deserve something, but this is just a set of predictable, one-sided political hatchet jobs.
Thanks for the post. This allows me to delete it from ones I might read.
jonathan – Mulligan’s first book (and, iirc, his thesis) is standard economist analysis, of the “assume legacy-wealth” genre.
Unlike Scott Sumner, though, he pretends to believe that economics is about more than just that group, but treats them (us) as if they (we) think the same as his cohort.
The result is amusing until you realise that real lives are involved.
“We believe that the creativity, skill and productivity of the work force matter most, and the openness of the system they inhabit.”
And you reject this statement as being that from a “lightweight economist”? I must disagree. This statement is the essence of what makes an economy grow over time. It perhaps should not be limited to labor but should also include other elements vital to economic prosperity such as capital, natural resources, energy, legal and regulatory structures and the systems that they inhabit, but the concept is fundamental to why and how economies succeed over the long haul.