In several weeks, absent action by policymakers, the Federal government will begin implementing $85 billion worth of across-the-board cuts during FY2013 (i.e., in the months before October). [0]
According to one narrative, each dollar of spending previously devoted to patrolling the South China Sea and monitoring tornadoes and winter storms will be released to private spending, so that there is no impact on output. For the rest of us, output will likely decline relative to what would have otherwise would have occurred. How much? Given that interest rates are near zero (the “zero lower bound” or ZLB), I suspect a lot.
From Reichling and Whalen (2012), an assessment of fiscal multipliers under special circumstances, arguably prevailing at the moment:
CBO’s analyses generally use a range of values for the demand multiplier to reflect the uncertainty about its size. In addition, the range of estimates used by CBO varies with the degree of resource utilization in the economy and the response of monetary policy during the periods when the changes in fiscal policies occur. When actual output is well below potential output and the Federal Reserve does not act to offset the effects of changes in fiscal policies, CBO’s demand multiplier ranges from 0.5 to 2.5 over four quarters, starting the quarter in which a direct effect occurs in response to changes in policies, with no further effects on output in the short term.
Figure 1 presents a plot of multipliers for government spending on goods and services:
Figure 1: Cumulative fiscal multipliers for spending on goods and services, high (blue) and low (green) values when monetary policy responds as in normal times; and high (red) and low (purple) values when interest rates are near zero (the “zero lower bound”), for spending changes beginning in 2013Q1. Source: Reichling and Whalen (2012) additional data.
Figure 2 plots interest rates over the last 45 years:
Figure 2: Fed funds interest rate (blue), three month Treasury yields, secondary market (red), and one year constant maturity Treasury yields (green). Observation for February 2013 pertains to February 8. Source: Federal Reserve Board via St. Louis Fed FRED.
Pretty clearly, we are in a liquidity trap. Nominal rates are unlikely to budge in the face of plausible government spending changes. Consequently, taken together, spending cuts of $85 billion for this fiscal year will result in something like $200 billion reduction by four quarters after spending is implemented (I’m assuming the bulk of the cuts are reductions in spending on goods and services). Going forward, assuming $110 billion cuts year after year per the Budget Control Act, GDP will be reduced by over $250 billion per year relative to baseline.
While these numbers don’t sound incredibly large against a backdrop of a $15 trillion economy, it’s important to recall that government spending on goods and services is already slated to continue to decline over the next few years (see Krugman for the retrospective and Weisenthal/BI quoting Goldman Sachs for the prospective views).
Implications for Government Services
The preceding multiplier calculations assume there are no disruptions associated with spending reductions. At this point, it is important to recall that the cuts are to be implemented in a remarkably blunt fashion. From Plumer/Wonkblog: “The key feature of the cuts is that they would affect all agencies and programs equally — federal officials would not be able to pick and choose which programs get protected and which get the ax.” And from Beutler/TPM:
“If we go past this date, there’s no way to implement the sequester without significant furloughs of hundreds of thousands of federal employees,” said [OMB Controller of Office of Federal Financial Management Danny] Werfel. That’s in large part because there’s no ways for departments and agencies to move money around to protect top-tier services and programs.
“What happens is, OMB, we take this amount, this $85 billion that we have to cut and apply it to every account in government,” he added. “Every account has to be cut by a certain percentage. It’s not like the agencies can move money amongst accounts. But it’s even worse than that; even at the sub-account, there’s something called Program Project and Activity which exists within each account. And the way the sequester law is written is that even underneath the account — even at the Program Project and Activity — they all need to be cut at that same percentage.”
…
“So for example, FAA, they have to cut resources in a way that’s going to impact the air-traffic control workforce,” Werfel added.
Half of the spending cuts apply to defense. This is what defense spending would look like as a consequence of BCA implementation.
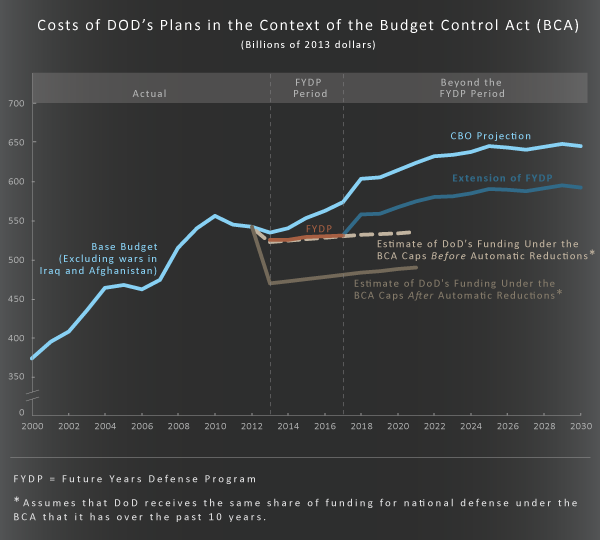
Figure 3: Impact of BCA (pre-2013 agreement) on defense spending. Source: CBO (2012).
See more discussion from CBPP; additional discussion of multipliers under conditions of economic slack here.
The dumbest assumption on both the left and the right is that spending cuts somehow will increase available capital in the private sector. In a world where government spending is financed by an unholy alliance of deficit spending, borrowing, and monetary expansion, cutting government spending does nothing to expand the investable funds in the real economy.
Republicans have been making this mistake since they first became a party before the Civil War and they have never learned. They give lip service to pro-growth policies but they always inject the caveat the first they must “balance the budget.”
Eisenhower is hailed as a great president because we did not have war. Of course that is debatable. But Eisenhower was elected on a platform of policies that woudl invigorate growth. Over and over he punctured economic growth on a skewer of a balanced budget by cutting spending.
This is not to say that the Democrats solution of giving whikey to a drunk is any better and it is not to say we do not have a bloated budget. It is to say that the economic results of both parties are disastrous.
Ricardo-
The addictive policies of continued current account deficits and credit expansion disproportionate to tradable production over the last four decades have resulted in our current paradox. No government policy, short of war and theft of resources, will result in net GDP growth… We tried that in Iraq and came out poorer than when we went in. We’re too civilized now to subjugate and dispossess an entire country.
For clarity – Are these cuts to the baseline “projected increases”? Or, are these year-over-year increases in actual spending, being labeled as “cuts” because they are below the budgeted increase in spending?
Menzie: You are so far behind the curve with all this ZLB talk. In the typical DSGE that you rely so heavily on, the ZLB is only important if the Fed can’t raise inflation. Why don’t you have a look at actual inflation data and then re-access your opinions. By the way, what do those CBO models have to say about QE? Don’t you think that may be the slightest bit relevant? You may also want to have a look at your co-author’s views on this matter, because he put this issue to rest over 4 years ago.
Jeff: Thank you for your comments. (1) I don’t know why you say I “rely heavily” on DSGE’s. I think I’ve been quite clear that I think they’re useful, but not the be all and end all; I’ve just cited them a lot because a lot of individuals apparently believe that all DSGE’s yield small effects from fiscal stimulus. The key point of the survey on fiscal multipliers I wrote was the fact that the literature is coalescing around a consensus that this characterization is inaccurate.
(2) The Fed has been implementing extended guidance regarding the policy rate for several years, without pushing the expected inflation rate substantially. This suggests to me that while the expectations route in theory should allow circumvention of the liquidity trap, thus far in practice it hasn’t proven incredibly powerful. Indeed, if you are a believer in the expectations hypothesis of the term structure and Fisher hypothesis, then there is very little impact on rates via the expectations/extended guidance route. As you linked to, Jim had an opinion in 2008 regarding the irrelevance of the liquidity trap; I don’t know if he has the same beliefs, especially given the political constraints that have been imposed on Fed actions.
The DoD cuts will actually be deeper than the CBO chart indicates. Deputy Ashton Carter determined that not only were FY2013 appropriations subject to the sequester, but so were previously authorized appropriations not yet “executed” going back to FY2009 for aircraft, ship and construction projects and going back to FY2011 for ground combat equipment. So the normal appropriations carryover that is rolled into the historical time series will be jolted.
It gets worse. The press has been pointing to 1 March as the sequestration date. In fact, very few of the sequestration cuts will take effect on 1 March because various laws effectively push that date out to 1 June. For example, federal employee furloughs will not commence until 1 June. In other words, the sequestration shock will not be spread out over 7 months (March through September), but will be compressed into 4 months (June through September). Terminating contracts will also take about 60-90 days to get through the various legal hoops. This points to a fairly large shock to 2013Q3 GDP.
Menzie: I said “heavily” because just about every post you have regarding fiscal policy is supported with multipliers from some DSGE model. If you don’t like heavily how about regularly, routinely, repeatedly…
The rest of your comments are just off-mark. The main point is that since 2009 the Fed has been running inflation around 2%, presumably right where it wants it to be. If we are in a world in which the ZLB had any bite, that would not be possible. This is the central issue at hand because the merits of all your policy implications rest on that one fact. A fact you have assumed to be true contrary to recent historical evidence.
Now if you want to argue that you don’t expect the Fed to be able to target inflation so carefully going forward due to political constraints then do that. Personally, I’d be curious to hear that argument given the Fed essentially has unlimited QE capacity. But please don’t simply assert that “we are clearly in a liquidity trap” and pass that off as any kind of thoughtful analysis. That is nothing more than (weakly) justifying your prior belief.
Jeff: By my count, of 8 posts since Jan 1 on fiscal matters, two invoke DSGE’s. If you want to define that as “heavily”, please go ahead and define it thus.
I don’t understand what it means to say if we were in a world where ZLB has bite, we could not have 2% inflation. I would appreciate a reference to a model that yields that implication.
So, if I understand your argument correctly, when DSGE simulations interpret (and then simulate) monetary accommodation as interest rates held constant (thus deviating from either a Taylor rule or IFB), as in Coenen et al., AEJ Macro 2012), they are just plain wrong in defining it thus?
Well designed easy to read and use the hereunder, Federal Reserve website content is nevertheless providing for a very bleak picture of the economic activities. The Federal reserve balance sheet is of 3.2 trillions USD and could be lifted up to 4 Trillions of the US GDP throughout 2013.
http://www.federalreserve.gov/monetarypolicy/bst_recenttrends.htm
The same through ECB data warehouse, large amount of floating liquidities, the ECB balance sheet would be in a range of 2 trillions euros.
The ECB website would gain with better outlays.
The commercial paper is a benchmark of a real commercial activity.
The same volume attrition was recorded during the great depression as liquidities were plentiful but discountable acceptable commercial papers were scarce.
Commercial Paper Outstanding (COMPOUT) Fred data
A reading, liquidity trap is not a mere vocabulary as an expanding share of the USA GDP is immobilised and require portage, against 13.3 % within Europe where geographical location and users should be identified.
A reliable indicator of above comments on liquidity trap.
Velocity of M2 Money Stock (M2V) Fred data
Slug wrote:
Terminating contracts will also take about 60-90 days to get through the various legal hoops. This points to a fairly large shock to 2013Q3 GDP.
Yep. Combine that with the massive tax increases along with the disaster of Obamacare and you begin to understand why it is called the “fiscal cliff (Republican)/taxamageddon(Democrat).”
Recovery? What recovery?
Look at US gov’t debt to GDP.
It’s worse when adding in local and state debt to GDP.
Fiscal deficits adding to federal public debt no longer result in growth of GDP.
But it’s worse. At the 10-year nominal and real GDP trend rates of 3.7% and 1.6% (2% and ~0.5% since ’07, and negative real per capita) and federal spending to GDP of ~24%, cutting federal gov’t spending and/or reducing the fiscal deficit via tax hikes and merely preventing growth of federal spending, war making or otherwise, will reduce trend nominal GDP by ~1-1.5%/year, all else equal; that is, it will reduce the nominal GDP trend rate since ’07 to less than 1% (read Japan).
It’s not just a private sector “liquidity trap” but a “fiscal trap” consisting of a big hole we’ve fallen into and are compelled to continue digging deeper.
Expanding fiscal deficits by adding public debt, the Fed liquidating bank balance sheets, and higher costs to labor and employers from Obamacare will do nothing to relieve the following structural conditions bearing down on the US economy:
Too much private and public debt to wages and GDP.
Peak Boomer demographic drag effects occurring between now and the early to mid-’20s (as in the case of Japan from the late ’90s and early ’00s).
Obscene wealth and income concentration to the top 0.1-1% to 10% of US households.
The high price of oil and gasoline constraining incremental consumer spending and domestic business investment and hiring.
Low-velocity hoarding by the top 1-10% of surplus financial capital/savings in the form of overvalued corporate equities of the Fortune 25-300 firms.
Labor arbitrage, offshoring, and automation of labor and loss of wage income and purchasing power continues to reduce labor’s share of GDP and constrain consumer spending growth for the bottom 90% of households.
Bruce –
“Fiscal trap”. I like that. Apt.
Menzie A bit off topic, but since Jeff and Rick Stryker have both invoked the miraculous healing powers of DSGE models, maybe it’s time for an azimuth check. So let the ranting begin…
As a non-economist it seems to me that DSGE’s were born-and-bred for the world of 1977-2007, not the world of post-Great Recession. In the current context I don’t get how the “dynamic” parts of the model are significantly different from the old static IS-LM model. For example, the dynamic “IS” equivalent in a typical DSGE model looks for expectations in interest rates, future consumption and price levels. I look around and ask “what changes?” So I don’t see how the DSGE “IS” curve is materially different from the Hicks IS curve…again, speaking only about the current economic environment. And while a DSGE supply function is more sophisticated than the old AD-AS model, given the large output gap, weak intermediate firm pricing power, high unemployment rate and weak wage growth, can we say that a DSGE NK Phillip’s curve is any better than a simple AS curve? The DSGE supply function was built for a world characterized by full employment, wage push inflation pressures and meaningful inflation trade-offs. I don’t think that describes any supply function in today’s world. And given the 10 year interest rate it doesn’t sound like anyone expects future supply functions to look like that world. What about the monetary transmission function? Can a DSGE model improve upon a flat LM curve?
So what about the behavioral assumptions that are supposed to guide intertemporal dynamics, which is at the heart of DSGE models? This kind of thing makes sense if there is some widespread agreement about the underlying economic model. And post-70s up to the Great Recession there was widespread consensus. People anxiously read the entrails of the Fed’s minutes. The idea of forward looking “rational expectations” made sense because everyone shared a common model and shared basic economic facts (i.e., no one took Shadowstats seriously). I don’t think you can say that today. People seem to look more to adaptive expectations than rational expectations.
And what can we say about the assumption that markets clear in each period?
I’ve come to believe that part of the problem is that increasing specialization within the discipline means that economists usually only know one model, so if you were brought up learning DSGE models, then you’re stuck with that framework. If all you’ve got is a hammer, then all problems look like nails. The DSGE model does a good job of explaining the world of 1977 through 2007. But in a ZLB world I think the old 4-corners IS-LM model provides better insights. Economists don’t yet have a unified grand theory, so I don’t understand the reluctance to pick and choose models as they fit the circumstance.
Rant off.
slug writes: “I’ve come to believe that part of the problem is that increasing specialization within the discipline means that economists usually only know one model, so if you were brought up learning DSGE models, then you’re stuck with that framework. If all you’ve got is a hammer, then all problems look like nails. The DSGE model does a good job of explaining the world of 1977 through 2007. But in a ZLB world I think the old 4-corners IS-LM model provides better insights. Economists don’t yet have a unified grand theory, so I don’t understand the reluctance to pick and choose models as they fit the circumstance.”
slug, first, be grateful you are not an eCONomist. Second, eCONomists operate on at least two fundamentally flawed premises (one should be charitable when possible), namely, that (1) the ecological system is a sub-set of “the economy”, which it clearly is not; and (2) debt/GDP or debt/wages is not a critical bound constraint, when it obviously is.
Most eCONomists aren’t even that good at accounting (or they learn to rely on a flawed income accounting system which does a lousy job of account for actual costs); otherwise, they would know that limits for debt to income exist.
Most economists are trained to ignore biology, psychology, biochemistry, climatology, geology, and physics/thermodynamics; otherwise, they treat the factors associated with these fields as “externalities” (we don’t know how to account for them, because we don’t want to, or we don’t get paid to).
Historically, debt cycles last a half-century or longer; that is, it takes that long for the cumulative differential growth of debt to wages or GDP to reach an exponential order of magnitude, at which point debt (money inflation and its imputed compounding interest claims thereafter) must grow at a super-exponential rate to avoid debt deflation. Oops! That “model” has been known since the Sumerians, Babylonians, and Hebrews. Oh, yeah, and eCONomists are no longer taught economic or financial history; or what they learn is incomplete or biased in favor of the fashionable eCONomic school of thought.
Over the very long run, the best data available indicate that real GDP per capita is a linear (not exponential) function of the rate of growth of population and labor and capital replacement at a systemic log-linear exergetic limit bound constraint. While this is probably intuitive to the “unenlightened” non-eCONomist, it is virtually unknown or rejected by the received wisdom of the eCONomic intelligentsia.
Were these observed limit bound constraints to be acknowledged, closely examined, models constructed and tested, and internalized by a growing plurality of eCONomists, the discipline would have to hit the reset button and start over from scratch, i.e., the ground up, literally, risking shutting down the academy and requiring of the academicians to do something more valuable, or less harmful, with their time.
“the Federal government will begin implementing $85 billion worth of across-the-board cuts during FY2013”
Strange that this is precisely the number of dollars of debt the Fed has committed to monetizing into eternity?
2slugbaits: I agree with many of the points you make — in particular the limited relevance of many NK DSGEs to current conditions. However, DSGEs can incorporate intertemporal effects better than the standard macroeconometric models. In addition, one can do welfare analysis in DSGEs (and in a optimizing framework, consistency across sectors in terms of saving consumption, etc., is more plausibly imposed). It’s harder to do the latter in structural macroeconometric models.
So, much depends on what purposes you want to use these models for.
For my purposes, I’d want to introduce financial frictions into NK DSGEs, rather than to just say structural macroeconometric models are better. My guess is eventually, the NK DSGEs will exhibit properties a lot more like macroeconometric models in the Neoclassical synthesis than they do now.
Menzie: I didn’t bother to search through all your old fiscal policy posts, but I have been paying enough attention to know that you have been trumpeting additional fiscal policy for many years now. And this conclusion is based upon your belief that the fiscal multiplier is greater than 1, which you in turn justify with NK/DSGE models. To try and now say that you don’t always directly cite to them in each post is at best a semantic dodge and at worst blatantly dishonest.
As to your first question, pick your favorite NK/DSGE model. In that model you will most likely see that AD is determined by real interest rates, inflation, and some exogenous discount factor(s). Assuming the third is fixed and out of the control of the Fed, we’re left with interest rates and inflation. You want to argue that because interest rates are at the ZLB, the Fed is stuck and can not control AD, i.e. the ZLB has some bite. But that is only true if the Fed can’t control inflation. And when I see the Fed carefully maintaining inflation around 2% for the last 4 years I find that claim very dubious. This is rather simple analysis from just a basic understanding of the models. If you don’t see that then perhaps you should spend more time reading beyond the tables.
And to you second question, yes I agree with Bernanke (and others) that interest rates are a poor measure of the stance of monetary policy. But I’m not going to say the models are wrong. An author can define variables however they want. I’m only going to say what I have been saying–that any conclusions drawn from dubious assumptions/definitions are not very useful.
If you look where the cuts come from, for the most part, it’s stuff the GOP wants to cut anyway. I feel like they’ve played it so the sequester would take place and never had any intentions otherwise.
Austerity has been horrible in Europe and most places in recent years…while we need to get our finances in line, this is def not the way.
Hope they get it resolved without a sequester.
Best Wishes.
Jeff: OK, I’ll just call that “fact free analysis”.
Here’s my favorite NK/DSGE. Looking at inflation in CPI-all, calculated as 12 month changes, I see plenty of deviations from 2%. Maybe you don’t. Clearly, we don’t see the same things along many dimensions.
Jeff In that model you will most likely see that AD is determined by real interest rates, inflation, and some exogenous discount factor(s). Assuming the third is fixed and out of the control of the Fed, we’re left with interest rates and inflation. You want to argue that because interest rates are at the ZLB, the Fed is stuck and can not control AD, i.e. the ZLB has some bite. But that is only true if the Fed can’t control inflation. And when I see the Fed carefully maintaining inflation around 2% for the last 4 years I find that claim very dubious.
You’ve confused me. Are you saying that the Fed could (but won’t) target inflation higher than 2 percent? Note that even with a 2 percent inflation rate the Wicksellian market clearing rate is well into negative territory, which means the real rate is quite high. So even if the Fed were able to fix inflation at 2 percent (and I believe the Fed is struggling mightily just doing that much), that would not mean the ZLB wasn’t biting. Or do you think the Fed should be pursuing an inflation rate of (say) 4 percent in order to get beyond the Wicksellian negative rate? If so, then what kind of signal would a 4 percent target send inside a DSGE model? And if Bernanke did try to target inflation to 4 percent do you think it would be safe for him to visit the Dallas Fed in Gov. Rick Perry’s Texas?
Menzie:You’re off topic still. The point isn’t that inflation have been perfectly steady at 2%, the point is that the Fed still has control over inflation levels and the ZLB has no real consequences for monetary policy. If you have any real points to make regarding my arguments I’d still love to hear them.