More analysis from the Heritage Foundation
In a recent post, economist Salim Furth holds forth on the recent CBO Budget and Economic Outlook. In his explanation of why the CBO has repeatedly overpredicted growth, he writes:
The release of the Budget and Economic Outlook gives economists, policymakers, and observers a framework to raise questions about the health and future of the American economy. Beyond the truism that the economy is in a nasty slump, data and theory indicate that the economy is worse than one would expect based on economic factors alone.
The policies of the past five years have systematically harmed the economy in both the short run and the long run. Policies aimed at the unemployed have decreased their rewards from work. Policies in the business sector attenuate the pressure to innovate and adapt, allow established firms to reap profits without improving their products, and shrink the overall “pie” in order to serve a bigger slice to those favored by government. Policies on taxation have twice increased tax rates on capital, discouraging investment and lowering GDP.
Dr. Furth attributes overprediction by CBO and other forecasters to (1) the inherent difficulties of forecasting, (2) the debt overhang and other shocks, and (3) poor policymaking in Washington. On (2), he writes:
Economic factors such as private and public debt overhang, Europe’s depression, economic uncertainty, or pessimistic financial markets can all slow growth and have certainly contributed to the slow recovery. But these elements are usually taken into account by forecasters. They may explain why the forecast does not predict even stronger growth, but unless the problems are getting progressively worse over time, they do not explain why the economy continues to underperform.
The Rational Expectations Hypothesis in Forecasting
The implication of this argument is that (3) is the cause of the continuous downward revision in GDP growth forecasts. But before leaping to that conclusion, let’s consider his basic assertion about why the forecasts get revised downward over time. In an equilibrium rational expectations framework, where all agents understand the model governing the economy, and we are in a steady state, forecasts errors should be unbiased and serially uncorrelated (actually, it’s stronger — the errors should be true innovations). I have two observations. First, I wonder if people properly incorporated the depth and extent of the Euro zone crisis and other events into their 2009 forecast (I will admit that in 2009, I did not foresee the Libyan civil war and the resulting surge in oil prices in 2011 either; hence that is an exogenous event in my conceptual framework — but perhaps others were more prescient than I). (I will further note that the empirical evidence regarding forecasters in the real world is somewhat at variance with the idealized Rat-Ex world I have just described — see Loungani, Stekler and Tamarisa, 2011.)
The Reinhart-Rogoff Stylized Fact
Second, by far the most interesting aspect of Dr. Furth’s argument is the assertion that most forecasters incorporated the implications of Reinhart and Rogoff’s findings into their forecasts. I think it’s too easy to forget how long it took for this view to become incorporated into the conventional wisdom. For instance, the last Bush CEA report (January 2009) [1] did not, and according the blue chip forecasts around that time, a relatively quick bounceback was forecasted. [2] So I am dubious of the proposition that continuous downward revisions are primarily attributable to bad policymaking. Rather, I think it’s the slow realization in the profession that balance sheet financial recessions are different. (That being said, continuously driving the government to the brink of default –- either technical or actual –- cannot be particularly helpful to recovery. [3])
Interestingly, while Dr. Furth cites Reinhart and Rogoff’s results about the slow pace of growth in the wake of major financial crises, he does not cite this recent Reinhart and Rogoff piece that is particularly relevant in addressing the question at hand.
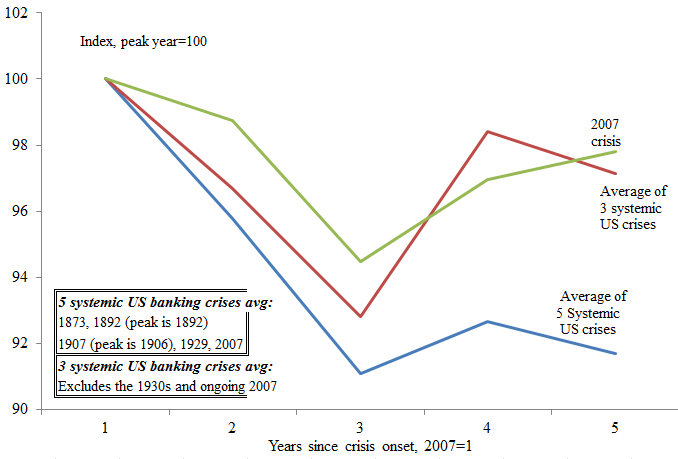
… we assess how the US has fared, so far, compared to other advanced economies that experienced systemic financial crises in 2007-2008 as well other advanced economies that experienced borderline episodes. Focusing on real per capita GDP, we show that
- The recent crises patterns confirm our earlier result that the countries that recently suffered systemic financial crises have generally fared quite poorly compared to countries where the financial problem was less severe, that is, those with borderline crises; and
- Although tracking worse than the countries that did not have systemic financial crises, the US output performance is, in fact, among the best of those that did.
Reinhart and Rogoff provide this graph, comparing against US historical experience:
(I am tempted to call this a Marshall McLuhan moment! Or a “Lazear-ism”)
In addition, Moritz Schularick and Alan Taylor provide a cross country comparison of recent US performance, based upon a regression methodology. (More discussion here)
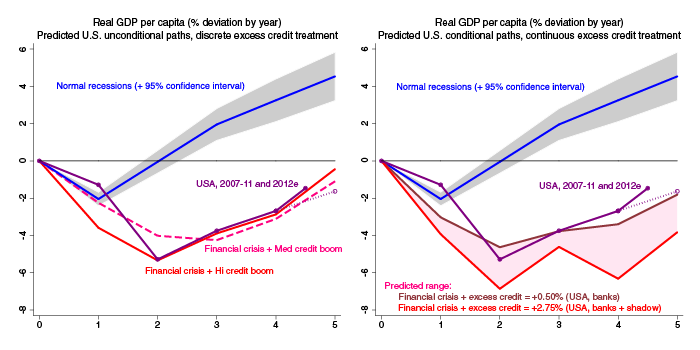
Source: Schularick and Taylor, “Fact-checking financial recessions: US-UK update,” VoxEU (October 2012).
So, it might be that the worsening outlook relative to prediction is due to increasingly bad macro policy making (my candidates differ from Dr. Furth’s), but I would say a more important aspect is that more and more forecasters have recognized the basic truths of the Reinhart and Rogoff and Taylor et al. findings.
Notes on Footnoting
Finally, a mis-interpretation alert: Dr. Furth writes:
CBO concludes that the U.S. has reached a level of debt at which growth will probably be harmed.
A footnote is provided (a good thing!) citing Congressional Budget Office, The Budget and Economic Outlook, p. 35. I turn to page 35 in the CBO document and find:
…less fiscal tightening this year would lead to stronger growth in 2013 but, if not accompanied by sufficient additional tightening in later years, would also restrain real output and income in the middle of the decade and beyond owing to higher federal debt.
Perhaps I am missing the relevant text, but if this is the one Dr. Furth is quoting, then I am puzzled.
The CBO alludes to the middle of the decade and beyond; and it’s a conditional prediction. According to my calendar, we’re not quite there – so I am not sure Dr. Furth’s description of what the CBO is saying is the same as what the CBO is saying. It’s a seemingly minor point, but as an academic, I like to accurately quote my sources.
I believe the CBO figures are directly connected to higher interest costs; they project a better economy and thus higher interest rates and thus more cost of debt. That means cutting back when the economy is growing will have the effect of reducing the gross amount of debt and the cost of carrying it. I didn’t see any indication the words meant more than that.
My view is that the economy has been transitioning over the past 4 decades from one of high labor income to one of low labor income. Here is a link to a full presentation of how I see real GDP, potential real GDP, labor income and capacity utilization since 1967.
https://docs.google.com/file/d/0BzqyF_-6xLVEaEFGSmJUaW9xTDg/edit?usp=sharing
it’s a long presentation with graphs for every quarter since 1967.
On another note, the regression of my equation for the natural rate of unemployment shows the following statistics. (1967 to end of 2007, before the crisis). The equation from a graph plot is…
unemployment rate = 4.26 + 18.9*UT^2 + 2.4*UT
I’ll just mention a few points.
The standard error on the y-intercept is 0.13. This value of 4.26% was the natural rate of unemployment for decades before the crisis.
The t-stats are (intercept=32.5, UT=2.5, UT^2=6.7)
The p values are (intercept=1.12E-72, UT=0.014, UT^2=4.15E-10)
The data since 2009 for the UT equation shows a rise in the rate to around 7%.
The UT equation is…
UT^2 = unemployment – capacity utilization + (0.78 * labor share)
For the past 5 quarters, UT has been between 17% and 21.4%!!!!
The economy is stuck in the UT zero lower bound resistance zone and too weak to utilize more labor and capital. but this problem is not caused by the policies of the last 5 years as noted in the above article. The transitioning has been going on for decades.
And again, no word on oil.
The price of oil continues to be above US carrying capacity. Thus, consumption will continue to fall.
And if consumption falls, then GDP must be able to offset this loss with increased efficiency. And how fast can that happen?
Try this graph as an exercise. Index to 2005=100:
– US light vehicle sales
– US vehicle miles traveled (STEO)
– US oil consumption (STEO)
Let’s see what it looks like.
Steven Kopits: Are you referring to Dr. Furth/Heritage Foundation, or to me? I wrote: “(I will admit that in 2009, I did not foresee the Libyan civil war and the resulting surge in oil prices in 2011 either; hence that is an exogenous event in my conceptual framework — but perhaps others were more prescient than I).”
You, Menzie. Try the graph, see what it might infer.
I have to tell you, I am looking at oil data all the time, and I don’t like what I see.
Goldman just came out with a terrific little report on unproductive capital in the oil sector. Unproductive capital (capex-in-progress divided by capital employed) will have increased from around 4% in 2004 to 23% in 2015. That’s a heck of a lot of dead capital and it implies an increasing effective cost of capital.
Further, global oil production–ex-oil sands and US shales–was actually down Q4 on Q4 2011. I spent a good part of the afternoon on the phone with an oil geologist, and he says, “So tell me, why are rig counts down in the Bakken?” Why, indeed, if shales are to save the US oil business.
And the industry forked over $640 bn in upstream spend in 2012! You think that might be gutting innovation elsewhere? That’s $300 bn more than just five or six years ago. That increment’s almost the GDP of Hungary and the Czech Republic combined!
Meanwhile Petrobras is struggling with cost issues and Saipem, an offshore construction and engineering firm, blew its Q4 numbers big time. How can Petrobras be struggling with costs at $110 Brent? Any yet, that’s where we are on the cost curve.
This whole oil issue has by no means gone away–and if the shales slip or fail to find traction in other countries, then we will see outright declines in production, I think. So high oil prices are, in fact, reflecting a real crisis in the upstream sector, one which is likely to get worse, not better.
Now, you’ve chosen to largely avoid the issue of oil and economy. I think that is misguided, and it’s going to lead to some wrong conclusions.
For example, you note that everyone’s blowing their GDP forecasts and no one really knows why. Well, I have a pretty good idea. You should, too.
It is also affecting the views of other policies. Consider: the rationale for counter-cyclical spending is looking terrible (re: last post). But if you have an oil problem, then the Keynesian argument may not be quite as bad as it looks. You can’t stimulate your way out of a supply shortage for a critical commodity. If you try, it just looks like the policy was a failure. But it may be rather that the problem was misdiagnosed rather than that the solution was wrong.
Here’s my forecast. If the US manages to gain some strength, we’ll see oil prices pop right back up and US GDP performance will fade. That’s exactly what’s happening right now. We’ve seen a bit of strength in the US economy, and oil prices have popped right back to the $117 level. If the US continues to progress, the oil price will keep right on rising until the economy flags again. That’s my model, and it’s been working fine since 2010.
You should take the time to see whether a supply-constrained model provides you better insight and guidance than a demand-constrained one.
So, try the graph. It’s just numbers. See what it says to you.
Steven Kopits And if consumption falls, then GDP must be able to offset this loss with increased efficiency
So are you arguing that even in the long run all isoquants are Leontief?
Menzie So is Dr. Furth implicitly arguing that macroeconomic forecasting was better before the Great Recession? Many years ago I remember reading some paper (in Econometrica???) that compared private forecasters with academic forecasters. Neither group showered itself in glory, but academic forecasteres did marginally better.
Steven Kopits: Well, I did mention oil in the post, so I’m not certain why you are so critical (Dr. Furth is the one who made no mention). I believe oil prices are important, but I leave most of the analysis to Jim who has the comparative advantage in this area.
I did discuss energy in this post. It’s just that I think other things are important too.
The economics biz–and this includes Jim–still focuses primarily on oil shocks and speculation.
I have argued that oil shocks and speculation can be explained as a result of price demand inelasticity. Put another way, consumers reduce consumption too slowly when oil prices go up–under conditions of price inelasticity.
But can we toggle through to conditions of elasticity? Is oil demand always price inelastic? If not, under what conditions would we expect this to change?
If oil demand is materially elastic–and I would argue it has been in the US since mid 2010–then supply/demand pressures will not manifest themselves as the sorts of visible and compelling episodes we saw in mid-2008. Rather, consumption will experience a slow grind-down, as the emerging economies bid away OECD consumption levels. The US consumer will not fight to hold consumption; rather, he will yield it when market conditions so dictate.
Importantly, this does not mean we do not have oil problem. Rather, it means that the problem will manifest itself in declining consumption rather than spiking prices. So the problem is not really visible to economists like yourself who do not track these sorts of statistics on a regular basis.
Moreover, we have good reason to believe this decline in consumption will continue. Thus, the question which needs to be answered is not whether there will be price spikes or speculation, but rather whether efficiency gains can offset declining consumption.
Now, Jim has tossed in 2.5% as the long term rate of likely efficiency gains for oil in GDP. He didn’t particularly defend the number, but in my experience, Jim has an uncanny sense for these sorts of things.
My number is higher–at least for good years. In the last six quarters, for example, oil efficiency has been increasing at 3.8% on average. But remember, these efficiency numbers look quite good in expansion years, and often are much worse around recessions.
Since 2005 (when the oil supply stalled), the average efficiency gain has been 1.9%. So Jim might not be right, but the aggregate data since the oil supplied stalled in 2005 very much support his view.
At the same time, I have forecast–and events have validated–that US oil consumption will decline by 1.5% per annum on average. That number was and remains entirely solid.
So, if I take Jim’s and my number together, then long-term GDP growth for the US is capped out at 1.0%. If I take 3.8% efficiency improvement for good years, then growth is capped out at 2.3%.
That’s what we’re talking about here. If you’re using this model–an oil supply-constrained model–then neither slow US GDP growth, the failure of the stimulus, the differentiated performance between the US and Europe/UK, nor productivity puzzles are difficult to explain. When Tyler Cowen talks about an innovation deficit, I can see how $300 bn of ineffective capital (compared to say, 2000) in the oil business per year might cause that. It’s clear why the fiscal crisis affected virtually only the OECD countries (the oil donors) and not the non-OECD countries (the oil recipients). All of these are consistent with a supply-constrained model, and they’re not convincingly explained by anything else.
So that’s where we are, Menzie. If you think the US economy can do 3% GDP growth, then you also believe that it can increase oil efficiency per unit of GDP at a 4.5% pace.
Do you believe that?
The footnote you critique is not really open to much criticism. The middle of the decade starts in two years! (I looked at the CBO document–middle of the decade means 2015, not the middle of the 2013-2023 decade under analysis.)
So the CBO is saying that ongoing debt accumulation will slow econ growth in 2015 and beyond. This is an HONEST inference as to the CBO text. But some are so wedded to the ‘debt can’t hurt growth’ position, that honest readings are hard to come by.
If we can forecast that austerity will harm 2013, then surely we can forecast that unabated debt accumulation will harm 2015, wouldn’t you say?
Although motor gasoline for light vehicle use is the largest single use of oil in the U.S. it is not the only use. Last time I checked it represented about 45% of consumption. Hence, miles driven and light vehicle fleet mpg are not the only levers for increased oil usage efficiency. While we need to lean on those levers, other levers allow for quicker and easier oil savings. Due to market inefficiencies (I think imperfect information is the biggest factor but there are others), policy needs to lead on energy. A simple example would be the national adoption of CARB standards on freight fleet aerodynamic efficiencies. Another would be eliminating heating oil appliances. Another would be converting our 25000 diesel locomotives to LNG.
Steven Kopits: From 1979 to 1986, oil intensity per unit real GDP declined at a 4.4%, using the oil series Jim used recently (calculated as 4 qtr annualized log differences in the ratio). Now, I don’t think that we necessarily will have that fast of oil intensity decline, given that that occurred during a period of relatively easy transition from oil to coal fired generators; but I also don’t think of fixed relationships in order to sustain growth of 3% of potential GDP. In particular, other variables (including capital deepening, multifactor productivity growth) are also important.
Anthony Juan Batista: Well, if you think it’s honest, that’s your prerogative. I know standards have slipped in the world of citation. For myself, I like to be careful — because it’s my job to be accurate (wouldn’t fly in a dissertation or term paper submitted to me! Maybe for your grading standards, you’d accept it). I also flagged the conditional nature of the CBO statement – something missing from Dr. Furth’s assessment.
2slugbaits: I suspect that Dr. Furth is arguing that whatever forecasting errors occur, when they are serially correlated, it must be due to policy having effects that are unanticipated-ly good or bad, especially when long term growth projections are repeatedly revised downward. (He does seem to rule out hysteresis, but that is another matter).
Anthony Juan Batista So the CBO is saying that ongoing debt accumulation will slow econ growth in 2015 and beyond. This is an HONEST inference as to the CBO text.
But that’s not how Dr. Furth interpreted the CBO’s note, and the difference is in the tense. Dr. Furth is referring to the present tense (i.e.,”has reached”); CBO was talking about the future tense (i.e., “will”). Dr. Furth said that “the U.S. has reached a level of debt at which growth will probably be harmed.” The CBO said that debt reduction efforts right now would be bad and that what the economy needs right now is less austerity:
“…less fiscal tightening this year would lead to stronger growth in 2013”
CBO is calling for fiscal tightening after the economy recovers, which CBO expects to be sometime around 2015.
Dr. Furth’s intepretation gets the timeline all wrong. Dr. Furth misinterpreted CBO’s comments to mean that we should immediately begin fiscal tightening.
See the difference between what CBO said and Dr. Furth’s misinterpretation?
I have stated that we should be prepared, ceteris paribus, for GDP growth rates in the 1.0%-2.3% range. You are instead proposing that we emulate the 1979-1983 period–the second oil shock! This was the period of stagflation, the Volcker interest rate spikes, and two brutal recessions.
That’s your model?
That’s much worse than what I have suggested.
Now, since you’ve brought it up, let me explain the similarities and differences between the post-1979 period and today.
After 1979, oil prices stayed high because of a supply shock. Notably, the Saudis decided to defend an oil price and reduced their production to defend this price. Global oil consumption fell during that period by 6 mbpd and productive capacity rose by 7 mbpd. By 1983, the world had 13 mbpd spare capacity on 54 mbpd of consumption, that is, a productive capacity overhang of 25%. This overhang took a generation to absorb, a period known as The Great Moderation.
Importantly, all the major consuming countries, including the United States, reached peak per capita oil consumption in 1979. And new productive capacity came on line very quickly, notably in the Gulf of Mexico and North Sea.
Thus, both the supply and demand responses were rapid, large, and sustained.
Now consider the current situation. The oil supply (crude + lease condensate) is up about 2.1 mbpd from 2005 through 2011 (BP data), that is, in six years. Recall that supply increased by 7 mnbpd in just four years post 1979. Clearly, some responsiveness has left the system.
And demand is up by anywhere between 4-6 mbpd, depending on how you count it. So there has been no collapse in demand, as we saw after 1979. Just the opposite. Inherent (underlying) demand is in fact very strong.
And, of course, spare capacity was 25% of consumption in 1983; today it’s barely 3%, and we’re not even sure we can draw on that. Again, we were able to create 25% spare capacity in just the four years after 1979; in the eight years since the oil supply stalled, spare capacity is essentially minimal and unchanged from that time.
Finally, keep in mind that 1979 was a supply shock. We haven’t had a supply shock yet! The oil supply has in fact grown. It just hasn’t kept up with demand. This whole malaise is simply because the non-OECD is bidding away our current consumption. But China has been able to increase its oil consumption and has been able to grow–which should help us, too.
Now imagine what would happen if the oil supply started falling in absolute terms. And that could happen. As I stated before, at the moment, the only bulwark between us and a falling oil supply are the shale oils and the Canadian oil sands. Canada’s oil sands had a great year, but the experts tell me that 150-200 kbpd / year is about what can be achieved up there.
The shale oils will run for a while, but the economics are somewhat strained there, too–hence the falling rig counts in places like the Bakken.
So we’re not in 1979–yet. We’re in 1978. This can get worse, and it might.
If I were you, I wouldn’t be wish for us to respond as we did in 1979–that was a terrible period.
As usual, the Heritage Foundation is trying to take a measured, considered, and balanced approach to explaining why the CBO and other forecasters continued to be too rosy. Despite that, Menzie nitpicks about a footnote. Heritage can’t win.
But the reason these forecasters got it wrong is simple. These forecasters believed their own BS. And they continued to believe it despite the evidence. But when reality finally sank in they didn’t want to say to themselves, “Gee-I guess all that multiplier stuff and other crap I believed in doesn’t work.” They needed a scapegoat. That’s where Reinhart and Rogoff come in. They can hide behind R&R and say that their only fault is not realizing how bad a balance sheet recession is. It’s a banking crisis after all. Bad things happen after a banking crisis. Just look at history. It’s not the Administration’s fault. It’s not my fault.
But it is your fault and and it is the Administration’s fault. You need to look at history a little more deeply. If you do, you’ll see previous crises are substantially different from the current situation. The only thing they have in common is bad policy during and after the crisis. The banking crisis of 1873 involved a monetary contraction with commodity based money. Policy was bad. Similarly, policy was bad in the Swedish banking crisis in the early 90s. Sweden was in the ERM and tightened monetary policy very substantially in order to defend the peg. Not a great idea with a banking crisis.
In the current situation, here’s how I’d rank the bad policy choices that have helped turn the recent downturn into something similar to historical banking crises. In order of importance:
1) The banking system was substantially weakened after the financial crisis. What did the Administration do in cahoots with the Europeans? Dodd-Frank, Basel 2.5, Basel 3 and a host of other damaging policies, which had very little to do with correcting the problems of the crisis but piled costs on the financial system at a time when it needed to repair itself.
2) Tax hikes and austerity in Europe
3) Obamacare, which produced substantial uncertainty for business
4) The stimulus. I put this last because it had no effect on the economy. It was just a big boondoggle. But it did introduce further uncertainty in the long term fiscal situation and poisoned the political atmosphere.
At least you have to give credit to the Administration for not raising taxes like the British did. That’s one of the reasons the U.S. economy is performing better.
Steven,
I have long held the same view that gdp and energy prices are range bound. The two covary such that economic activity expands until rising energy prices choke off growth. The opposite occurs as economic activity and energy prices fall.
However, your grasp of the issue is much stronger than mine. I am wondering if energy prices can actually play such a major role, when we are told that energy accounts for only a small (4%?) fraction of consumer spending. I know Jim has referenced the figure before, but I don’t recall the actual number. Is it higher in the non-oecd?
I’d appreciate it if you can share your insight on reconciling the forecast of an increase in the degree of covariation between economic activity and energy prices, given the small role that energy plays in the consumer’s budget.
Rick Stryker: The footnote constitutes only a portion of the post.
I like the phrase “hiding behind R&R”. By the way, I’d like to know (1) if you dismiss Alan Taylor’s work as well, and (2) how does your publication record compare to R&R and/or Taylor et al.?
Finally, a note of thanks. I am going to print up and tape to my wall your comment “As usual, the Heritage Foundation is trying to take a measured, considered, and balanced approach”. It will be the gift that keeps on giving. So, thanks very much, Rick. Each day you comment is a day I can laugh and laugh. And laugh some more.
Rick Stryker First you said:
The stimulus. I put this last because it had no effect on the economy.
Then just a couple lines later you said this:
At least you have to give credit to the Administration for not raising taxes like the British did. That’s one of the reasons the U.S. economy is performing better.
And you don’t see a contradiction there? If fiscal policy had zero effect on GDP growth, as you seem to be suggesting in the first comment, then how is it possible that raising taxes hurts GDP growth???
Normalized liquids consumption for (2005) Top 33 Net Oil Exporters, China, India and the US, from 2002 to 2011 (2002 consumption = 100%), versus annual Brent crude oil prices:
http://i1095.photobucket.com/albums/i475/westexas/Slide2-6_zps2f713491.jpg
It seems likely to me that these trends will more or less continue. As I have occasionally noted, at the 2005 to 2011 rate of decline in the ratio of Global Net Exports of oil (GNE*) to Chindia’s Net Imports (CNI), in 18 years the Chindia region alone would theoretically consume 100% of GNE.
*Top 33 net exporters in 2005, BP + EIA data, total petroleum liquids
Menzie,
I’m glad your reaction to my comments is just to laugh. I wish I had your certainty. When I read your posts I don’t know whether to laugh or cry.
I think you are missing my point if you think I’m dismissing R&R, which I believe is extremely important and useful research. I’m actually defending R&R from being misinterpreted and misused. In chapter 10 of R&R, on banking crises, for example, they note the importance of a banking crisis as an amplification mechanism of a recession rather than the necessary cause. I certainly think that’s right and that’s why I listed the perverse banking regulation policies as being the most significant negative influence on the recovery.
But R&R go on to say:
“Also, banking crises are often accompanied by other kinds of crises, including exchange rate crises, domestic and foreign debt crises, and inflation crises; we will explore the coincidence and timing of crises in more detail in Chapter 16. Thus, one should be careful not to interpret this first pass at our long historical data set as definitive evidence of the causal effects of banking crises; there is a relatively new area in which much further work is yet to be done.”
Exactly. These crises are often accompanied by other kinds of crises. I gave the example of Sweden, in which its banking crisis also contained a bad currency crisis. In the 2008 crisis, we did not have anything like that. It’s important to look carefully at the similarities and difference of each banking crisis before jumping to conclusions.
Most importantly, R&R are wisely warning the reader not to take the evidence that they have culled as definitive because there is a lot going on simultaneously. Indeed, and those who consistently over-estimated the strength of the recovery shouldn’t hide behind R&R because R&R are not making strong claims that banking crises by themselves necessarily lead to slow growth.
Rick Stryker: Yes, R&R provide many caveats. But then can’t we rely upon Reinhart and Rogoff to interpret the US experience correctly? That’s why I cited the VoxEU article by Reinhart and Rogoff, where they note that the US appears to be doing well by the standards of balance sheet crises (or do they know nothing of their own work?). Also, I’d welcome your views on why the Schularick and Taylor results are irrelevant. Thank you again for your comments! Please keep them coming!
2slugbaits,
There is no contradiction. DSGE models show that temporary tax cuts have a multiplier less than 1. And the permanent income hypothesis is certainly consistent with that. I think Romer and Bernstein acknowledged that temporary tax cuts were problematic as stimulus as well.
However, permanent increases in marginal tax rates were enacted in the UK along with increases in the VAT. That’s bad policy most of the time and criminal during a struggling recovery. It’s good we didn’t do that here. Fortunately, it looks like they are planning to cut back the highest marginal tax rate from 50% to 45%. That’s a positive first step.
Economics used to be known, in the 18th century, as “political economy.” People who practiced the profession recognized the important input to economics from economics and human behavior.
Economists today seem to have chosen to mathematize the discipline in a way that leaves important inputs out of their equations. Take fraud, for instance. Where’s the input variable in those GDP forecasting equations that represents fraud?
The reason why Reinhart and Rogoff found (and other analyses confirm) that GDP slumps for a prolonged period after financial collapses isn’t hard to discern. Investors burned by fraud swear off investing for a generation, reducing the inflow of investment funds for starting new companies. Companies burned by fraud stop investing in new R&D and spend their cash reserves paying down bad debts. Banks burned by fraud stop lending to businesses and instead spend all their available cash to build up cash reserves and pay off toxic loans they’d had to write off at a loss. This reduces overall GDP grwoth for obvious reasons.
Where’s the input variable representing fraud? That’s one of the keys here, and I’m not seeing it. Economists seem to want to subtract human behavior from the economic system and rewrite the whole thing as a set of nice clean neat sterile little differential equations, but it doesn’t work that way in the real world.
tj –
US crude oil consumption, using Brent prices, represented 4.8% of GDP in Q4 2012. This is high by historical standards, although we can debate whether Brent–which correlates pretty closely to gasoline prices–is the best measure. We would expect, based on historical patterns, for the US consumer to continue shed consumption at these levels.
If we allow that 1 unit in every 21 in GDP was crude oil consumption, then this actually seems a pretty high number to me, considering all the other things we consume.
Why does oil inhabit a special place in the economy? Well, we speak of being “addicted” to oil. We are “addicted” for two reasons: oil is essential to mobility, and there are no ready substitutes for it.
Now, we hypothesize that mobility is essential to GDP, thus, oil is an “enabling commodity” in a way that, say, gold is not. Thus, you could reduce gold sales in the US to zero without material harm to the economy (although to the great chagrin of some Econbrowser commenters!)
On the other hand, if we reduced oil sales to zero tomorrow, I think few would doubt that the economy would grind to a halt and a severe recession would ensue.
The law which would appear to apply is Liebig’s Law of the Minimum. Liebig’s Law states that growth only occurs at the rate permitted by the most limiting factor. For plants, this might be water, temperature or light. Historically in economics we speak of production as a function of land, labor and capital. In recent times, land as a contributing factor has tended to fall out of fashion, suggesting that it is not the limiting factor in might have been in earlier times. Of course, energy is also a factor of production, but had been sufficiently abundant in recent times that it is rarely mentioned.
In any event, mobility of people and goods is a critical factor in the economy–and oil is unique in providing it. So, oil consumption is a relatively small part of the economy, but a large portion of economic activity depends on it.
I personally find constraint-based economics an interesting notion, particularly in growth theory. It’s been a while since I studied it, but I don’t recall that we were taught a constraint-based approach, and I think it would be helpful in considering our future growth prospects.
mclaren: I have remarked on this aspect at least once.
Steven, regarding the “Law of the Minimum”, also refer to the principal of maximum entropy as it relates to systemic exergetic log limit bound.
The US effectively reached this low-to-high-entropy exergetic limit bound (capacity for work) in the 1970s, and the rest of the world is where the US was in the mid- to late 1970s with respect to crude oil extraction per capita.
The US reached the exergetic limit bound of industrialization per capita at the given supply of the primary domestic energy source in 1970-85, whereas the rest of the world is now at the same limit bound 27-42 years later.
The overwhelming majority of economists never saw the phenomenon coming in the 1960s-70s; they don’t know it happened and its effects since; and they don’t see it happening worldwide today; therefore, we can’t rely upon economists to inform us, accurately analyze the causes and effects, nor propose viable prescriptions.
The solution for US Peak Oil was to increase debt/GDP and debt/wages, offshore production, automate and liquidate goods-producing labor, increase gov’t spending/GDP, debase the purchasing power of the currency in terms of labor product after taxes, and import crude and cheap goods from abroad.
This is a similar solution most empires of the past resorted to in order to expand imperial reach in search of resources and tribute, and to build and maintain a military force to secure it all. We Americans are discouraged from perceiving the US as an empire, but the evidence is inescapable that we are the successor to British Empire, and we are unlikely to escape the same fate as our predecessors.
Now the global resource and debt limit bounds have been reached for the Anglo-American imperial enterprise. Higher energy prices no longer result in increasing extraction per capita of crude or substitutes worldwide that we can afford to burn AND grow real GDP per capita.
We are passed the global net energy peak per capita and thus the end of growth of global real GDP per capita. We are consuming less gasoline and importing less crude because we are poorer in terms of income and purchasing power for the bottom 90% of households.
Central banks printing trillions in reserves to bail banks’ balance sheets, gov’ts running deficits of 6% of GDP, and drilling and excavating costlier, lower-quality deep, tight, and tar oil at $100+ will not slow or prevent the net energy and real GDP per capita decline. In fact, these actions are occurring BECAUSE of $100+ oil and its effects.
The scale of maintenance and replacement costs of the existing US fossil fuel infrastructure to domestic oil reserves and extraction and to GDP, including the US imperial military, does not permit fast enough growth of global real GDP per capita to allow for profitable incremental expansion of “alternative energy” substitutes at anywhere near the necessary scale (or exergetic efficiency) to compensate for the global net energy decline per capita from fossil fuels.
Economists are at least 40-45 years behind the exergetic log curve.
Dr. Chinn & readers –
Thanks for the link and continuing discussion. To explain my footnote, the text you quoted was correct. Keep in mind that my brief is entirely concerned with the mid- to long-range forecast, so the “middle of the coming decade” are germane to my discussion.
There are a few more details about this scattered in CBO’s report. On Page 41, CBO dings debt level:
And page 44 it mentions deficit level:
I’m not certain that CBO is using a fully articulated theory of debt drag here, but I gave them the benefit of the doubt, and referred readers to Kumar & Woo.
On my conclusion that policy is important for the shape & duration of the recovery, the point is not that financial crises haven’t been severe before, but that policy plays a role. In R&R’s Figure 1, the difference between the blue & red lines is almost entirely the Great Depression. While we might disagree on what policies were the worst, economists from every school argue that bad policy was a key aspect of the Great Depression.
Likewise, forecasters in early 2009 were certainly aware that the crisis was systemic (after all, TARP was signed in October 2008). CBO quite explicitly said in 2009 “Normally, sharp contractions in economic activity are followed by rapid rebounds, but this forecast anticipates that the recovery in 2010 will be slow for a number of reasons.” In addition, they thought the policies in place by then, as well as the pending stimulus package, would help the recovery. Yet even their “slow” recovery was far more sanguine than reality.
To Steven K…
You bring up constraints…
Brief reply… Constraints are not so prevalent in macro-economics as in micro-economics. I study a macro-economic model with a broad constraint.
UT^2 = u – cu + ls
UT^2 = total available factor capacity to the economy for labor and capital (non-negative contraint in the equation)
u = unemployment rate
cu = capacity utilization
ls = effective constraint on capacity utilization as a function of labor share of income.
This equation has a zero lower bound, since UT^2 is non-negative. Once the equation gets close to zero, it is seen that unemployment stops falling and capacity utilization stops rising.
The dynamics of this are not modeled yet. Yet, these factors of labor and capital utilization are more comprehensive than one might imagine, if they are used right.
Rising oil prices would affect the UT equation first through capacity utilization. Then there are secondary effects to labor income and unemployment. Real GDP would be affected and even constrained through the following related equation.
real GDP = capital income/(1 + u – UT^2 – cu)
As far as the UT equation is concerned, the question is whether rising oil prices will lower or increase the value of UT and by what multiplier.
Menzie,
R&R in the Vox article are defending their work against claims that the stylized facts they have uncovered do not hold for U.S. financial crises. I’m willing to accept that the aftermath of systemic financial crises have been worse, even in the U.S. (though not for post-war recoveries as Lazear has pointed out). I was raising a different issue, which is, “Why is that true?”
I think Salim is exactly on target in pointing to the role of policy in helping to produce and prolong a financial crisis. When comparing financial crises it’s important to compare similarities and differences, especially in the policy dimension. Unfortunately, extreme events tend to beget bad policies.
Salim brings up the Great Depression, an ideal example really. In this case we had a unit banking system that prevented diversification of shocks to the banking system; we had the Smoot Hawley tariff; we had gigantic increases in tax rates; we had a very large contractionary monetary shock; we had increasing regulation and hostility to business; and we had additional policy mistakes that cut off the recovery with a another downturn in 1937-38. Of course these policies had a lot to do with the length and depth of the depression. Other than the increased regulation and hostility to business, we didn’t have any of these damaging policies in the current recovery.
When you look at financial crises you often see big policy mistakes that amplify the crisis. I mention Sweden again as an example. A severely contractionary monetary shock is really a terrible idea in the midst of banking crisis, but that’s what happened in that case.
So, with an eye to R&R’s results, the natural question to ask, given the sluggishness of the U.S. recovery is: “What were the policy errors of the Administration that helped to bring about this state of affairs?” I think many forecasters believed wrongly that the Administration’s policies would be helpful. When that turned out to be wrong, they didn’t ask what was wrong with the policies. Instead, they have tended to invoke R&R to suggest that somehow the long and protracted recovery from the 2008 recession is inevitable. That’s hiding behind R&R.
I’ve already suggested what I think the likely candidates for poor policy are. R&R point out that the US economy has performed relatively better, both in comparison to other economies afflicted by the financial crisis and to historical financial crises. I think the reason for that is that recent US policy has been the best of the worst and not nearly as bad as what we’ve seen historically. But policy could have been better and economic performance could have been better.
By the way, I don’t think Shularick and Taylor are irrelevant at all. They’ve established the association of credit with the run up to financial crises. But that’s tangential to the point I’m raising.
Menzie
Japan is getting some attention recently regarding the value of the yen. Any insights you can provide in a new post are appreciated.
Salim Furth: Thank you for your comments. Regarding the approach to estimating potential, the CBO notes in a report released contemporaneously with the Budget and Economic Outlook:
Hence the medium to long term growth rate — and impact from government debt — arises in a production function approach, where cumulative deviations of investment from baseline result in a smaller capital stock and hence lower output.
It is true that CBO understood the implications of R&R (that’s my inference — I do not have personal information from that point in time), but it is unclear how fully they incorporated the quantitative magnitudes implied by the R&R results into their projections.
In terms of whether policy has a role in the current slow recovery, I agree that indeed there has been a role, but I would disagree almost entirely with where you would have placed it; I would say deficient government intervention is key. And since the deviation of current recovery from average of three (excluding 1930s and current), it would seem that most of the lackluster recovery can be attributable to the after-effects of the balance sheet crisis.
Rick Stryker: You write:
But as Reinhart has noted, the reason why sovereign debt often rises precipitously is because contingent liabilities get taken on by the government. Hence, Schularick-Taylor results are incredibly relevant to the question at hand. And US performance 2009 onward, compared to a larger number of episodes, is quite impressive.
By the way, as I noted after the ARRA had been in place for over a year, business economists believed stimulus had improved output relative to counterfactual. So you can join Kevin “dow 36000” in believing what you believe, and the rest of us will hew to mainstream macro.
Menzie,
If I’m interpreting your argument correctly, I think you are saying that Shularick and Taylor have established a robust relationship between credit expansion and the magnitude of the financial crisis. Moreover, Reinhart has pointed out that sovereign debt rises because the government takes on the liabilities of the private sector. That implies that the sovereign debt crisis that is often associated with banking crises is a result rather than a cause of the problem. Moreover, as Reinhart has pointed out, since the market knows that the government will take on the liabilities in a crisis, there is a moral hazard problem that exacerbates the expansion of credit.
I think there is something to this. However, I’d just remind you that John Taylor has shown a relationship between the magnitude of the effects of the crisis and the central bank’s deviation from the Taylor rule, implying that the run up in the expansion of credit was caused by too loose monetary policy. And Rajan and others have emphasized the role of government policy in the expansion of credit. That leads us right back to the bad policy question. I wonder how much of what Shularick and Taylor document is a result of bad government policy that helped to produce each crisis. And how much is attributable to bad policy in reaction to the crisis the government helped to create in the first place.
In their discussion of the UK, which performs worse than their regressions would suggest, Shularick and Taylor suggest a role for government policy too. My own view, just to repeat, is that government policy is generally awful during financial crises. US policy was less awful than normal–probably rising only to the level of bad. And so the US did comparatively better. See, I believe in giving credit where credit is due.
Let me see if I understand the logic of your second point. Since business forecasters believed the stimulus was effective, it was effective. Four out of five forecasters surveyed agreed the stimulus was effective, so it is. I’m not an economist, but I play one on tv and I’m here to tell you the stimulus worked. And so it did. Hasset was wrong about the Dow, so he must also be wrong about the stimulus. And since I agree with Hasset about the stimulus, I must also have believed the Dow was going to 36,000.
Well, since you want to commit the fallacy of the argument from authority (the fallacy of anti-authority in Hasset’s case) let me fight fire with fire. Around the same time the business forecasters were pronouncing that the stimulus worked, this notable economist, ranked number 2 in citations according to this
http://ideas.repec.org/top/top.person.nbcites.html
had this to say about the stimulus here, in his usual barrotone voice:
http://online.wsj.com/article/SB10001424052748704751304575079260144504040.html
“The fiscal stimulus package of 2009 was a mistake. It follows that an additional stimulus package in 2010 would be another mistake.”
He’s right. 2 X 0 is at best 0 in fiscal arithmetic.
Rick Stryker: I know that Prof. Taylor believes excessively-easy Fed monetary policy (deviating from Taylor’s Taylor rule) caused the crisis. I’m somewhat sympathetic, but don’t think it’s the major one (after all, the UK had a bigger crisis, and yet I can’t see the over easy policy — see slide 3. Prof. Rajan’s thesis is more persuasive. But I thought we were talking about poicy after the crisis. One can’t go backwards in time (yet).
I was hoping that after an entire survey of research on multipliers, you’d be softened up for some evidence from “real world practioners”. Oh, well.
MC: Terrific post. Thanks for summarizing Reinhart and Rogoff’s most recent writing on the subject.
I don’t get the bias to forecast faster rates of growth either. North Americans get really unhappy when their economies stagnate. Flat per capita real GDP appears to catalyze collective malaise. I don’t pretend to understand except I suspect the best explanation is socio-biological in nature. This obsession with growth is hardly rational in the collective sense. Look around the world; some of the most successful societies are small, low-growth countries.
I agree that most forecasters and the financial community missed the negative impact of the EU fiscal crisis on global growth including the US economy. I would add that North American pundits seem to have trouble understanding Europe. Over time, I suspect that wearing the imperial boot heels blinds many Americans to current realities outside the USA.