The revisions in Euro zone and UK GDP figures have confirmed the lackluster performance in economies where rapid fiscal consolidation has been implemented. In the Euro zone, estimated growth has now been negative for five quarters. And in the UK, revised figures indicate negative growth for 2012Q4. In contrast, the US has exhibited continued, albeit modest, growth.
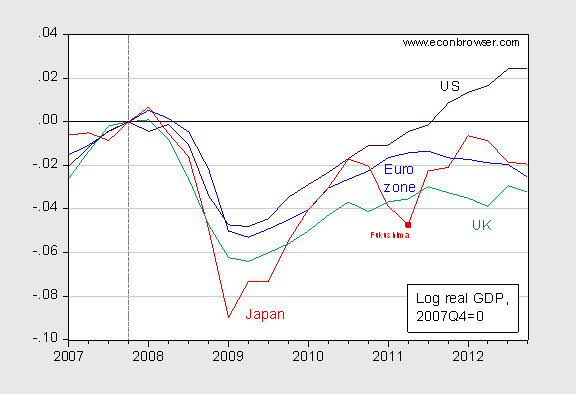
Figure 1: Log real GDP for US (black), Euro zone 17 (blue), Japan (red), and UK (green), all normalized to 2007Q4=0. Source: BEA, ECB, OECD via FRED, and author’s calculations.
Together, these economies account for 50% of 2013 estimated world output, evaluated at current exchange rates. What is the common factor in the three contracting economies, in contrast to the United States? While many factors are not controlled for (including for instance the earthquake and tsunami in Japan), one interesting commonality is the pace of fiscal consolidation. Figures 2 and 3 show the change in the structural budget balance to potential GDP ratio for the three countries, and for selected economies in the Euro zone, respectively. (The structural, or cyclically adjusted budget balance abstracts from cyclical factors such as the endogenous component of tax revenues and transfers.)
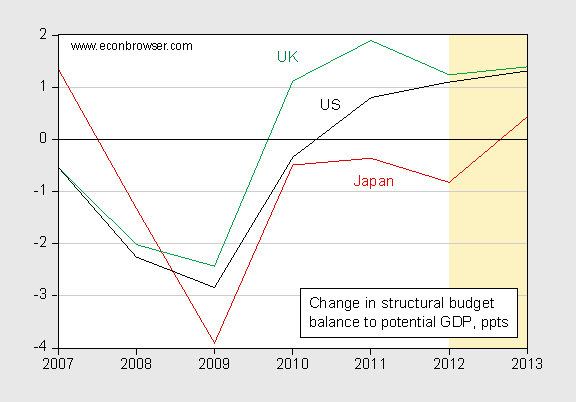
Figure 2: Change in structural budget balance to potential GDP, in percentage points, for US (black), Japan (red), and UK (green). Forecasts shaded tan, US and Japanese 2011 values also forecasts. Source: IMF, World Economic Outlook October 2012 database.
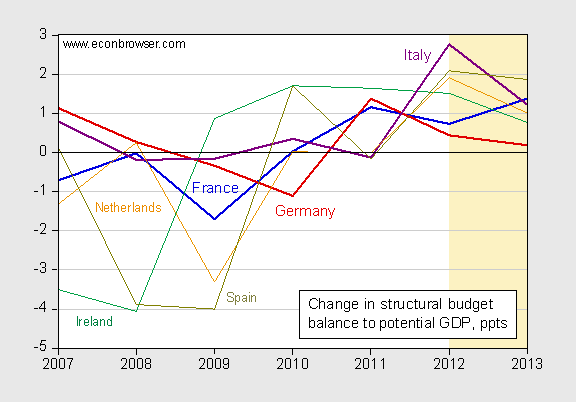
Figure 3: Change in structural budget balance to potential GDP, in percentage points, for US (black), Japan (red), and UK (green). Forecasts shaded tan. Source: IMF, World Economic Outlook October 2012 database.
The UK and the Eurozone countries by and large started fiscal consolidation earlier than the US. (Japan stands out, but the earthquake/tsunami and associated problems in the energy generation/distribution sector constitutes one of those factors that needs to be taken into account. Note also that the WEO forecasts predate the election of the new government.)
This message is a variant of that conveyed by a scatterplot Paul Krugman posted nearly a year ago, showing the correlation between growth in government purchases and GDP growth (it’s positive), but here by use of structural budget balances. (And here’s a euro zone specific graph from Krugman, using the IMF’s measure of fiscal consolidation.)
The point is not that fiscal consolidation is unnecessary. Over the longer term, one wants to bring revenues in line with spending (if only we’d done that in 2005!). But when output is around 6% below potential GDP, one wants to go very slow on cutting spending, especially spending that takes place now, as opposed to in the future.
So, the search for expansionary fiscal contraction continues. [1] [2] [3]
Update, 11:40am Pacific, 3/8: Reader Britmouse castigates me for considering both level and change in structural budget balances, but only presenting the plots of the changes. Well, I had hoped to avoid graphical overload, but apparently merely showing changes, and assuming people understand the general fiscal stances involved, taxes the analytical capabilities (or abilities to handle a spreadsheet from the IMF using the link provided — that’s a new one!) of some readers, so for completeness’ sake here goes.
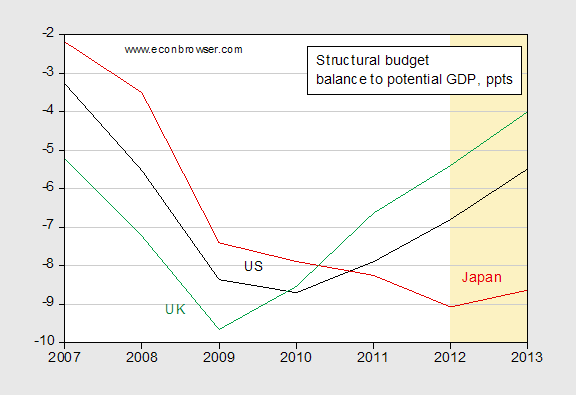
Figure 4: Structural budget balance to potential GDP, in percentage points, for US (black), Japan (red), and UK (green). Forecasts shaded tan, US and Japanese 2011 values also forecasts. Source: IMF, World Economic Outlook October 2012 database.
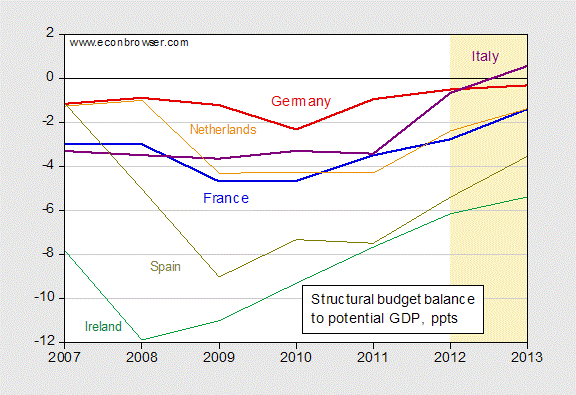
Figure 5: Structural budget balance to potential GDP, in percentage points, for US (black), Japan (red), and UK (green). Forecasts shaded tan. Source: IMF, World Economic Outlook October 2012 database.
I hope readers will closely inspect these graphs.
The US been running contractionary fiscal policy since 2011 on your chosen measure of the fiscal stance… and had consistently positive real GDP growth.
Doesn’t that end your search for “expansionary fiscal contraction”?
Your definition of fiscal contraction seems to be “still running large deficits, but slightly smaller than last year.”
By that definition, the fiscal cliff tax hike, the payroll tax reinstatement, and now the sequester are together a big fiscal contraction. Yet GDP is reportedly expanding.
Found it for you!
Come to think of it, we had an epic expansionary fiscal contraction after WWII.
And Canada had a big one in the 90’s.
W.C. Varones: The point is not that growth can’t occur when policy is contracting. Rather, had we undertaken less contractionary policy in the US, then growth would be faster. That obvious point seems to be lost upon those insisting upon cutting spending now (actually, I think they might understand the point, but are masking their true intent to shrink the size of government faster than it already is in the guise of fiscal responsibility).
Britmouse: Since the structural budget balance is still negative for the US, stimulus is positive, but is shrinking over time.
On the use of the structural fiscal deficits and public debts growth.
Zeno’s Paradox of the Tortoise and Achilles
The Tortoise challenged Achilles to a race, claiming that he would win as long as Achilles gave him a small head start. Achilles laughed at this, for of course he was a mighty warrior and swift of foot, whereas the Tortoise was heavy and slow.
“How big a head start do you need?” he asked the Tortoise with a smile.
“Ten meters,” the latter replied.
Achilles laughed louder than ever. “You will surely lose, my friend, in that case,” he told the Tortoise, “but let us race, if you wish it.”
“On the contrary,” said the Tortoise, “I will win, and I can prove it to you by a simple argument.”
“Go on then,” Achilles replied, with less confidence than he felt before. He knew he was the superior athlete, but he also knew the Tortoise had the sharper wits, and he had lost many a bewildering argument with him before this.
“Suppose,” began the Tortoise, “that you give me a 10-meter head start. Would you say that you could cover that 10 meters between us very quickly?”
The whole paradox to be read
If the level of the structural balance is what matters, not the annual change thereof, why don’t you show that in your graph?
The UK is also running large negative structural balance. So you agree that UK fiscal policy is also expansionary?
“Rather, had we undertaken less contractionary policy in the US, then growth would be faster”
Then this is no process of discovery at all. You have simply assumed your conclusion is true.
UK fiscal policy is “contractionary” because real GDP is falling.
US fiscal policy is “expansionary” because real GDP is rising.
Both countries are running a negative structural balance. Both countries have *contracted* the size of the negative structural balance.
So the “no expansionary fiscal contraction” line is unfalsifiable just like the Keynesian defense of failed deficit spending. Any observed counter-example would have had greater growth if only fiscal policy were even looser.
“Sure the economy is still a disaster after years of big deficits and monetization, but it’s only because we didn’t spend, borrow, and print enough.”
Faith-based economics.
Measures of GDP to not measure production but consumption. If resources are taken away from the producers and used by the government, the primary consumer, GDP does no recognize the difference until the loss of production manifests itself in shortages at a later time through reduced machinery purchases, reductions in labor and maintenance, and the over consumption of finished goods. Often this isnot manifest until months, sometimes years after the confiscation.
But the stock market better reflects the difference. The market is forward looking and so it is sensitive to actions that will increase production.
There were “apocalyptic” claims (to quote our president) about the effects of sequestration. Currently the only real ones to suffer from sequestration are 6th graders from Waverly, Iowa who have been denied a White House tour so the president could wine and dine congressmen and hikers in our national parks who must return to using the cover of trees to do their business.
Don’t be fooled by the GDP. It is a Keynesian measurement that at best is seen only in the rear view mirror. New highs in the stock market reflect the sentiment of traders who are believing sequestration demonstrates a shift of resources from government consumption to private sector production. Sequestration is a drop in the bucket, at best, but to traders starving for returns hope springs eternal.
Still in search of a non-party line position held by Professor Chinn…
If Ricardo is right about the stock market, it also shows the market doesn’t give a damn about tax increases on the rich and on captial gains.
“But when output is around 6% below potential GDP”…
I’m sorry to inform you, but our potential GDP has likely gapped-down meaningfully post the bust. So, the 6% number is nonsense.
In fact, the near-term stimulus measures you advocate to reduce the output gap will in-themselves (given our penchant for misallocations) LOWER potential long-term output, as compared to baseline.
Hey, the output GAP does narrow in this scenario!
ppcm – I doubt Achilles could look up the epsilon-delta definition of a limit, but you sure can. Zeno’s paradox has been irrelevant for a long time.
Britmouse: Since you are apparently unable to download the data for yourself, I have plotted the level of the UK structural budget balance to potential GDP series. You will see that the level of the deficit is smaller than that of the US, despite arguably having a larger negative aggregate demand shock striking that economy. I have not generated a GDP-weighted structural balance for the euro zone, but I am confident you would find a similar pattern. In both those cases, GDP has followed the pattern shown in Figure 1.
W.C. Varones: By the way, I’m still in search of hyperinflation…
Anthony Juan Bautista: I’m using a log difference on CBO numbers and the latest GDP release. I would be curious to see your estimates of potential GDP, and the model you use (Heritage CDA perhaps — where are you Bill Beach?)
Prof Chinn:
Regardless of the model I employed, there would most certainly be room for downward revision! Revisions like the below, for example (from the CBO):
https://dl.dropbox.com/u/21394723/AJB/clev%20fed%20pot%20GDP%20revision.png
Considering this, it’s not unreasonable to assume we are merely waiting for the next downward revision.
And I don’t know who Bill Beach is. Should I? If you’re going to poke-fun, at least give me a chance to be offended! ; )
But I do know a scientifically imprecise and politically laden forecast/metric when I see one….
And you know what they say about economic forecasts?
Menzie, to what extent are the balances affected by the difference in social spending stabilizers? As I remember, there has been a real difference in that between the Eurozone and the US. But I’m working in my head off the UK experience in which public investment spending is way down but maintenance spending is up.
Anthony Juan Bautista: Almost all my posts on Heritage involve a plea for Bill Beach to show up — an in joke. Only an poke at you if you rely upon Heritage Foundation’s CDA analyses.
Ha, ok! Well we’re in safe waters; because following this epic global econ train-wreck, I no longer rely on ANY forward econ analysis: political left, right, or in-between.
I enjoy reading the disparate econ postmortems of the crash. But the moment a prediction (modeled or narrative) is made I think to myself: if your model didn’t “know” in 2007, why should I believe it “knows” in 2013?
Hence my skepticism on CBO “knowing” (with any useful precision) the pot. GDP in 2013, when they were off by a ginormous country mile in 2007!
As Feynman said: “Science is a culture of doubt.” This statement has never been more important than today.
Why are you comparing the UK and Japan with the US? Both of these countries have enormouse crippling debt that people like you only hope to have us someday achieve.
http://www.statista.com/statistics/206050/total-debt-as-a-percentage-of-gdp-in-selected-countries/
Bautista has grasped the essence of what economics has to offer – a powerful tool for historical analysis – useless for forecasting unless hedged with lots of ceteris paribus.
Generally used of course in the useless way. Dazzle them with numbers…
Bautista has grasped the essence of what economics has to offer – a powerful tool for historical analysis – useless for forecasting unless hedged with lots of ceteris paribus.
Generally used of course in the useless way. Dazzle them with numbers…
hard to credit some who one hand say the US is a sign of ow well austerity works, and then also say the economy stinks.
Quick apology: I misread the post and missed that it’s about structural balances so my question about stabilizers was a non-sequitur. Sorry.
jonathan: No apologies necessary for questions pertaining to actual workings of the economy, and/or the topic at hand. In contrast, people who repeat mindless data-free assertions (thinking themselves very clever) over and over again, are merely clogging the internets (!).
As it happens, to the extent that the prevalence of automatic stabilizers vary across countries, the difference between actual and the cyclically adjusted series will vary. By the way, CBO has just published new estimates of the cyclically adjusted balance.
I’m familiar with the data, thanks. (I think the “structural balance” data is complete junk, because the “potential output” data is complete junk, but I’m happy to ignore that for the purposes of this debate. Compare the IMF’s UK output gap estimates for the period 2000-2007 in the 2009 WEO with the 2012 WEO data for your own amusement.)
I am still completely confused about what your “search” is. Specifically, what combination of data outturns would satisfy your search?
Your post clearly implies a falling structural balance is “contractionary” policy. Yet you also claim that a falling, but still negative, structural balance, is still “expansionary”? How will you identify “contractionary fiscal expansion” if you did see it?
“The point is not that growth can’t occur when policy is contracting. Rather, had we undertaken less contractionary policy in the US, then growth would be faster. That obvious point seems to be lost upon those insisting upon cutting spending now.”
You can’t assert a counter-factual. The money that wasn’t spent by the govt was spent somewhere. It wasn’t stuffed under a mattress.
@ Anonymous:
“You can’t assert a counter-factual. The money that wasn’t spent by the govt was spent somewhere. It wasn’t stuffed under a mattress.”
???? are you saying that if the government isn’t spending money then that “unspent” money automatically must be spent by the private sector?? How about the possibility that it never gets spent?
This isn’t a zero sum game, it is a collective pie that can grow, shrink or stay constant. When we’re in a recession the “pie” is shrinking.
Only if the government decides to grow its segment of the pie, during a growing period, is there a risk of crowding out. And the reason for this is that the economy is maxed out, all capital is fully used and all workers fully busy and all factories running at full capacity. That is NOT the case today.
There is some uncertainty in my mind of exactly how much under capacity we are (6% has been suggested earlier in this blog), but there is no doubt in my mind that we are under capacity: high unemployment, banks not lending, factories underutilized – that’s the essence of the Great Recession
“???? are you saying that if the government isn’t spending money then that “unspent” money automatically must be spent by the private sector?? How about the possibility that it never gets spent?”
If it “never gets spent” what happens to it?
How accurate are the potential GDP numbers ( or the differences between GDP and potential GDP ) being cited for these prolonged and deep recessions ? We are talking about economies with combinations of large private sectors and government welfare systems. The overall economic contraction is marked by businesses that have to lay people off or shut down due to declining profits. Is it possible that the potential GDP numbers being cited consist of overestimations because of, say, huge over-investment in particular sectors ( investment that wrongly anticipated demand levels by very large amounts ). This is one example where the potential GDP concept becomes murky. Have the corrections due to the capital associated with this over-investment been taken into account while calculating potential GDPs ? In other words, capital associated with unprofitable businesses can become a large percentage of total capital during deep and prolonged recessions. This needs to be taken into account while calculating potential GDPs in quasi-capitalist economies. Since it is not easy to make unprofitable businesses profitable instantly in quasi-capitalist economies, the GDP at any time during a deep and prolonged recession is probably very close to the possible GDP at that time. Growth of GDP and potential GDP then becomes strongly dependent on the creation of new capital that is associated with profitable and sustainable businesses. Capital associated with unprofitable businesses has to be modified or augmented or allowed to perish. Or the nominal value of capital associated with unprofitable businesses has to be allowed to decrease significantly till it is priced correctly according to the pricing mechanisms available in quasi-capitalist economies. Large-scale market failures of the type we saw recently in the US and in Europe in the real estate sector can indicate a need for drastic decrease in the nominal value of existing capital in particular sectors. That this revaluation takes very long and that the market takes many years to reach the right price levels and the right modification of capital or augmentation of capital or perishing of capital in that sector means that it may be difficult to calculate what the actual potential GDP is in nominal terms. In real terms, capital that is lying idle for a long time with no prospect of speedy re-use needs to be excluded from useful measures of potential GDP. Capital that has been lying idle for a long time and needs costly modification before re-use needs to have the right value attached to it for potential GDP calculations. This may mean that for certain deep and long recessions, GDP may not be that far from actual potential GDP where the effect of idle capital has not been overestimated.