Chinn-Ito Index Updated to 2011
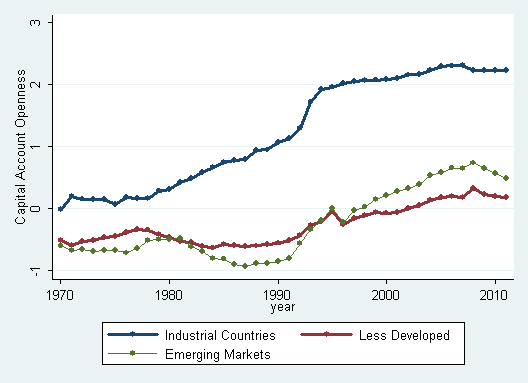
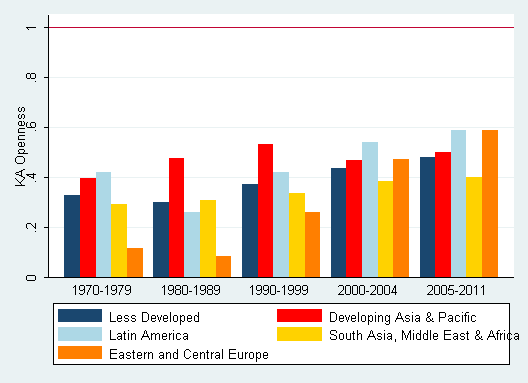
Our de jure index, based upon the IMF’s tabulation of external account restrictions, has been updated to 2011. We find (1) retrenchment in emerging markets, (2) and regionally, little change on average in East Asia/Pacific and South Asia/Middle East and Africa.

Figure 1: Mean KAOPEN by group. Source: Chinn and Ito
A short description of the KAOPEN index construction is here. The trends detected in last year’s update persist into this year. [1]

Figure 2: Mean KAOPEN by region. Source: Chinn and Ito
A comparison of the Chinn-Ito index against other measures of financial openness is here.
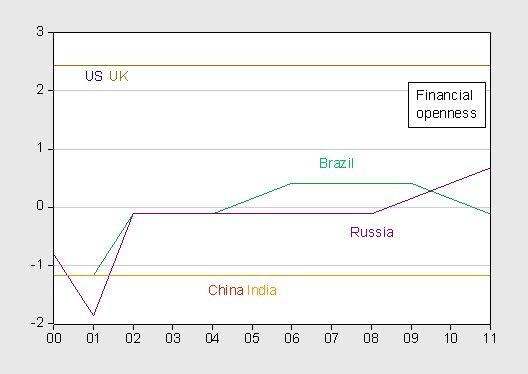
It’s interesting to consider how capital controls have evolved in the BRICs – Brazil, Russia, India and China.

Figure 3: KAOPEN series for US, UK (blue, chartreuse), China, India (red, orange), Brazil (green), and Russia (purple).
As I noted in this study, if these countries hope to have their currencies achieve status of an international currency, there is a long ways to go if currency convertibility is a prerequisite.