With unemployment at 7.6% and an output gap of around 6%, it’s (still) not the time to embark on front-loaded spending cuts in the United States.
Figure 1: Log GDP (blue), CBO baseline projection under current law (red), and potential GDP (gray bold). NBER defined recession dates shaded gray. Source: BEA, 2012Q4 3rd release, CBO, Budget and Economic Outlook, February 5, 2012, and NBER.
The Reinhart and Rogoff findings’ impact on policy
Annie Lowrey in Economix muses on the exact impact on policy of the original Reinhart and Rogoff debt/growth results. She concludes that while in the constrained economies of the eurozone (the GIIPS), it’s unclear whether there would have been an impact, it’s a potentially different matter in countries not facing imminent constraints:
A better question is what effect studies like Reinhart-Rogoff might have had in countries that elected to start the process of fiscal consolidation without much pressure from the bond markets or other external financiers.
Britain and the United States are the big question marks there. The Cameron government in Britain — over the protestations of the opposition party and the monetary fund and other groups — has slashed the country’s budget. But it still has not met its own deficit-reduction targets, because the economy has remained mired in recession and automatic spending on social programs has increased. The country still could reverse course and engage in an effort to improve growth rather than an effort to hold down its debts. But thus far it has chosen not to.
The United States has also embarked on a campaign of deficit reduction, though a more modest one. Thus far, the Obama administration and Congress have raised taxes on the wealthiest Americans and agreed to trillions in budget cuts. With the aggressive actions taken by the Federal Reserve, the economy has continued to grow — which will greatly aid the country’s fiscal situation in the long run. How important were academics like Professors Reinhart and Rogoff to that process? My sense is not very, as well, even if policy makers pushing for deficit reduction cited them.
The policy debate, and economic vs. statistical significance
Reinhart and Rogoff have responded to the publication of the Herndon-Ash-Pollin results by noting that the finding of 1% reduction in trend growth above the 90% threshold remains intact (this is the distinction between using median vs. mean differences); moreover, over time, 1% cumulatively becomes important in assessing the impact on the level of GDP. On this last point, I definitely agree.
However, here we reach the issue of economic versus statistical significance. Jamus Lim at the World Bank’s “Prospects for Development” blog notes:
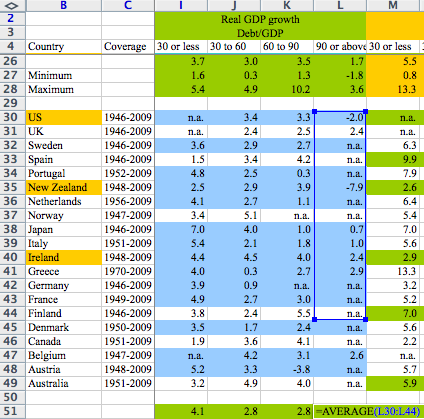
…at least at the fairly standard threshold of 95 percent confidence, there is reason to believe that any such differences may be yet another chimera. While access to Reinhart and Rogoff’s original data is elusive—making it impossible to definitively verify the veracity of this claim—the widely-circulated Excel snapshot provides us with some data to work with (with the added plus that standard errors of the mean calculated using this approach also use the average-of-averages weighting scheme they employ in their paper). And attempting to replicate the key figure shows that, while the means for the observations in the greater-than-90-percent bin are it is certainly lower than the other bins (see figure), the confidence intervals of all three bins above the 30 percent debt/GDP threshold also overlap. On this (admittedly crude) basis, then, any claim that a 1 percent growth differential over a decade compounds is simply overstating the case made by the data.
The key graph is here:
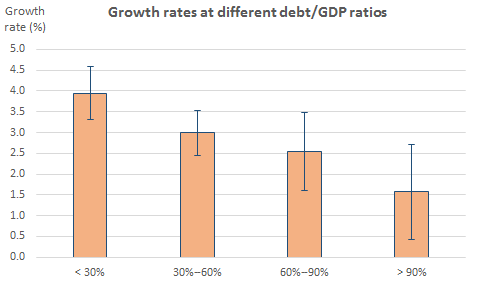
Source: J. Lim, “How Significant is a 1 Percent Difference in Growth Under Debt?” “Prospects for Development” (18 April 2013). Notes: Source: “World Bank staff calculations, from Reinhart-Rogoff data fragment. Note: Means for each bin are simple averages of all by-country observations within each respective bin, weighted equally by country. Observations for the >90% bin include updated data for New Zealand for all years, averaging 2.58%. 95 percent confidence intervals computed from standard errors for available observations within each mean.”
The question I have is whether one should use the conventional 5% significance levels to make judgments, when dealing with policy issues. (A similar question arose in comments surrounding my work with Yin-Wong Cheung and Eiji Fujii on RMB undervaluation). I don’t think there is a definitive answer — but the fact that the 1% differential is not statistically significant at conventional levels should give pause for thought.
Hope for an impact on policy
So, while we know anecdotes and metaphors carry a lot of weight (perhaps too much) with politicians and policymakers, I do think that these new results should temper the fervor of politicians such as Representative Paul Ryan to brandish the Reinhart and Rogoff results like a cudgel [1] to rapidly implement front-loaded cuts to discretionary spending (and cut taxes so that even more spending cuts will be necessary to balance the budget in ten years). (At this point it’s important to note that in R&R’s academic writings, the causal interpretation was not pushed; and for sure, spending cuts as the sole adjustment mechanism to reducing the pace of debt accumulation was never implied by the R&R results).
For a survey of theoretical and econometric issues pertaining to the interpretation of the Reinhart and Rogoff debt/growth correlation, see this survey by Ugo Panizza and Andrea Presbitero.
Does it really make sense to look at government debt without looking at private sector debt at the same time?
Couple things…
There is an interview with the authors from the PERI institute…
http://www.youtube.com/watch?v=YRdJod4wjSE
Potential real GDP may have returned to its long-run path since the bubble popped. http://effectivedemand.typepad.com/ed/2013/04/back-to-reality-potential-real-gdp.html
If this be the case, will attempts to raise real GDP lead unknowingly to an environment for creating more bubbles?
The re-balancing of the US economy may not be an issue of stimulating real GDP growth or austerity, but of redistributing income. The implication is that neither austerity nor debt spending may work unless there is re-distribution of income.
Adair Turner said in an interview recently that emerging countries should expect to get to the $20,000 real GDP per capita level and then stop there, because they won’t really be able to go to a higher level of consumption.
http://www.youtube.com/watch?v=AFv9_g4vzAM
Yet, he doesn’t realize that countries could keep growing if they increased labor share of income as they grew, thus strengthening internal demand along the way. Public debt affects real GDP growth, but labor share of income also has its threshold to limit real GDP growth. And who is talking about labor share?
What significance does debt have on economic growth? Seems like a “bar” fight has begun between Herndon, Ash and Pollin vs. Reinhardt and Rogoff. If I understand the articles referenced in a WSJ blog linked below, Herndon et al are saying that R&R are wrong in their analysis of the impact of debt upon GDP growth.
http://blogs.wsj.com/economics/2013/04/16/reinhart-rogoff-response-to-critique/?mod=djemRTE_h
No Time for Tax Increases: US Edition
With unemployment at 7.6% and an output gap of around 6%, it’s (certainly) not the time to embark on front-loaded tax increases in the United States.
RE: Alberto Alesina, Christina Romer
“With unemployment at 7.6% and an output gap of around 6%, it’s (still) not the time to embark on front-loaded spending cuts in the United States.”
-Menzie Chin, May 1st, 2024
You don’t need to spend to run a deficit.
See references below:
Alberto Alesina
Christina Romer
Anonymous (7:06AM): Who is this “Chin” person you refer to?
And keep on citing nominal budget numbers (Anonymous 4/17, 11:07AM). That will impress friends and family of your economic prowess (in addition to spelling prowess). Thanks for another good laugh! All Econbrowser readers appreciate it.
Should public and National debts not to be repaid, all details and the superfluous may be the topic of expenditures. A healthy challenge of the data content and outcome of »This time is different » on growth in relation to debt.
Bloomberg
Reinhart-Rogoff Paper Cited by Ryan Faulted for ‘Serious Errors’
At the inquisition, let us add an inquisition, a normal process. .
One may wonder when comparing time series as old of few hundred years how reliable are the GDPs comparison.
Are the data homogeneous that means the GDP deflators the same. One may assume the investigation has used the same time series and restated the GDP deflators excluding or including food and energy.
Laspeyres has been given the preference to Paasche but both methods of prices calculation may drive to a different GDP deflator, Laspeyres underestimates inflation when Paasche overestimates inflation.
Since the contemplated GDP growth is in the domain of delta epsilon, the finesse of the methods of investigation should be commensurate.
It would be reductive to summarize the authors findings and conclusion to the relationship of growth to public debts only, the sovereign risks and the threshold of debts before defaults or recoveries may be worth to be challenged as well since as of today most of the Western countries are in the default zone and did not declare a debt moratorium.
In essence the content of the study of Reinhart Rogof appears to be challengeable, save the title »This time is different »
Personally, Menzie, what gives me a laugh is number of ways you can re-write the same post.
Step 1: Insert CBO multiplier table and/or graph of output gap
Step 2: Insert mostly off-topic filler
Step 3: More fiscal stimulus!
Hackneyed Hillarity!
Jeff: Glad to provide you with entertainment. But I must confess, I can’t see why the issue of debt-to-GDP impact on growth is not relevant to the output gap, and how to address it. Please elaborate. If you could provide a link to your research on the subject, I would be much obliged. Then we could compare the amusement derived from your pronouncements against mine!
AS I don’t believe Herndon, Ash and Pollin (HAP) are arguing that high levels of debt are always and everywhere likely to hurt economic growth. But rather, HAP are arguing that the much ballyhooed 90% critical threshold does not stand up to close scrutiny. There is nothing magical about the 90% number. Furthermore, HAP argue that the R-R analysis fails to distinguish whether high debt causes slower growth, or if slow growth economies just naturally tend to wander into high debt territory. Is high debt a cause or a consequence of slow growth?
From a policy perspective the HAP result is telling us that running debt when the economy is already in a slump is not necessarily a bad thing and we should not pay any particular attention to the 90% figure. But on the other hand, running high debts when the economy is at full employment will slow growth because it crowds out investment. The former case is an example of high debt being a consequence of slow growth. The latter case is an example of debt causing slow growth.
2Slugs
I appreciate a comment.
Menzie: Happy to elaborate. I’m not saying that the debt/GDP ratio is never relevant for a discussion on fiscal policy. I’m saying your specific post is nothing more than negative output gap tautologically equals more fiscal stimulus. I’m saying that your specific use of the R&R news is nothing more than filler to place in between your tautology. For example, did the R&R updates change your opinion on austerity? Did you think austerity was beneficial before and now you’ve updated your beliefs? Clearly the answer is no. Please don’t interpret my statements as a general claim that the debt/GDP is never relevant for an honest discussion on growth or fiscal policy.
Jeff: Well, I beg to differ. I believed additional stimulus was necessary before; now I believe it even more, and am downweighting the concern about nonlinear effects going from high debt ratios to growth. So, my views evolve over time in response to new information. What about you?
Look the postscript:
“Postscript: As a point of clarification, it should be noted that confidence intervals can overlap and still show a significant difference between means; see, in particular, this paper (PDF). Confidence interval bars can in fact overlap even at conventional significance levels (of, say, p = 0.05), although not substantially. ”
It seems that the 2 sides of the debate (austerity X no austerity) are making unjustifiable mistakes. That’s what happens when the conclusion comes before the analysis….
A: I’m not sure of your point. The postscript notes that when using the standard error bars, the differences are clearly not significant between the 60-90% bin and the 90%+ bin. Same for 30-60% and 60-90% bins. So, I’m not convinced the “no-nonlinear effect” side is making unjustifiable mistakes.
Menzie: Can you please point to something you have written in the last few years in which you have stated this supposed measured attitude towards additional stimulus?
Please someone help me. How much actual “stimulus” occurred for the private sector from the Fed crediting the banks with over $2 trillion in free reserves and the federal gov’t borrowing more than $5 trillion since ’08?
Granted, the nominal GDP would likely be 25-30% smaller, i.e., Great Depression, without the “stimulus”, but was the “stimulus” not more like a “life raft” for a sinking ship rather than “stimulus”.
Or one could say that the Fed reserve expansion liquidated a portion of the banks’ balance sheets to keep the banks’ doors open and lights on, but in the process the flood of Fed reserves only encouraged another overvalued equity market and echo real estate bubble in the previously bubbliest areas, e.g., SF Bay Area, SoCal, Phoenix, and parts of FL.
But adjusting for the explosion in bank cash assets (less vault cash and in excess of reserves held at Fed banks), money supply growth is trending at 2-3% (a la Japan from the late ’90s to date), which is the post-’07 trend rate of nominal GDP.
Moreover, the multiplier and velocity are still falling, and now the rate of acceleration of velocity is contracting yoy (deceleration).
Over $2 trillion in bank reserves and more than $5 trillion in deficit spending, and all we got was flat trend real GDP and negative real GDP per capita since ’07.
So, I guess that means another $2 trillion in free reserves and $5 trillion more in deficit spending over the next 4-5 years, yes? Or should we double up? Do I hear $4 trillion in additional reserves and $10 trillion more in deficit spending by ’18?
Sounds rather stimulating for equities and corporate bonds, but why are my hands shaking and my knees knocking? Feels like too much caffeine at 30,000 feet while relying on artificial oxygen.
Jeff: “Getting Serious about the Twin Deficits,” Special Council Report No. 10 (Council on Foreign Relations, Sept. 2005).
Dr. Chinn,
May I ask you to comment as to how those policies that you recommended in your CFR manuscript worked out or would have worked out, if you believe they have not been implemented?
And a followup, may a reasonable reader perceive a certain degree of inconsistency between your recommendations to the policy elites and your public stand here in your blog?
Thank you.
If I receive a research piece by an economist who starts by giving me his “forecast” of the GDP for the next year or two, or who writes that the government should spend more money to “avoid a decline” in the GDP, or even worse, tells me that if the government starts cutting, GDP will collapse and that it would be a disaster, I stop reading immediately. Not worth my time.
Charles Gave – GaveKal Report
89801783: I lay out what I think would have happened if the prescriptions in my CFR report had been implemented in Lost Decades.
You write:
The answer to your question is “no”. I don’t know why you would think so. You can see my recommendations in published articles; see here (where the Council on Foreign Relations Report is — I assume that constitutes a set of recommendations to “policy elites” as you put it).
An output gap is not measurable in real space like interest rates or population. Not to deny the appeal of the concept, but it is an artificial construct. It would be easy to write a defensible paper showing potential growth sloping less steeply upward, the true “output gap” thus (considerably) smaller than that shown on the graph. The core of the argument is years of malinvestment cumulatively built up from injudicious policy that did not let the necessary amount of Schumpeterian creative destruction take place. Finance and housing are notable sectors. Excessive private sector credit growth was a consequence of misguided policy from at least the time of the chairmanship of Alan Greenspan on. The depth of the 2008-9 crisis, and its wake here and in the euro zone, was the delayed inevitable result. Instead of letting the market purge excesses and shift resources to future growth sectors, policy genuflects to the output gap (a Holy Ghost) setting up more of the same.
Now a new player is upon the stage – the debt-to-GDP ratio. Reinhart Rogoff and others uncovered a large body of evidence that real growth is degraded to the tune of a percentage point when the debt ratio rises beyond 90%. It’s also degraded before that. As Menzie points out, this is no small thing. The 2.9% growth of the decades prior to the Great Recession is in jeopardy of being no more than 1.9% going forward, until the debt ratio (and malinvestment) is brought down. All the more so will future growth be “surprisingly” low, since some of the 2.9% baseline of recent decades was artificially induced by excessive credit, and was thus non-sustainable. That GDP growth is artificially high in the credit-driven period prior to a debt crisis is one reason for the Reinhart Rogoff findings. The bloated “trend growth” baseline accounts for some of the before and after-crisis differential.
The debt ratio’s surge to 90% in 2010, and now well beyond, had long roots. Those roots were misguided policy as far back as Nixon. There is no way a distributed lag of a few years or so explains what happened. The causal terrain is far richer than easily measured macro variables make it out to be, embedded in society and politics. And it goes quite a ways back. Vitally important, society’s time preference was warped away from the necessary 10% or so surplus a civilization must put aside annually to survive. Already ground down, the nation’s surplus went full negative this past 4 years. It will remain below optimal for years to come. Another reason why the Reinhart Rogoff finding holds! Without having looked at the data, I predict that the personal saving rate fell below trend ahead of virtually all debt crisis episodes Reinhart and Rogoff identified across time and country.
The lack of surplus goes by another name – debt-to-GDP. These are head and tail of the same coin. Until the wisdom of classical economists like Smith, Wicksell, recently von Mises and Schumpeter, and more recently Solow and Robert Gordon on savings, growth, and productivity is heeded, growth will continue to be inhibited. Keynes’s paradox of thrift, which over the years was finally purged from Samuelson’s Principles of Economics, is a core ideological root of today’s bad policy. Be that as it may, by all means let’s keep landfilling the output gap with evermore garbage (artificial stimulus). And take no heed of the flock of gulls circling overhead.
JBH You are confusing growth theory and macroeconomic stabilization. Just about every flavor of growth theory (Solow, Domar, Harrod, Ramsey-Cass-Koopermans, Diamond, whatever) is concerned about long run growth in the economy’s productive potential. So those models are concerned with the growth of technological knowledge, labor force, capital investment rates, etc. The government usually enters the picture in the form of deadweight losses from tax rates and correcting for externalities. But the key point is that those growth theory models are looking out over very long time horizons…long enough that growth theory economists argue about overlapping generations and infinite-horizons. That’s all well and good, but it doesn’t have much to do with macroeconomic stabilization policies.
Contrary to what you seem to be suggesting, classical economists such as Adam Smith worried about economic slumps due to demand not matching supply. The classical solution was to sweep the problem under the rug and genuflect to Say’s Law. And for purposes of historical accuracy, Wicksell, Schumpeter and von Mises were not “classical” economists. Wicksell was a neo-classical economists and influenced both Keynesians and Austrians. Schumpeter and (especially) von Mises were Austrians…which says just about all you need to know about how seriously one should take their views. Schumpeter was a colorful writer, but his economics was third rate.
Now to their credit, Austrians at least recognize that the economy can sometimes fall into recession and suffer involuntary unemployment. That’s an improvement over the Real Business Cycle crowd. But the Austrian prescription is all about the inevitable need (almost a psychological craving) for purgatives and self-flagellation. I can only guess that Austrian economists were not properly toilet trained as toddlers.
Keynesians aren’t into unnecessary pain. It’s just not our thing. Over the short-run modern economies experience macroeconomic fluctuations due to planned investment not matching actual investment. Too much planned saving relative to the demand for saving. Normally macroeconomic fluctuations are best handled by a central bank, but when the economy is at the zero lower bound, traditional monetary policies don’t have much traction. So it’s fiscal policy to the rescue. When Keynesians talk about economic growth, they are talking about transient corrections to either too much aggregate demand or too little aggregate demand. For the most part Keynesians don’t have a lot to say about long run growth, except to mention possible hysteresis effects due to prolonged unemployment. This failure to understand the difference between growth theory and Keynesian demand management is all-too-common…especially among conservatives and business types.
JBH:
No, it would not be possible to write a defensible paper saying that the output gap is considerably smaller than shown, any moreso than it would be possible to write a defensible paper saying that real growth is degraded to the tune of a percentage point when the debt ratio rises beyond 90%.
And as for “the necessary 10% or so surplus a civilization must put aside annually to survive”, you do realize that some civilization elsewhere would have to run a corresponding deficit, don’t you?
And one then wonders as well how the planet has managed to survive, with no interplanetary trade or capital flows to speak of as of yet…..
Menzie says: “I believed additional stimulus was necessary before; now I believe it even more”
So, you support additional stimulus via cuts in tax rates ….. since all the stimulus spending by Obama does not appear to have had much bang for the buck? And will you be posting on how you oppose Obama’s incessant calls for higher tax rates?
,
Anonymous: I don’t understand what you are getting at. Who says the stimulus by way of spending in the ARRA had little effect? In fact, see this survey for the New Palgrave Dictionary of Economics, as well as this post, for evidence to the contrary.
Nice dodge, Menzie. Again, are you against the tax hikes that Obama wants? Will you be posting articles/comments/links on how harmful austerity via tax hikes is for the economy?
Anonymous: Are you being intentionally dense? I haven’t “dodged” — I’ve repeatedly argued for tax hikes as opposed to cuts to discretionary spending, and in particular would want back-loaded spending cuts and tax increases — Heck, I’ve written a book arguing that. As far the impact, I’ve also linked to many times to CBO estimates of the tax multipliers (which on higher income households are relatively small). Where have you been?
Menzie, with regard to your topmost chart, do you have the data to overlay the CBO estimates for Feb. 2011 and Feb. 2012. It might be interesting to see if there is consistency in estimates given a continuation of stimulus… and if not consistent projections, why the differences in outcomes versus expectation.
It might help to either reinforce or question the expectations based on alignment with reality.
“I’ve repeatedly argued for tax hikes as opposed to cuts to discretionary spending….”
Well, it doesn’t look like you’re gonna get what you want. The american people will be much better off as a result too…….
How’s the slush fund there at UW?
2slugbaits Over the short-run modern economies experience macroeconomic fluctuations due to planned investment not matching actual investment. Too much planned saving relative to the demand for saving.
This statement is too general, too abstract, and at too macro a level to be useful to the readers of this blogsite. It is necessary to break the cycle into phases and sufficient to examine specifically this latest cycle. What do we mean by a macroeconomic fluctuation? A perturbation of the trend. The perturbation had a down side. Then there was a deep crisis point where the financial system was in jeopardy. And once past that point in the final months of recession, the economy moved to the recovery phase which it is in now.
In no way was the down phase due to too much planned saving. In the 4th quarter of 2007, gross domestic investment exceeded gross saving by $700 billion. In the crisis phase, I and many others judge it was correct to apply monetary and fiscal stimulus to prevent breakdown of the global financial system. This cycle was unique in that regard going back to at least the Depression. But contrary to your core argument, neither was the crisis phase due to too much planned saving. Gross saving was $550 billion short of gross domestic investment during the deep crisis months.
The recovery phase is characterized by even less satisfactory saving. Net national saving went negative during the crisis and has been negative ever since until late last year. Gross domestic investment still exceeds gross saving by $475 billion as we speak. Is this somehow without consequence??
You want the economy to grow faster. And so propose artificial Keynesian demand stimulus with funds borrowed by the government and injected into the demand stream. From where do these funds come, and what will be the long-term consequences of such borrowing? Debt must be either repaid or defaulted on. Since the US as a superpower cannot outright default, the default would have to come via inflationary debasement of the currency. I presume you do not want to morally cheat that way. Hence we are left with repayment. But to repay, the repayment has to come from viable new investments that throw off real world surplus. Might that be the investment the Fed is trying to simulate the housing market with? I don’t think so. Might that be mass entitlement transfers that leak into demand for foreign goods and the 90% of consumer spending on ethereal though necessary nondurables and services? Some, though not much. Might that come from injecting funds into the business sector? Much better. Doing that would feed the goose that lays the golden eggs, but the number of Keynesian economists proposing corporate tax cuts to leave investable funds with businesses so they can reallocate capital properly would fit on the head of a pin.
The tradeoff between short and long-run is a thorny one. Where does one stop and the other begin? You cannot run a deficit year after year for 48 of 52 years and appeal: Don’t worry about the short-term borrowing we want to do right now, we’ll run a surplus when the economy gets back on its feet. You Keynesians have lost all credibility. A swath of America knows it, and a larger swath senses it. For the 20 years prior to the crisis the nation’s surplus was a mere 4% of annual output; during the 50s and 60s it was over 10%. This is the core of the problem. The long-run has caught up with us. It is here now. All the years of Keynesian profligacy are going to degrade growth a decade or more beyond. Yes we could print a 3% GDP number for a year or so by doing another trillion of fiscal spending. But growth would drop back after the initial impulse. And this marginal percentage point for a year would be swamped by a long sequence of negative shavings for years after that would result from (a) the stimulus funds being ill-spent, that is not productively, and (b) by the increasing deleterious consequences of the cumulative additions to the debt. One of the many consequences would be a stacked-on-top $250 billion or more in Treasury interest obligations 10 years out.
For the hundreds or thousands who browse this site but do not post, let me make an observation in the form of a question to reflect on. Is it easier to understand the movement of the price of gold, that is to have a theory that predicts, or to understand the far larger complexity of a modern economy? The answer should be obvious. Yet in the April 16th post – Gold Prices Falling – neither the poster nor but one of the 42 comments evidences any firm theoretical grasp of gold. Innumerable speculations, but nothing even close to solid. Zero Hedge had a post where about 20 differing views were registered. Of all these, only this post by A gets to the heart of the matter: What about the impressive fiscal consolidation in course (on what the inflation ultimately depends)?
Why then are we to have any faith in the Keynesian paradigm of those who cannot forecast the complex economy very well, if they do not even grasp the workings of a far simpler macro variable like gold? Gold for hundreds of years until recently was at the heart of the monetary system. Reflexively, gold must be saying something about purchasing power expectations. (A simplistic reading will translate this statement into today’s conventional inflationary expectations and dismiss it, but that is not what I am saying.) Gold’s drop is actually a very good sign for the longer-term outlook of the US economy. It manifestly is not sign of an impending recession. That gold fell a few hundred dollars an ounce during the recession is beside the point, as at that time there was a context-specific reason for that temporary countertrend move.
Bruce Carmon I’m impressed you bring Lacy Hunt’s work to our attention (Hoisington link). I read Hunt religiously. In his first quarter report he says: Borrowing to finance consumption does not generate a productive income stream nor does it create the resources to repay the borrowed funds. This puts my above point very pithily. The Hoisington people are very good forecasters, which is why I follow them. There is much, much more in this report. Specifically and not limited to this, Hunt cites 4 studies that document the deleterious effects of government size and government debt when we get into the Reinhart Rogoff region (my terminology). Three of the four studies were conducted by foreign scholars. This is triangulation, the thing that gives a pilot assurance about directional course. One of these studies is by Cecchetti et al. Cecchetti is one of the world’s most insightful economists. He’s with the Bank for International Settlements, the foremost insightful institution. Another of the most insightful economists is John Geanapolous at Yale. What breeds this in Geanapolous is his real world grasp via connectedness with Wall Street. This is by way of introducing a gap in Lacy Hunt’s analysis of M2 money, monetary base, and velocity. Geanapolous did the seminal work on the leverage cycle. At heart, the operative variable is bank regulatory capital. The money multiplier Hunt talks about is not the binding constraint in today’s economy. The binding constraint is bank regulatory capital. Money and Banking books are sadly deficient about this core concept, and need be completely rewritten. It is not worth a dime of your money to take a Money and Banking course right now (conditional on the instructor). Hunt is right. He says: Inflation cannot ignite in such an environment. As well, Hunt’s insight that the aggregate supply curve is shifting outward because of Chinese cheap labor. However, the Geanapolous illumination about regulatory capital is the real reason why the QEs are not translating into inflationary M2 growth. That constraint will lift as time goes on.
You will have a completely different view of the economic world that will let you forecast better if you digest what Cecchetti, Geanapolous, and Hunt have written the past few years. It is quite at odds with the effete Keynesian conceptual malapropisms you read here.
Acerimusdux Precisely why would some civilization elsewhere have to run a corresponding deficit?
Chinn, A is right.
You can’t just compare 1 SE confidence intervals and then claim that “oh, now it’s ok.” . If the samples are not independent (as they are probably not), confidence intervals for one mean and for the difference of the means can behave very differently.
If they want to know what are the plausible differences, they should just calculate the confidence interval of the difference.
Carlos Cinelli: Yes, I’d prefer a formal test. But I’m not going to download the data to do it. If you do it, I would be happy to report the results, either way.
I admit to not reading your book. On the other hand, scientific communication has evolved toward short manuscripts that cut off verbiage and crystallize the main points in the Abstract, which may be as short as 200 words. Furthermore, as a non-economist, I don’t have to read everything you’ve ever written to ask you questions. It is the responsibility of the investigator to make himself clear to the general public, especially when this investigator has chosen to have a public presence.
In the CFR manuscript you seems to be concerned with the federal debt based on the geopolitical grounds. In particular in the intro you write:
“Taking the initiative now to reduce borrowing will give the United States greater control over its economic destiny. Failure to do so will cede to foreign governments increasing influence over the nation’s fate. Perhaps equally alarming, it will lead to slower growth, escalating trade friction, and reduced American influence in political and economic spheres.”
The prescriptions are:
1. To cut the federal budget deficit – 2005 is not 2008-13, but still a massive stimulus would’ve added to the federal debt massively and dug the nation into a deeper hole, especially – regardless of what the multipliers are, there is little evidence that the economy can function on its on without substantial reforms after the stimulus is withdrawn.
2. You seem to argue for a reduction in oil imports, yet publicly you don’t seem to support home based oil exploration. One would imagine that in the face of potential loss of standing in the world, we should speed up such activity.
3. You argue for a Plaza accord for China. That has not happen and does not look like happening soon. Shouldn’t you publicly support branding China a currency manipulator, since it refuses to be a responsible member of the international community? Furthermore, what would be the consequences of the recent anti-Plaza in Japan?
Finally, have you geopolitical fears materialize?
Thank you
89801783: Well, I have on multiple occasions owned up to the fact that my fears of the dollar run (and commensurate jump up in US Treasury yields) did not materialize, on this blog. You didn’t need to buy the book to find that out — just read this blog. Geez.
Chinn,
But what needs to be clear is that his argument is not valid, be it with 2SE or with 1SE.
You can’t say that since you do not have a “proper test” then you will take the result of a wrong test. The eyeballing of CIs claiming significance in this case is wrong, it is not “crude” or anything of the sort.
His first argument was overlapping 2SE CI, then he realized it was not valid even in the standard t test with random i.i.d samples.
Then he argued about the overlapping 1SE CI, and he claimed that it was alright based on the paper he linked. Well, that “rule of thumb” works out when you have random i.i.d samples and mean has a t distribution. When you’re dealing with growth rates and debts of countries, this is not the case. I imagine that we can’t say that the “sample” from the over 90% debt is independent from the “sample” of the less then 90% debt.
So, when there is any sort of dependence or non-randomnes or anything of the sort, the “eyeballing” can be completely misleading. CI’s of individual means can be completely different from CI’s of their differences and you can’t just compare CIs. The very paper he linked sates that when it discusses the results of figure 4.
So my point here is that that comparison is not valid, even in a “crude” way.
But, most fundamentally, this is not a test problem, it is an estimation problem. We want to estimate the difference of growth of both “types” of countries.
Let’s say that we derive the correct distribution for the difference of the means and the 95% confidence interval gives you [0, 5.2]. The zero is there in the interval, but it is only the lower end, and most plausible values are of big economic differences. The significance here is beside the point. Now suppose that the confidence interval gives [.00001, 0.000002]. It a very ‘significant” result but economically meaningless. The significance here is beside the point too.
So, the analysis he made is wrong in both ways. Statiscally it is not valid, because you can’t compare CIs like that. And economically, it does not make sense, because we do not want to know if the difference is exactly zero, we wan’t an estimate of the plausible values to take a decision.
Carlos Cinelli: Well, in my experience, most times a rule of thumb is pretty good as a first cut. But as I said before, a formal test of differences (from a regression), so one could if the threshold effect is there, would be better. I don’t think I agree that a difference is uninteresting. R&R seemed to think it was interesteing. So I suggest in order to add to the discussion, run a regression of growth rates on discretized debt levels, using R&R data, and report back to me your results. I will be glad to post.
Painful austerity is working great in the US!
http://www.aei-ideas.org/2013/04/so-is-us-spending-austerity-working-or-not/
Thoughts on the 3rd graph?