Broad market indicators like the S&P500 have been making all-time nominal highs. What’s the significance of that for investors and the economy?
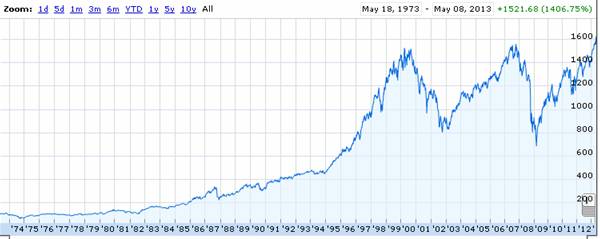 |
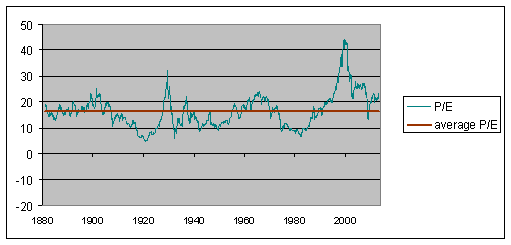
Rather than just look at nominal stock prices, it makes more sense to compare the price relative to earnings. Yale Professor Robert Shiller has suggested relating the current inflation-adjusted S&P500 to the previous ten-year-average of inflation-adjusted earnings. While one could reasonably argue that what happens over the next ten years is more relevant than what happened over the last, an advantage of Shiller’s approach is that it is perfectly objective and one can see what kinds of values have been typical going all the way back to 1880. By Shiller’s measure, the current backward-looking real P/E is up to 23.4, well above its historical average value of 16.5.
 |
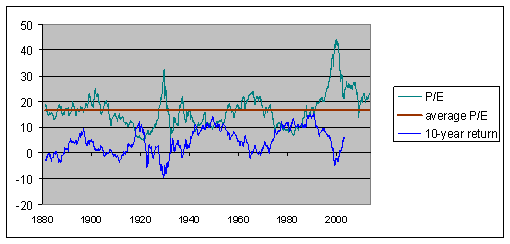
If the ratio of price to historical earnings is unusually high right now, and if you expect the ratio to revert to more typical values, it suggests that you should expect a lower capital gain on stocks you buy today compared to what you would have earned if you bought at a time when the P/E was at or below its historical average. The blue line in the graph below shows the annual rate of return you would have earned by buying stocks at any indicated date and holding on to them for the next decade. That line stops in May 2003, because we don’t yet know what the 10-year return of a stock purchased in June 2003 will turn out to be, and we certainly don’t know what the 10-year return on a stock purchased in May 2013 is going to be. But what we do know is that in the historical record, you did indeed tend to earn a lower return on stocks if you bought them at a time like today when the P/E is relatively high.
 |
So how will you do if you buy stocks today at these historically high valuations? Fernando Duarte and Carlo Rosa of the Federal Reserve Bank of New York surveyed 29 different forecasters and models for their calculation of the expected return on stocks relative to that on bonds. Obviously you want to take anybody’s claim that they know where the stock market is headed with a rather large grain of salt. But it’s interesting that the consensus assessment of this group is that stocks will outperform bonds by as high or higher margin as ever would have been expected over the last half century.
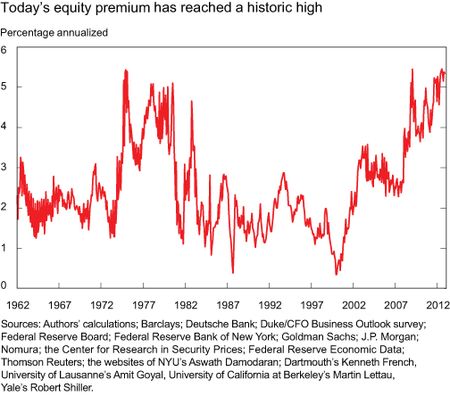 |
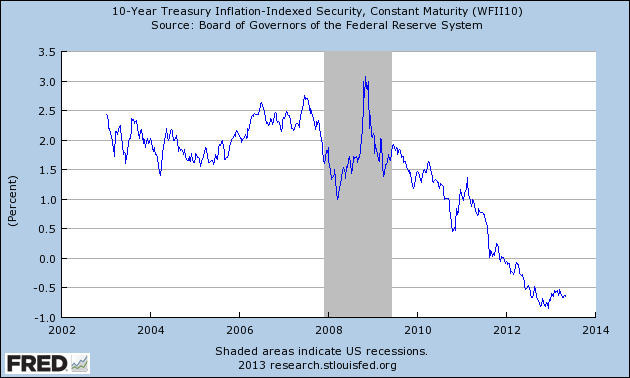
Actually there’s not a contradiction between saying that stocks will do worse than average over the next decade but better than bonds, provided that bonds are going to do much worse than average over the next decade. Duarte and Rosa conclude that this is indeed the primary explanation for why the current excess return on stocks is calculated to be so high. For example, the current yield on a 10-year Treasury Inflation Protected Security is -0.62% annually. So it’s not making too bold a claim that you can find something better than a guaranteed loss (in real terms) each year over the next decade.
 |
In part the strong stock market may be signaling optimism about the real economy. But another very important factor is that stocks look good primarily in comparison to the dismal return you can expect from bonds.
Stocks look great because corporations understand they can continue stealing from their workers. Profits over all!
Seriously, who is going to raise corporate taxes? Congress? HA!
Is it odd to say, “buy low, sell high?” If as PE ratios indicate equities are above the norm, and as the graph above indicates TIPS are at a very low level, what is that telling us?
Professor, this is very good analysis. You give data that will allow each person to make up his own mind.
Good post.
It’s also fun to look at the S&P divided by the Federal Reserve balance sheet.
Ricardo,
Those are TIPS yields, not prices, meaning TIPS are priced at all-time highs.
Hussman does a lot of valuation models here including those based on the Shiller PE and estimates a 3.6% annual nominal returns for stocks. Hussman is a smart guy, although his investors would have been better off putting their money into a bond fund since fund inception. Let’s say that his valuation models make sense.
Assuming based on historical data that starting bond yield is a good predictor of 10-year nominal bond returns , bond returns should be ~2% annually in nominal terms.
The ERP in this case would be less than 2% it seems.
We are witnessing yet another form of legalized theft where insider gamblers are rewarded at the expense of the wealth creators, savers and investors.
The Bernanke model is a well-oiled machine which works perfectly.
Professor Hamilton,
Do you or others have any comments about various changes in the computation of EPS over the years? For example, changes have occurred related to stock options and items in comprehensive income. Is the EPS calculation equivalent today compared to ten years ago or to 50 years ago? Has anyone done a study to compare the impact of various GAAP changes on computed EPS?
Autocorrelation spectral analysis of Shiller’s S&P 500/Composite and reported earnings indicates a 6-year rhythm. The 6-year average P/E is 29 (WOW!!!), which is WAAAAAAAY above the highs of ~18 of previous secular bull market highs, and TWICE OR MORE the average of 15, and just 13 before the unprecedented tech bubble valuations of the ’90s.
There has never been a positive real 5- and 10-year change for the S&P 500 with the 6-year P/E at or above 18, including since ’00 and ’07 so far. Adjust further for the value of the US$, and the result is worse.
The average 6- and 12-year P/Es at secular bear market lows of the past were 8-10, which is what the Boomer demographic drag effects imply for the early to mid-’20s:
http://www.frbsf.org/publications/economics/letter/2011/el2011-26.html
Therefore, an equity shareholder faces a cyclical drawdown risk of 35-50%+ for the prospect of an average return of no better than cash over the next 5 to 10 years.
During the second half of a secular bear market, liquidity preference and return “of” one’s money is the imperative vs. return “on” one’s money.
But few apparently care about fundamentals, valuations, technicals, or sentiment with the 5 largest TBTE banks directing the Fed to print them $3 trillion to credit their balance sheets by year end.
“Stocks look great because corporations understand they can continue stealing from their workers. Profits over all!”
Nick, not just stealing from labor but also theft of shareholder value via borrowing money against shareholder equity to buy back stock to artificially pump up earnings/share with flat or falling revenues; pay CEO bonuses for managing earnings/share and the stock price; and award restricted stock options at guaranteed artificially inflated values, and thus huge capital gains, based on CEO managing of earnings/share and theft of shareholder value.
Wall St., mutual fund, pension, and hedge fund managers, advisors, planners, the financial services industry, the top 1-10%, and the financial mass-media influentials are all tacit enablers of, and complicit in, the fraud that has now become institutionalized and thus a protected racket.
Not to be pimping for someone (I have no financial interest), but Jeff Seymour (http://www.triwealth.com/blog/) does an exemplary job exposing the financial services industry fraud in his e-book at the link below:
http://tinyurl.com/ceskrbf
I highly recommend Jeff’s book.
Bruce Carman,
No one ever called me an optimist, but I think you can throw all that historical P/E analysis right out the window.
All that data is from periods when Zimbabwe Ben wasn’t printing a trillion dollars a year, and real interest rates weren’t negative.
We may not have positive real returns on the S&P for the next 10 years, but the odds are way better than positive real returns on cash or bonds.
I’m still long a diversified portfolio of equities, real estate, precious metals, and other commodities. In that order.
“Obviously you want to take anybody’s claim that they know where the stock market is headed with a rather large grain of salt.”
Out of curiousity, what is the historical correlation between the ERP forecast from Liberty Street and the realized 10-year forward return? Their “Model Performance” shows they outperform the historical average, but the historical correlation between trailing 10-year and forward 10-year returns is about -0.3, so they aren’t exactly setting a very high bar for themselves.
Looking at the graph for their forecast equity risk premium, I note that the forecasters said the ERP was incredibly high in the late 70’s. Of course, this was just before the only post-war period (before the Great Recession) in which stocks underperformed bonds over 5-10 year horizons. Also, their ERP forecast was at its lowest levels during the 80’s and 90’s. Finally, their ERP forecast creeps up again in the mid-00’s, just in time for the financial crisis.
So, color me skeptical. On the whole, it looks like their expectations have been pretty much dead wrong at almost every turn. As the saying goes, “It is difficult to make predictions, especially about the future.”
Looks like buy and hold for index funds has yielded 5-6 percent over the period.
Prof. Hamilton,
I do not think that just comparing the expected average returns of bonds, stocks, or any other asset class is a proper and prudent approach to derive any investment advice. As an old Russian proverbial says, the pond in the village has had an average depth of 1 meter. The cow drowned anyhow.
What about the risk for the different asset classes? It does not tell me much that current TIPS’s real return is -0.62% annually vs. a historically low, but positive expected average return from stocks over the next 10 years, because this totally ignores that there are different probability distributions for the returns from the various investments. The expected average return from stocks over the next 10 years may be higher than the one from treasuries, but what is the actual probability that the return from stocks will be lower than the one from treasuries over the same time period? Or, for instance, what is the probability to lose 50% or more of your investment in treasuries vs. the probability to lose 50% or more of your investment in stocks over the next 10 years?
Any discussion and mathematical assessment what a good investment is vs. another one, which does not include also a discussion and mathematical assessment of the risk involved with different investments is not of much use. And ignoring the different risks involved with investments in different asset classes is not very wise.
One more stats lesson for Jim : Never look at the past to know the future.
Jan P Perlwitz,
Indeed. You are correct to focus on the long-term range of outcomes rather than annual volatility as so many naive academics and practitioners do.
I don’t care what path my stock portfolio takes in the next 10 or 20 years as long as I believe the endpoint will be higher with a large degree of certainty than a portfolio of cash and bonds. In fact, volatility is actually beneficial because it provides for dollar-cost-averaging and dividend reinvestment at lower prices.
Having said that, I am fairly confident that stocks will outperform cash and bonds over the next 10 and 20 years, and the likelihood of negative real returns to cash and bonds is very high.
Shiller uses a ten year moving average of earnings to keep from distorting the PE by using one years worth of unusually high of low earnings.
But because of the severity of the drop in EPS in the last recession the ten year EPS growth is now only about 4% versus the long run trend of some 7%
EPS growth.
This is creating exactly the type of distortion his measure is designed to avoid.
But we are now in a 4% nominal GDP growth world —
2% inflation and 2% real growth — so maybe we should be discounting 4% earnings growth rather than 7%.
Thanks Varones. My error.
For investment purposes, it makes no sense to compare stocks with tips. The opportunity cost of investing in risky assets, like stocks, is not tips or treasuries. It’s probably a bond fund or a real estate fund for the typical person with some type of defined contribution pension. Thus, the practical comparison would be bond fund/real estate fund vs stock fund. or, for the individual who manages their own portfolio, stocks vs bonds/commodities/real estate.
Essentially, the only difference between the stock funds and bond funds in terms of diversfication during a downturn is that the decline in the bond fund will be less than the decline in the stock fund. They both decline. The same is true for international diversification. Most markets tend to fall together, reducing the impact of global diversification.
If you can invest directly in bonds and stocks, then buying a corporate bond and holding it to maturity has much less risk than buying stocks. Holding a bond to maturity eliminates risk (barring default) as long as the bond makes all of its interest and principal payments. If the company does default, you are likely to get something from the bond. In contrast, you get nothing if you invested in the same company’s equity, it’s value goes to $0.
Regarding the use of treasuries in any valuation model –
The model and it’s predictions are obviously flawed given the level of FED intervention.
Assume that such a model predicts a 5 year return of 8% today. Tomorrow, the FED announces an end to bond buying. Stocks and bonds would crash as interest rates rise. The treasury based model’s prediction turns out to be wrong not because of a fundamental deviation from the historical relationship between the variation in interest rates and stocks, but because the FED removed its market distorting policy.
Clearly the family of models that are based on treasuries in any way, cannot be trusted.
Likewise, why would anyone follow ‘consensus’ forecasts? The data shows they are nearly worthless.
It’s been interesting to see how many shares have been and will be bought back. It’s a way of “investing” and it reaches the market prices in key ways, but it’s not the most desirable use of cash .. sort of a meh-confidence vote.
It’s worth asking: why are people willing to invest in U.S. government inflation-adjusted bonds which yield a negative real rate of return?
And why have corporate profits skyrocketed even though American technological innovation has faltered (we now lag behind Bulgaria in internet speed, we lag behind Europe in medical innovations, we lag behind Taiwan in inventing new consumer electronics like netbooks) and the number of American tech patents has plummeted relative to the rest of the world?
This is what happens when criminal fraud infects the entire economic system. People invest in money-losing government-backed securities that lose 0.65% per year, because it’s better than the alternative — investing in a corporate bond or stock of a system so corrupt that you’re likely to buy shares in the next Enron or the next subprime mortgage CDO, and lose everything.
Corporate profits have skyrocketed because the message sent by the Obama administration’s refusal to prosecute even one single Wall Street crime lord for criminal fraud is pellucidly clear: anything goes. Commit all the fraud you like, steal investors blind, loot the company and run laughing to your private island bought with stolen money. The government will never prosecute you, and the taxpayers will bail out the giant bank or huge company you looted into bankruptcy.
This is what happens to an economy when control fraud replaces legitimate entrepeneurship.
Interesting article by Feldstein in today’s WSJ –
Here’s a snippet –
Earnings per share of the Standard & Poor’s 500 stocks rose 50% in 2010 and a further 9% in 2011, driving the increase in share prices. The S&P price-earnings ratio actually fell to 17 at the start of 2013 from 21 at the start of 2010, showing the importance of increased earnings rather than an increased demand for equities.
In short, it isn’t at all clear that the Fed’s long-term asset purchases have raised equity values as the portfolio balance theory predicted. Even if it did account for the entire rise in equity values, the increase in household equity wealth would have only a relatively small effect on consumer spending and GDP growth.
There is one further puzzle about the quantitative-easing program. The Fed’s purchase of Treasury bonds and other long-term securities has not been nearly as large as the increase in the government debt during the same period. The Fed’s balance sheet has grown by less than $2.5 trillion since the summer of 2007, while the federal debt has grown by more than twice that amount just since the beginning of 2009. As a result, the public has had to absorb more than $2 trillion of net government debt during the past three years. At best, the Fed’s long-term asset purchases reduced the extent to which the federal deficits crowded out equity purchases.
http://online.wsj.com/article/SB10001424127887324326504578467592090881604.html?mod=WSJ_Opinion_LEADTop
His larger point is that FED asset purchases have had little effect on consumption through the portfolio balance effect and should end.
tj Feldstein’s op-ed piece is yet another example (as though we needed one) of good economists gone bad after submitting too many op-ed pieces to the print version of Fox News. I would use the op-ed page of the WSJ to line the bird cage, but I’m afraid my canary might read it and lose 20 IQ points. A long time ago Feldstein used to be a really first rate economist. And he’s still capable of writing decent academic papers; but when he turns his pen to writing WSJ op-ed schlock, his brain goes to mush.
His larger point is that FED asset purchases have had little effect on consumption
Apparently Marty is the only person with a pulse who actually believed Bernanke’s fig leaf story about QE being an attempt to stimulate consumption through a portfolio balance effect. Note to the clueless: it was ALWAYS about raising inflationary expectations. The stuff about portfolio balances and wealth effects was just a little fairy tale that only Tea Party politicians were expected to believe. As to the effectiveness of the various QE excursions, they did accomplish the all important task of reversing disinflation and stemming the threat of deflation. No small accomplishment.
the public has had to absorb more than $2 trillion of net government debt during the past three years
Huh? Households and businesses were looking for a safe place to park the savings needed to deleverage debt and US Treasuries provided those safe financial assets. It’s also a little strange to talk about how Treasury bonds were absorbing savings that could have gone towards private sector investment and then in the very same post talk about how equity prices increased due to demand for stocks.
the Fed’s long-term asset purchases reduced the extent to which the federal deficits crowded out equity purchases.
Earth to tj…Earth to tj…The economy is in a liquidity trap with short term interest rates at the zero lower bound. Government debt is not crowding out private sector investment. If anything government spending is crowding in private investment by increasing aggregate demand. This is not 1979.
@JDH – I think only a small part of the market believes as you suggest that growth is likely to accelerate, thus rates will go up, thus it’s time to rotate out of bonds and into stocks. The problem with this theory is that rates remain very low. They have risen some recently but after a larger decline. Big picture is bond prices have been meandering sideways while stock prices have been winding their way upwards. The rotation story doesn’t hold up when you look at charts that run longer than a month or two.
Another reason to own stocks is that the growth outlook has worsened and so rates are likely to stay low for longer. This opinion is consistent with what we’re seeing in commodity markets.
Both opinions coexist in the market, but I think the latter is more popular.
@tj – Feldstein’s point on QE was partly right, until recently. Stock prices boomed as earnings and earnings expectations boomed, after a sharp collapse in 2009.
But QE has been a part of that profit boom story. Get to know the profit equation (profits = business investment + dividends + public deficits + current account – personal savings). QE funds public deficits and personal borrowing (mortgages), which add to profits.
And recently, earnings and expectations have leveled out, but stock prices have continued to climb. So we have to ask why investors are willing to pay more for the same amount of expected future earnings.
Thank you for this excellent analysis. I’ve been looking for something that put current stock prices not merely in the context of real prices or P/Es relative to past P/Es, but also in terms relative to historically low bond yields. And as you note, stock prices are still very low relative to long term interest rates.
As for some of the negative comments that say this information isn’t of much use without knowing the risk distribution faced by stocks going forward, this strongly overstates the case. Yes, it would be better if one knew the exact risks faced by stocks if one wished to assess their underlying value, but this has always been the case. What’s more, this has always been pretty much impossible to do accurately – there are too many unknown unknowns.
However, what the second-to-last graph does tell you is that with today’s equity premiums at record levels, the distribution of possible outcomes would have to be substantially worse than it’s been historically.
Interesting comments regarding PE…
Prof Hamilton comments that backwards looking PE is no indicator of future PE…
Nothing is more true when using the current 10 yr history. Shiller’s PE calc is just silly.
What Mr. Shiller should do is go back in time and compare a similar 10 yr backward time frame to the 2008 2009 timeframe when earnings were zero or negative. He does not do this. Instead, he comapares today’s p/e to a p/e time period in which there were no earnings. That is flawed math and flawed logic.
When one compares growth of the S&P 500 to actual growth of profit (available via FRED)…one sees the disconnect between S&P 500 and profit growth that occurred in 2001 and 2008. It’s clear as day.
What is also clear as day is that today’s profit growth is faster than the growth of the S&P 500.