Crowding Out Watch, Continued
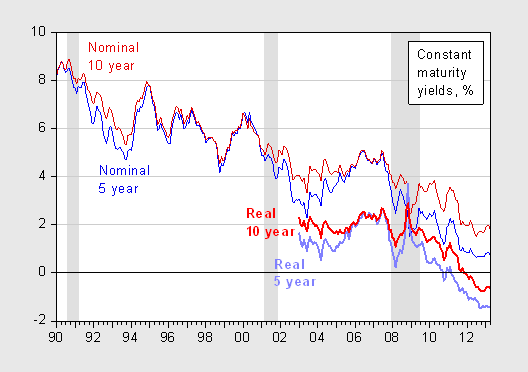
The end of the semester has arrived, and as I prepared my last lecture, I checked to see how the government deficits had impacted yields. Real yields were pretty much as they were when the semester began in January.

Figure 1: TIPS 10 year constant maturity yield (bold red), TIPS 5 year constant maturity (bold blue), nominal 10 year constant maturity (dark red), and nominal 5 year constant maturity (dark blue). NBER defined recession dates shaded gray. Source: St. Louis Fed FRED and NBER.
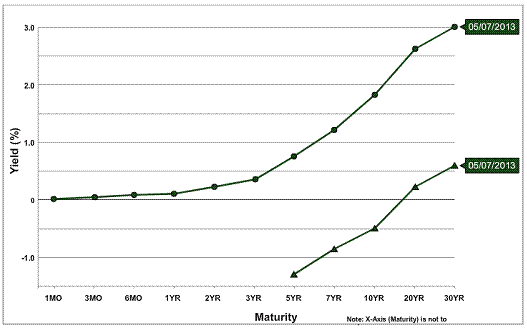
Here’s the yield curve as of 7 May:

Figure 2: Nominal Treasury yield curve (circles), and real Treasury yield curve (triangle). Source: US Treasury.
I was going to compare the 7 May yield curve against the 23 January yield curve (when the semester began), but they were so similar, it was pointless. Market indicators suggest negative real short term rates for the next ten years.
Professor Chinn,
How if any does the forecast of negative short term rates affect efficient frontier asset allocation? The historical allocation seems to have consistently been very close to 60% equity and 40% fixed.
Menzie,
You have to look at the forward rates, not yields, if you want to get a measure of market expectations of future rates. With the 5y at 0.75 and the 10 year at 1.82, you get a 5-10 forward of (10*1.82-5*0.75)/(10-5) = 2.89. I.e. more than the inflation target.
If we look at real yields we have -1.32 in the 5y and -.52 in the 10y with an implied 5-10 forward of 0.28. So they definitely don’t imply negative real short term rates for the next ten years. They *do* imply real rates that on *average* will be negative for the next ten years.
K: No argument on the expected inflation rates from forwards. I don’t think I invoked the pure EHTS in any case.
Re: real short rates, yes, you are right that it’s an average. It is conceivable they would be very negative next year, and positive the next, and negative again thereafter.
Thanks Menzie.
Two questions:
1. Why will yields be negative for the next 10 years? Are you forecasting government deficits for the next 10 years?
2. What impact will this have on the economy – unemployment and gdp?
There is no correlation or causation of govt deficits to interest rates. Only an idiot would waste time preparing a lecture on — never mind.
“It is conceivable they would be very negative next year, and positive the next, and negative again thereafter.”
Anything is conceivable. Implied swaption vols, for example, suggest a wide range of possible outcomes. But if we are talking about what the market is expecting as implied by yields, that is a positive real short rate within 5-7 years. To claim that “market indicators suggest negative real short term rates for the next ten years” is to accept market predictions as implied by 10y yields, but at the same time, to lend no weight to more negative short end spot yields.
Either way, of course, the outlook is abysmal. We need far more negative real rates *right* now, but short of revoking currency and putting the policy rate at -5% that isn’t going to happen. Speaking of which, it’s incredible that there isn’t more awareness of the benefits of this solution. Compared to entering into a perpetual liquidity trap, how painful could it be to eliminate paper money?
When reading the implied rates on the long term yield curve, one must presumably differentiate the natural component natural supply and demand for government‘ bonds and the financial component, the derivatives. The impact of the futures markets has not been quantified but they may be as reliable as the futures in the commodities markets
M. Chinn « they explain about 6% of the variation in changes in oil prices at the one year horizon »
The Federal reserve owns around 30% of the long term yield curve, the Central Banks are not neutral in the assets pricing, driving doubts on the predictive powers of the long term yields curves.
Then the theories 10 years real negative interest rates in the long term bonds, means the economies are still stocked with an I-S L-M curves below the balance of payment horizontal negative that is, unemployment below the full employment, and no answers given to fiscal, monetary foreign exchange policies under current practices. Difficult to assess the status quo for such a prolonged period, we may see correlations are causations well before.
Note that the Savings are in a continuous declining trend in Europe
ref ECB statistical hand book, and prices are higher than expected in many assets class.
It looks like an oddity within circumstances to ask, who is auditing the ECB , its value at risk, whether its capital is adequate and how it will it be uplifted?