There’s been a lot of discussion of upward movements in long term interest rates. I thought it useful to consider the revisions in expectations, over time, and in context.
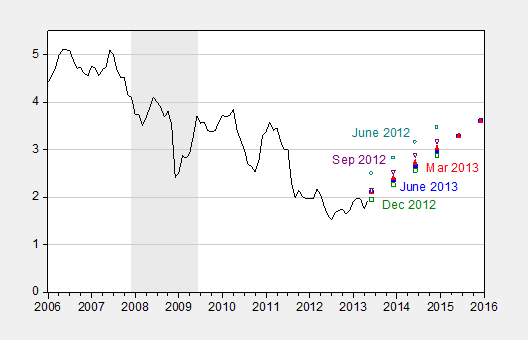
Figure 1: Ten year constant maturity Treasury yields (black), and expected ten year yields by vintage. Source: WSJ, June 2013 survey, St. Louis Fed FRED, NBER.
Two observations:
- The path of interest rates, while higher than that implied by the December 2012 survey, is lower than the September 2012 path.
- Expected yields as of end 2015 are about the same as than those recorded at the end of the recession.
Great chart. Hints at the prowess of the Bernanke Fed. It brought down the entire yield curve but didn’t leave 10-year yields stagnating below 2%.
Higher yields will drive increased US federal debt maintenance costs and that is worrying some market participants.
Inflation will stay low, below 2.5% for a long time, many many years as long as labor income stays so low. Low labor income in Europe is really bad. The mechanism I see is that labor has constrained liquidity, which lowers their natural rate of interest and with it inflation. The question I have is whether labor income will go so low that it pulls inflation into negative territory. Every low paid worker becomes a straw on the back of inflation until it breaks and falls into deflation.
A stubbornly high unemployment rate also lowers the natural rate of interest. And if it turns out as some of us say that the natural rate of unemployment has risen to at least 7%, then the natural rate of interest has shifted down even more. That shift won’t become apparent to interest rates until the end of the business cycle comes near, and then we will feel another drop in the interest rates.
Inflation goes as the natural rate of interest of labor goes.
Latest from Sivak. Recommended.
http://deepblue.lib.umich.edu/bitstream/handle/2027.42/98098/102947.pdf
It is instructive to look at the 10 year Treasury rates during previous periods of growth and previous periods of economic stagnation.
The low interest rates of today are unprecedented. The theory is that low interest rates stimulate the economy but what we observe is that since interest rates have been so low our economy has been in stagnation.
But it is also instructive to look at high interest rates such as those during the 1970s and early 1980s. This was also a period of economic stagnation.
What this seems to prove is that Knut Wicksell was essentially correct. When interest rates are held either higher than or lower than the natural rate (for prosperous periods the natural rate appears to be between 3.5% and 4.0%) there is economic dislocation.
That being the case, we see that the FED has pushed us between a rock and a hard place. Higher interest rates will be devastating to our national budget as interest payments would absorb a significant amount of the budget, probably in excess of defense spending, but keeping interest rates at the lower rate continues to create economic stagnation. There just is no good way out this mess that the command economy bureaucrats have put us in.
US treasury yields were under 4% from 1924 to 1965.
Yes, this included the depression, but overall it was an era of above trend real GDP growth.
If you want to look at history, maybe you should go a little further back.
Our views are shaped by the 1970s-1980s era,
but in the long term this was a historic anomalie.
reply to Spencer & Ricardo…
IMO, Rates lower than the natural rate lower the cost for creative investment. At higher rates people are not as likely to invest in creative ventures. Higher rates make for a more conservative economy.
The US economy is much more conservative in this regard since the 80’s.
So there is relatively little grass roots innovation going on now. Corporations command. Low rates don’t lead to much widespread grass roots ventures. All that kind of investment is happening in emerging countries.
Low rates now lead to bubbles. Where is the bubble now? It appears to be in emerging countries. Here is a link to a chart comparing the Fed rate to NGDP in relation to bubbles.
http://www.businessinsider.com/analyst-now-that-the-cheap-money-is-coming-to-an-end-we-can-see-where-the-bubbles-are-2013-6
Comment: US employment rates are high because the structural unemployment is high. A recovering global economy and a return of interest in venture capital markets will offset that structural unemployment to some extent by a US dollar whose value declines as investment capital flows out of the USA pick up.
Question: when will Americans stop viewing Federal Reserve policy through lenses shaped by culture of ‘celebrity narcissism’?
Given the mandate of the federal reserve, the Bernanke has done a great job. It is nothing short of miraculous in terms of what this US Fed has accomplished.
I hope I don’t ruin your reputation here but I agree with you concerning the lowering of US entrepreneurial activity. I saw an article just yesterday that revealed that innovation in new business in the emerging economies has passed the US.
But I see the next bubble as stock prices. PEs are too high and taxes and regulations are sucking the life out of profits. The stock market can’t sustain itself without profits no matter how much money the FED pumps into the economy.
Edward: “Inflation goes as the natural rate of interest of labor goes.”
Edward is correct:
https://www.box.com/s/655bfqdsxbcgfn0d8m0r
https://www.box.com/s/bqduja958olt3fs9x0m8
https://www.box.com/s/szg9200y60guiogn92bs
The trend rates of nominal after-tax and real wages imply that rates will remain at secular lows, which is consistent with a Long Wave Trough regime.
Wages simply cannot accelerate given public and private debt service, high payroll taxes, offshoring of production and employment, competition from billions of workers in the developing world, and accelerating automation of domestic labor, including increasingly in the services sector hereafter.
Steven, WRT “peak motoring”, see the following link for US auto sales and goods-producing employment per capita:
http://research.stlouisfed.org/fredgraph.png?g=jzp
Total vehicle sales per capita:
http://research.stlouisfed.org/fredgraph.png?g=jzy
Autos and light trucks per capita and nonfarm payrolls per capita:
http://research.stlouisfed.org/fredgraph.png?g=jzA
Private employment per capita (back to the level when auto sales per capita peaked and goods-producing employment commenced its secular decline coincident with deindustrialization):
http://research.stlouisfed.org/fredgraph.png?g=jzC
Not coincidentally, US auto sales per capita peaked with the secondary peak for US crude production at the price of oil at $10-$12 and the peak of valued-added goods-producing employment and the onset of deindustrialization and financialization of the economy.
Ricardo says: taxes and regulations are sucking the life out of profits. The stock market can’t sustain itself without profits
The FRED data says:
Corporate After Tax Profits
2008: $643.7B
2009: $1354.9B
2010: $1467.6B
2011: $1566.1B
2012: $1773.7B
But OMG…corporate profits dipped a whopping 1.9% last month and Ricardo flips out. All is lost! And it’s all the fault of that commie/pinko/socialist in the White House.
Give us a break.
westslope: I would welcome citation of any econometric analyses which back up your assertion that structural unemployment is high.
Bruce:
Good charts with the CPI and wage & salary disbursements. I calculate the natural interest rate of labor with the equations of effective demand.
http://effectivedemand.typepad.com/ed/2013/06/exchange-rate-between-capital-labor-a-wild-idea.html
I noticed that inflation was following the natural rate for labor and it made sense. Your charts show it too. and your reasoning shows that wages and consequently inflation will stay low. I would also add to your list that there is culture of paying low wages in business now. They have been trained to cut wages as much as possible. Fallacy of composition.
What the hell’s going on in China?
http://www.zerohedge.com/news/2013-06-19/chinas-red-flags
China Panic: Overnight Rate Hits 25%
Gordon Chang in Forbes
The overnight repo rate in China has just hit 25%, an indication the credit market is now frozen.
This month, liquidity tightened considerably. Two government bill auctions failed, and several banks defaulted on their interbank obligations. Overnight rates in the last few weeks surged to about 15% but had fallen back, settling in at just north of 7%. The 25% rate indicates credit is becoming unavailable.
Nothing is going right for China at the moment. In the last few hours, the HSBC Flash PMI for June came in at 48.3, down considerably from the 49.2 final reading for May. The country’s problems are now starting to feed on themselves.
What the People’s Bank of China , the central bank, does in the next few hours could be critical. One wrong move and defaults could roll through the country’s banking system and take down struggling enterprises and debt-laden local governments.
Steven: “What the hell’s going on in China?”
See charts at the following folder:
https://www.box.com/s/mcnwyaoy4h51vn3idenq
Trillions of dollars of US and Japanese FDI since the ’90s has resulted in the largest credit and fixed investment bubble in world history in China, far surpassing that of the US during the 1920s, ’90s, and ’00s, and Japan in the ’80s.
https://www.box.com/s/ttohuy8477q04uuqicir
China’s GDP in current Yuan terms has been growing at a DOUBLING TIME OF 4-5 YEARS and an implied domestic deflator rate of 8-9%.
https://www.box.com/s/9xsawsd8lg7xpae1y0xu
https://www.box.com/s/0qg903xl96e6b0yw1juc
China has grown in less than one-third the time it took the US to get to $7,000 GDP per capita from a similar starting point as the US. China has reached the “middle-income trap”.
The US and Japan built out their industrial economies to $7,000 GDP per capita on the basis of oil priced at $10-$20 (constant dollar), whereas China has attempted to industrialize with oil at 3-10 times this price while growing GDP in Yuan terms at a compounding doubling time of 4-5 years.
China’s runaway credit and fixed investment bubble is unprecedented in the history of the world, increasingly dependent upon FDI at 3-4% of GDP with oil imports now exceeding 50% of consumption. China is a runaway credit train heading for a sharp curve at the edge of a debt-deflationary cliff.
A decline in FDI by the US and Japan of as little as 1-1.5% equivalent of GDP in China risks a reverse multiplier effect to investment, production, and exports akin to a Great Depression-like contraction in China’s GDP in a relatively short period.
What will be most remarkable is not that China crashes, which is a mathematical certainty, but that it did not occur years sooner. Demographics will exacerbate the deflationary crash in China into the ’20s.
Once US supranational firms begin the process of attempting to repatriate US$’s from China’s banks via the Fed’s book entry custodial swaps of US Treasuries with the PBOC, and by way of the back door through Hong Kong and Singapore banks, the “giant sucking sound” of capital flight from China will be heard around the globe.
As is the historical precedent going back more than two centuries to the late 18th century, I fully expect the Chinese leadership to institute even stricter capital controls on its citizens and foreigners, seize foreigners’ assets, and restrict bank withdrawals when bank runs commence.
China will not continue her post-’90s super-exponential growth rate and become a western-like mass-consumer economy with increasing imports of energy, food, and materials. China will crash and grow old before growing rich.
China is a four-letter word, “sell”, but it is getting very late in the process to get one’s money out, if not already too late.
Ricardo Wrote:
“There just is no good way out this mess that the command economy bureaucrats have put us in.”
Did Ricardo note the mess that the Financial Industrial Complex put us in? The command economy bureaucrats are commanded by the FIC.
Slug,
Your aggregate analysis lumps FED monetary expansion into your numbers. Real businesses are hurting and no amount of statistical or econometric manipulation will change that. Let’s just see what is ahead.
I consider that Ricardo is communicating to us from an alternate universe, one without any links to back up his factual assertions.
The U.S. economy has no particular internal reasons to go into a recession right now, although Fiscal drag has made it very vulnerable to external shocks. It now appears about to get one from China and other members of the BRICS, as well as from the economies that rode the commodity bubble up with China (Australia, New Zealand, South Africa, and Canada come to mind). This has been the source of world economic growth since 2009. With it ending, what economic investment led demand will take its place? U.S. Housing? Rising interest rates will nip that in the bud pretty fast.
Nice charts, Bruce.
Yes, let’s just see. Mark this post June 20, 2013 and we will revisit it in 3 months. How’s that?
Going on my calendar now.
Regards.
I think interest rates will rise in the second half of this year, which means that will be when stocks start to fall.
Troy: “I think interest rates will rise in the second half of this year, which means that will be when stocks start to fall.”
https://www.box.com/s/lm412emuxx4tpzg9edt5
https://www.box.com/s/ks7i9g4lzj2ezyhvy68h
https://www.box.com/s/qpvvhcy08gd8gv604qwd
https://www.box.com/s/q4538hkpx6np1wrlil83
https://www.box.com/s/b8woajnhu9lql8fucptw
https://www.box.com/s/eoo9gzi7v2ndi6zfm3mf
It’s very late in the cycle, margin leverage is excessive, and secular valuations remain at extremes of overvaluation against trend earnings.
We know how this ends . . .
Menzie: I can’t help with an ‘econometric analysis’ showing higher structural unemployment.
Perhaps you can point out how econometric analysis of structural unemployment has vastly improved over the years. I recall a good number of macroeconomists suggesting that mistaken full employment targets consistently sabotaged attempts at counter-cyclical management during the 1970s and 1980s.
The failures were rather spectacular I thought (though they were excellent, wonderful opportunities for the financially literate to make gobs of money in a rather sorry zero-sum game). The failures inspired Prescott and Kydland’s work on time inconsistency and ultimately inspired a number of rich OECD countries to adopt single-mandate monetary policy starting with New Zealand.
Otherwise, I conclude that structural unemployment has increased by the persistence of high unemployment rates since the 2008 mega-financial crisis, increased income disparities among American workers, persistent and what appear to be growing significant educational and skill differences between ethnic groups, on-going efforts to profit-shift/subsidize industry by American states with poor productivity, the long-term trend of market share loss by US auto manufacturers, etc.
The information technology-driven economy seems to having positive benefits for some worker groups and, at least in the near-term, disastrous consequences for other worker groups.
westslope: in 1970 we couldn’t analyze large data sets easily (not even clear to me that micro data sets we use now existed back then).
Just saw Kydland speak. Not so convinced that rules solve everything.
Menzie: Even with extensive micro data sets allowing sophisticated panel estimation techniques, is it possible to estimate structural employment sufficiently well for policy purposes? A reference or a researcher’s name would be appreciated.
Elsewhere, is there a model that permits the accurate forecasting of distortion effects within capital markets? The loss of real income to older, financially unsophisticated savers? The enabled decrease in fiscal policy cooperation among political deciders?
Re: Kydland, was that your opinion on rules or his? I’m not convinced that rules solve everything either. But all policy in order to be successful over the long-run has to match available information, the effectiveness of existing tools and desired outcomes. The dual mandate over-reaches.