Plausible and Implausible Explanations for the lagging pace of growth
Employment growth continues, both total and private, as shown in Figures 1 and 2, below.
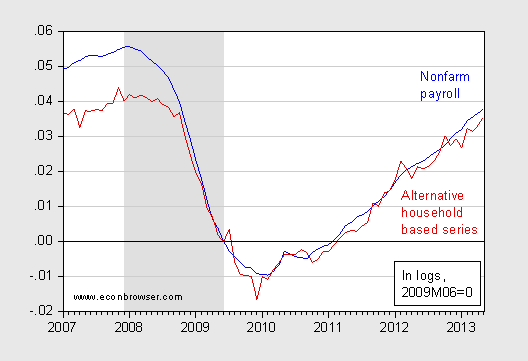
Figure 1: Log nonfarm payroll employment (blue), and household survey series, adjusted to conform to nonfarm payroll concept (red), both normalized to 2009M06=0. NBER recession dates shaded gray. Source: BLS, May employment situation release via FRED, BLS, and NBER.
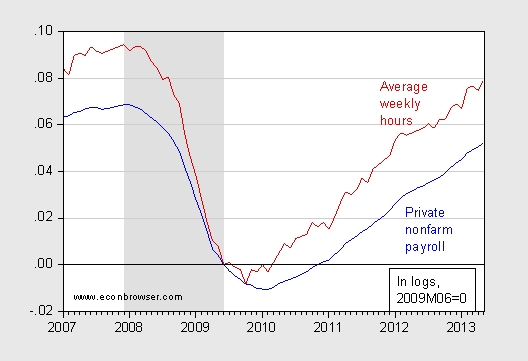
Figure 2: Log private nonfarm payroll employment (blue), and aggregate weekly hours index (red), both normalized to 2009M06=0. NBER recession dates shaded gray. Source: BLS, May employment situation release via FRED, and NBER.
The pace of employment growth is not particularly rapid, but conditioned on the aftermath of a balance sheet recession, this pace is not surprising. [1] [2] [3] [4] Several days ago, Professor Lazear wrote in the WSJ:
The U.S. is not getting back many of the jobs that were lost during the recession. At the present slow pace of job growth, it will require more than a decade to get back to full employment defined by prerecession standards.
…
Why have so many workers dropped out of the labor force and stopped actively seeking work? Partly this is due to sluggish economic growth. But research by the University of Chicago’s Casey Mulligan has suggested that because government benefits are lost when income rises, some people forgo poor jobs in lieu of government benefits—unemployment insurance, food stamps and disability benefits among the most obvious. The disability rolls have grown by 13% and the number receiving food stamps by 39% since 2009.
As an aside, I wonder if indeed it will take a decade to restore full employment. For instance, Aaronson and Brave (2013) suggest job creation at 165 thousand per month will imply full employment over the next five years. Mean employment growth has been 189 thousand per month in 2013 so far.
Professor Lazear’s appeal to structural factors is somewhat surprising given the findings in Lazear and Spletzer (2012):
The recession of 2007-09 witnessed high rates of unemployment that have been slow to recede. This has led many to conclude that structural changes have occurred in the labor market and that the economy will not return to the low rates of unemployment that prevailed in the recent past. Is this true? The question is important because central banks may be able to reduce unemployment that is cyclic in nature, but not that which is structural. An analysis of labor market data suggests that there are no structural changes that can explain movements in unemployment rates over recent years. Neither industrial nor demographic shifts nor a mismatch of skills with job vacancies is behind the increased rates of unemployment. Although mismatch increased during the recession, it retreated at the same rate. The patterns observed are consistent with unemployment being caused by cyclic phenomena that are more pronounced during the current recession than in prior recessions.
While Professor Lazear did mention cyclical factors, the focus in the oped does seem to be on structural factors. If one were to try to highlight quantitatively important variables, I’d look more to obvious demand factors, such as government employment. Figure 3 shows (not in logs) the difference in government employment relative to trough, for this recovery as well as the preceding two.
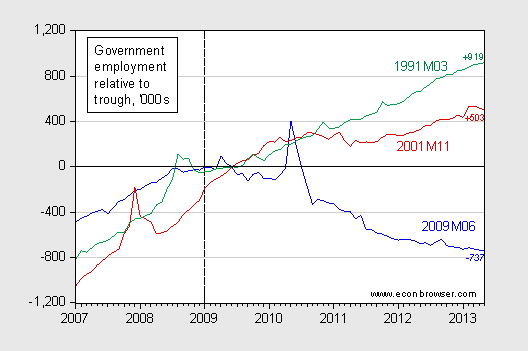
Figure 3: Government employment at all levels relative to 2009M06 (blue), relative to 2001M11 (red), and relative to 1991M03 (green), in ‘000s. Dashed line at trough. Source: May employment situation release via FRED, and NBER.
Government employment is about 1.2 million (1.6 million) less than that recorded in the corresponding period in the recovery starting in 2001M11 (1991M03). If government employment were 1.2 million higher in 2013M05, then (in a mechanical sense), total nonfarm payroll employment would have been about 0.9 percent higher than shown in Figure 1.
What about the structural argument à la Mulligan? Well if generous unemployment benefits and SNAP are to blame for the reported and unreported unemployment, that effect must be declining, as shown in Figure 4.
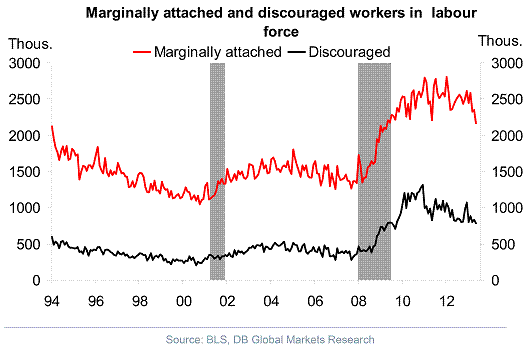
Figure 4: From Torsten Slok, “US Employment Outlook,” Deutsche Bank (June 2013) [not online].
In addition, wage pressures remain quiescent, further casting negative light on the benefits/supply restriction interpretation.
For more on labor-output dynamics, allowing for nonlinearities, see this post. For other discussion of the June employment release, see [Duy], [Casselman/WSJ RTE], [Izzo/WSJ RTE], and [Calculated Risk] and [CEA]. And, this post for a reminder that employment growth would be faster with additional fiscal stimulus.
Update, 1:15PM Pacific: Following up on the food stamp causes employment decline meme mentioned by jonathan, I plot below annualized growth rates in nonfarm payroll employment and real (PCE deflated) SNAP expenditures.
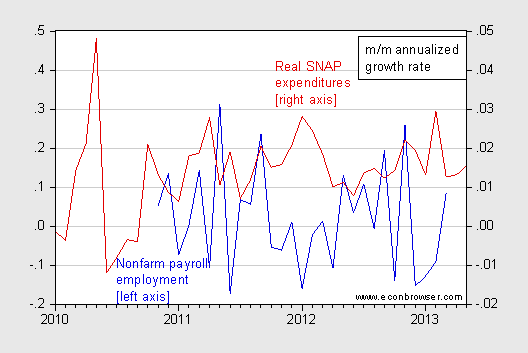
Figure 5: Annualized growth rates in nonfarm payroll employment (blue, left scale) and in real (PCE deflated) SNAP expenditures (red, right scale). Source: BLS June employment release via FRED, and USDA
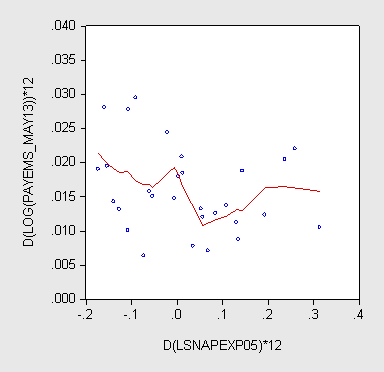
Figure 6: Annualized growth rates in nonfarm payroll employment vs. real (PCE deflated) SNAP expenditures, and nearest neighbor (LWR) fit (red line), bandwidth = 0.3. Source: BLS June employment release via FRED, and USDA
A Granger causality test rejects the employment does not cause SNAP expenditures null, but fails to reject the SNAP expenditures does not cause employment null.
I hesitate to find causation from noting that food stamps usage is up 39% to attributing that to a desire not to work. The idea shows a rather large lack of awareness of what food stamps buy and who uses them in normal times.
As for disability, I would think a rational idea is that, yes, people are filing for disability if they can but, again, disability doesn’t pay much so I think the far more rational idea is that unemployment encourages people to apply for benefits.
Now if the argument is, as has been made to me, that poor people should take any job anywhere and that it’s their fault if they don’t pick apples in Washington or go to the fields in Georgia, then …
http://research.stlouisfed.org/fredgraph.png?g=jgg
http://research.stlouisfed.org/fredgraph.png?g=jgh
Growth of employment and wages less productivity is converging with real final sales and the falling savings rate to GDP coincident with real imports contracting yoy.
The economy is vulnerable to any number of shocks, small or otherwise.
The administration will have to “manage” the deflator, inventories, and import data hereafter to avoid reporting an annualized contraction in real GDP hereafter.
I posted a graph of when the natural rate of unemployment rose. Basically, unemployment stayed steady above 9.5% while aggregate effective demand plummeted in 2009 to 2010. By the time aggregate effective demand fell to a level where the economy improves at slower and normal rates, high unemployment was the norm.
I still wonder what effect unemployment benefits had on that.
http://effectivedemand.typepad.com/ed/2013/05/the-as-ed-model-when-the-natural-rate-of-unemployment-rose.html
menzie, give me a hand here…
http://www.bls.gov/news.release/prod2.nr0.htm
this is a separate report from BLS on Productivity and Labor Costs for the First Quarter, which showed that unit labor costs fell at an annual rate of 4.3%, reflecting a 3.8% decrease in hourly compensation and a 0.5% increase in productivity, which they note as the largest hourly compensation decline in the series, which began in 1947; furthermore, this report has unit labor costs in manufacturing down 10.0%, reflecting a 3.5% increase in productivity and a 6.9 percent decrease in hourly compensation…real, inflation adjusted hourly compensation in manufacturing was shown as down 8.3% at an annualized rate in the first quarter; it was even worse in durable manufacturing, for which real hourly compensation is shown down 9.4%…as of yet, neither myself nor any of those i’ve asked have been able to reconcile the figures from this report and those on average hourly earnings from the establishment survey over the past several months…
I think the trade deficit changed the relationship between consumer spending and employment. U.S. Final Sales to Domestic Purchasers in the three years of 2004-2006 contained 94.6 percent Domestic Product (Table 1.4.6-GDP). Last year GDP grew by 4%(BEA). If trade in manufactured products had been balanced by more export sales from the U.S., GDP would have grown by 7.9%.
I think we just have moderate employment growth but if effect of obamacare is true (from Mish http://globaleconomicanalysis.blogspot.com/2013/06/jobs-175000-unemployment-rate-76-is.html, this employment is very weak growth. We can see the sharp drop on unemployment with less than high school diploma and it would be in line with Obamacare effect.
I think the employment number may not be the good representation of employment till 2014 from Obamacare effect. Maybe the adjustment of the effect of Obamacare on the employment number will help to see the real effect of economy on employment. The Obamacare also affect the wage outlook that will drop from here or stay at very low growth.
Another point on labor force participation rate. Over the year, the drop on unemployment rate mostly comes from drop on labor force participation rate by 0.5%, and now everyone expect better economy and we could see rising labor force participation rate and surely we could see 0.5-1% rise. The 170,000-200,000 employment numbers each month just support stable unemployment rate. That’s why we could see rising unemployment rate from here maybe at 7.7-7.8% at end-2013 to 2014.
I think employment number is just slow and not strong enough to reduce unemployment in the long run and effect of Obamacare will distort the rise in employment and surely depress the household income in the coming months.
Menzie, I think your title is incorrect. It might better be Disappointing Employment Growth Continues
I won’t go into the woulda, shoulda discussion, but how much of a shock would it take to get this Employment Growth train off the tracks?
rjs: Really don’t know offhand – would have to look at the releases. One place one could stumble in comparing numbers from different releases involves use of output deflators for productivity and sometimes CPI in deflation of wages (depends which release).
Government employment may be down well over a million jobs, but neither I nor my neighbors have noticed a difference. My elderly parents still get their social security checks, the roads are generally no worse around me than they were pre-2007, despite Lisa Jackson’s protestations the environment is no worse off, my mailbox is still stuffed with junk every day, and on and on and on.
In the short run a loss of government jobs is a negative for the economy, but in the long run, those people will transition into more productive positions.
Said differently, what pray tell were those 1 million+ government employees doing that was so vital and worthy of our tax dollars?
Brian: I don’t know — mebbe some of those let go were bridge inspectors. I can’t wait for some RIF at NOAA or USGS so we can see if you still don’t think any of it matters (like why would volcanoes ever interrupt air travel? And let’s cross fingers no more tornadoes).
Brian Prior to this summer most of the reduction in govt employment was at the state and local level. You very likely didn’t notice it…but the kids who went to public schools and public universities and community colleges almost certainly did. And in my area one interstate project was shut down halfway through…they did one side last year but didn’t have enough to finish the other side. And I know of two interstate bridges that had to forego repairs. In the case of one interstate bridge the solution was to shut down the two eastbound lanes across the bridge and reroute traffic. In another case they are just hoping that the current bridge, which was built in the early 1950s, doesn’t collapse…especially after a truck did structural damage after crashing through the barrier and plunging into the water. As to federal employment, people did notice. That’s why Congress suddenly came up with money to pay for meat inspectors and air traffic controllers. Congress always wants to take care of upper middle class folks who like filet mignon and flying business class with no layovers. There are other projects that just won’t get done. For example, a lot of audits and cost/benefit analyses within DoD are being cancelled, so the taxpayer will end up paying the price. But the biggest effect is that most federal workers are taking a 10%-20% pay cut on top of a pay freeze through the next 10 years. So that’s a lot of lost income to communities. Finally, federal employment heavily subsidizes private health insurance (the federal government is not just the largest, but is also the dominant subscriber to Blue Cross/Blue Shield), so the loss of that subsidy will get passed onto private sector companies.
Seriously…I’ve worked in both the private sector and the federal government. The idea that there’s a lot of difference in productivity between the two makes for good late night comedian jokes, but doesn’t have much to do with reality.
http://www.chicagofed.org/digital_assets/publications/chicago_fed_letter/2013/cfljuly2013_312.pdf
Consider that private “health care” (highly financialized via the insurance industry), household debt service, imported energy to wages and GDP, and total local, state, and federal gov’t spending cumulatively total an equivalent of more than 80% of the private economic value-added product of the US.
These sectors many years ago become subtractive to value-added real GDP per capita; therefore, all else equal, there can be no growth of real GDP per capita with these sectors persisting as net drags.
Put another way, to maintain the COLOSSAL net energy per capita waste of the current system, including the imperial war machine, it costs the private sector an equivalent of 80% of value-added output to keep the unsustainable system going.
The system rewards the top 0.1-1% to 10% to perpetuate a self-defeating process of net energy waste, EXTREME wealth and income concentration to the top 1-10%, and unprecedented indebtedness of the bottom 90% and the state to keep it that way.
Re: Plausible and Implausible Explanations for the lagging pace of growth
My vote would be the average 15%/year rate of increase in global (Brent) annual crude oil prices, from $25 in 2002 to $112 in 2012, which corresponded to an average 8.7%/year rate of decline in the ratio of Global Net Exports of oil (GNE*) to the Chindia region’s net oil imports, from 12.0 in 2002 to 5.0 in 2012.
*GNE = Combined net oil exports from the Top 33 net exporters as of 2005, EIA data, production = total petroleum liquids + other liquids
Why slow job growth?
There is nothing conceptually difficult about why employment has grown at such a slow pace this recovery unless you try to fit the explanation onto the Procrustean bed of received theory. Joblessness was already worsening sequentially during the three prior recoveries. By late-2007 it was predictable that the amount of time before payroll employment got back to its cycle peak would extend sequentially far more after this next recession. This is independent of the latest phase of major structural change that would come on the scene as the biggest credit bubble since the Depression burst to wreak far more damage to job creation. The lead foot was the deterioration in the trade deficit through 2007; the even bigger foot was all the private sector debt deleveraging about to take place. New credit is critical to growth. But beyond a certain point the remnant of all the credit excesses in the form of debt impedes growth as is evident from the data. Coupled together, the still-large trade deficit siphons away purchasing power from current income just as the new norm of much slower credit creation keeps credit from augmenting income as it had done so lavishly in the past. The interaction means existing jobs, import-competing jobs, and potential new jobs that will never be visible in the data because they aren’t created here, flow abroad to other countries.
Economic growth is the primary driver of employment. All else is secondary. Real GDP growth in the first three recovery years after the 1990, 2001, and 2008 recessions fell sequentially from earlier times to 3.2 to 2.7 to 2.2%. This is half the 5.5% average of the previous postwar recoveries that made it three years. Layered on top of the overall growth slowdown in the post-1990 era of joblessness, the rate of employment growth to GDP growth also halved. These then are the two foundational struts of the appropriate frame for analysis: an over 2-decade long period encompassing three cycles during which economic growth has halved, where the relationship between job creation and this half-growth halved as well! Clearly structural change has taken place, some smooth and some piecewise. And it is to this change rather than cyclicality that we must look for the real cause. Without approaching the issue of jobs from this holistic perspective, much of what passes for research is like drunks each under a different lamppost searching for their lost keys.
Though there is interaction between the two struts, the first order of business is to identify the main structural changes affecting each. Many if not most of these changes are not even recognized by conventional models. Omitted variable bias rules. The impact of globalization since the fall of the Berlin Wall, which not incidentally is where the main structural break began. The long credit cycle which generated unsustainable pseudo-growth, especially leading up to and during the decade the bubble grew exponentially prior to bursting. The payback phase we’re in today. The pre to post-1990 doubling of the regulatory burden which has increasingly hampered existing businesses and has caused much new business formation to be effectively stillborn. The corrosive effect of fiat money from 1971 on which has played a major behind-the-scenes role in the long sequence of trade deficits, budget deficits, ramp up of private sector debt, public debt, and in the process eroding the nation’s annual surplus from 10% of national income all the way to zero this past four years. And a government grown so large, spendthrift, and evermore intrusive into the private sector, that the motivation to work and incentive to take risks to build for the future have been blunted and curled back along a long margin of the economy’s production frontier.
Other than for the retirement demographic, the labor force participation rate has to have been affected by these structural changes. And we can be pretty sure of the direction. Moreover, the current administration in Washington has further bent the trend down, especially with but not limited to the message the passage of Obamacare sent to the business community. See NFIB surveys on this. At even deeper levels we can talk about the rapidity of technological change that’s enabled businesses laboring under all this to pell-mell substitute labor saving devices anywhere they can to simply survive. And coming next, the effect on employment of the distortions wrought by the QEs gone a couple bridges too far as all this liquidity inevitably gets unwound sometime in the years to come.
Regarding the budget cuts to air traffic control: a small airport nearby was scheduled to have its tower closed due to sequestration. The newspaper was filled with letters to the editor detailing the planes that will fall from the sky because of collisions, etc. You know what actually happened? The airport’s governing board raised the landing, hanger, and tie-down fees, which collected enough money to keep the tower open.
Craig You might want to look at little closer at that story. I think you’ll find that those air traffic controllers who went back to work thanks to local actions were actually private contractors. The FAA typically contracts out air traffic control duties for small regional airports. The government cut the funding for those contracts. There is nothing to prevent other entities from hiring those contractors after the government payments stop. But that is not true of government air traffic controllers. Those workers can only be funded via Congressionally appropriated dollars.
Government has lots of funny rules. For example, DoD workers whose jobs are funded by direct Congressional appropriations are subject to a furlough; however, DoD workers whose jobs are funded by foreign governments (e.g., those who work as procurement/contract specialists in the Foreign Military Sales directorates) are not subject to the furlough because their pay comes form a “3 percent fund” and that is not Congressionally appropriated.
I saw this study linked through Mark Thoma’s site.
Here is abstract:
“Disability insurance applications and awards are countercyclical. One possible explanation is that unemployed individuals who exhaust their Unemployment Insurance benefits use DI as a form of extended benefits. I exploit the haphazard pattern of Unemployment Insurance (UI) extensions in the Great Recession to identify the effect of UI exhaustion on DI application, using both aggregate data at the state-month level and microdata on unemployed individuals in the Current Population Survey. I find no indication that expiration of UI benefits causes DI applications. Estimates are sufficiently precise to rule out effects of meaningful magnitude.”
And directly at Mulligan, these lines: [This study] “rather tends to support alternative explanations for the countercyclicality of DI applications. For example, the cyclical pattern may simply reflect variation in the employment opportunities of the marginally disabled that influences SSA’s evaluation of the applicant’s employability.” In other words, if times are better and you’re somewhat disabled, you can find another job, maybe with the same employer maybe not, and can more easily switch at least temporarily into related work.
http://conference.nber.org/confer/2013/LMs13m/rothstein_ui-di_apr2013.pdf