The Philadelphia Fed’s coincident indices for April are out (h/t Mike Ivey). Wisconsin economic activity as measured by this index continues to surprise, but not in a good way.
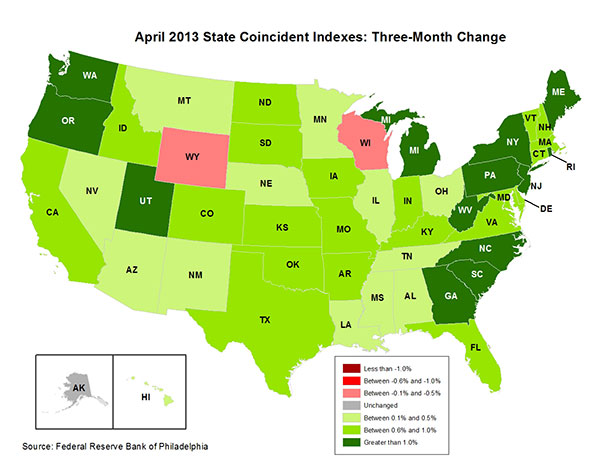
Source: Federal Reserve Bank of Philadelphia, April release.
Wisconsin’s decline is notable because the three month trajectory is not shared by any other state save one — Wyoming.
A time series graph highlights the remarkable persistence of Wisconsin’s economic underperformance since 2011M01.
Figure 1: Log coincident indices for Wisconsin (blue), Minnesota (red) and US (black), rescaled to 2011M01=0. Source: Philadelphia Fed and author’s calculations.
The fact that the Wisconsin index declined is no surprise to anybody who saw the establishment employment release for Wisconsin (refer to this post). However, it is interesting how few other states are experiencing declining coincident indices over the last three months, as shown in the first figure.
It is an interesting question why Wisconsin continues to lag the rest of the country, and why the gap is widening, rather than stabilizing or shrinking.
Update, 1pm: Mike Ivey has an examination of recent proposals to spur the Wisconsin economy via regressive tax cuts.
“It is an interesting question …”
Hi Menzie, that’s easy to answer : the polictial decisions in place are the reason for this calamity.
Do I get an A+ ?
Menzie,
It looks like you will not have Scott Walker to kick around much any more. He appears to be the front runner for the presidency for 2016.
Since 2000, WI has a bigger increase in the coincident index than MI, OH, and IL, but worse than IN, MN, and IA. It is difficult to make comparisons over small time periods, as anyone who has been to Wisconsin know, the state is between two and five years behind the rest of the country.
Speaking of surprises:
https://www.box.com/s/4ga8s637k9vpyj16gwdd
https://www.box.com/s/bms6q1wjzvcvsv7ums95
The annual and 3-year change rates of US imports are at the levels of Sept. ’08 and Aug. ’01, decelerating at a rate for imports as a share of GDP and PCE that suggests that the US entered recession in Q4 ’12 to Q1 ’13.
https://www.box.com/s/20a7wvsek6pc2f4dvfv1
However, the post-’08 real GDP and real GDP per capita trend rates are so slow, or negative, that the current methods are probably not sensitive enough to capture in a timely and accurate manner private activity against the margin of error for estimates of inventories, the deflator, and import prices.
This gives the administration some latitude to “manage” the inventory and deflator data to avoid reporting a contraction in real GDP, which in turn gives the bankers via the Fed the cover and legitimacy to claim that QEternity is “working”.
https://www.box.com/s/trekfa6qtic9vuyygyua
But what as been “working” is reflected in the remarkable fact that bank cash assets now constitute the entire growth of net US savings since the onset of the “Great Recession”. Put another way, the US net savings outside the banking sector collapsed from the historical average of 12-13% of GDP to 2% today.
Thus, outside the banks’ assets (now at 100% equivalent of GDP, counting the Fed’s balance sheet), the US economy is now in a net savings deficit to GDP of at least 5-6% and 10-11% below the average since after WW II.
With an economy having a net savings balance outside of the banking sector of just 2% of GDP and total bank assets plus the Fed’s balance sheet at 100% equivalent of GDP, it should be no surprise that real GDP per capita has not grown in 5 years and that the trend of nominal GDP is 2% since ’08. The entire valued-added output of the US economy is now pledged to the claims of the owners of the TBTE (US and foreign) banks.
During the next recession, the US will likely experience for the first time since the Great Depression a net savings deficit outside the banking sector, setting in motion a debt-deflationary contraction and the increasing likelihood of price deflation along the way.
Yet, just as in ’00 and ’07, the US stock market is discounting 3-4% real GDP and 9-10% earnings growth, with the S&P 500 priced 85-90% above the implied index value versus the 6-yr. price to earnings growth (PEG) rate.
Under these conditions, there is about a zero probability that the banks will cease printing themselves free reserves to keep their balance sheets liquid and to permit the US gov’t to run a fiscal deficit of 5-6%+ of GDP to prevent contraction of nominal GDP. Zero.
I get the Fed reports for the NE and they show month to month and year by year employment by sector so it’s relatively easy to see what’s happening. So for example, at best the NE sees smallish declines in manufacturing and services growth – broadly put, because services can be broken down. Construction employment is up now but the main jobs recovery was in services. Government sector employment dropped for a while but has been fairly stable.
Is WI continuing to lose manufacturing jobs? And with this not offset by service jobs increases? That may speak to a failure to understand the drivers of modern employment; chasing manufacturing by lowering worker protections, etc. doesn’t make you competitive on cost. You need to show higher productivity. Is the real estate market there tight enough now to see employment growth?
One thing that stands out about MN is that it has long pushed toward growth in the services sectors. They’ve had some increases in manufacturing as well but my bet is you’d find those largely related to the services growth.
Ricardo: The precedent for saying one won’t have somebody to “kick around” is not particularly auspicious. After all, was it not Richard Nixon who said something of that nature (that is, long before Watergate)?
http://www.youtube.com/watch?v=8Ii3KX1R8l0
“You won’t have Nixon to kick around anymore.”
http://www.youtube.com/watch?v=sh163n1lJ4M
“Well, I am not a crook.”
http://www.youtube.com/watch?v=ZEOGJJ7UKFM
http://www.pbs.org/newshour/character/links/nixon_speech.html
“Therefore, I shall resign the Presidency, effective at noon tomorrow.”
“I regret deeply any injuries that may have been done in the course of the events that led to this decision. I would say only that if some of my Judgments were wrong, and some were wrong, they were made in what I believed at the time to be the best interest of the Nation.”
Sad days for the country, and not just because of Tricky Dick’s misfortune.
Coincidentally, or otherwise, since the early to mid-1970s, the US$ was removed from gold (bankers’ decision); the price of oil soared as a result of OPEC raising prices to adjust for the lower floating fiat US$; the US reached peak crude oil production in absolute and per-capita terms, falling 55% since; real wages peaked for the bottom 90% of households; real incomes for males age 18-34 are lower after higher payroll taxes, debt service, and higher cost of housing as a share of income than they were during Nixon’s administration; US manufacturing employment is down 40% and back to the levels before WW II; total US public and private debt to GDP has risen an order of exponential magnitude to the increase in GDP; and the US economy has become deindustrialized and hyper-financialized with 40-85% of financial wealth held by the top 1-10% of households, and 20-45% of US income received by the same group.
Sad days then, and sad days since for the bottom 90%.
I spent a half hour clicking through the Minny Fed’s site. I was surprised to find they don’t put out the kind of data the Boston Fed does for the region. Or at least it’s not obviously available. The Boston Fed puts out employment by sector, by state and by city with yearly summaries that make it easy to see what has changed.