(It is expanding as long as down is redefined as up)
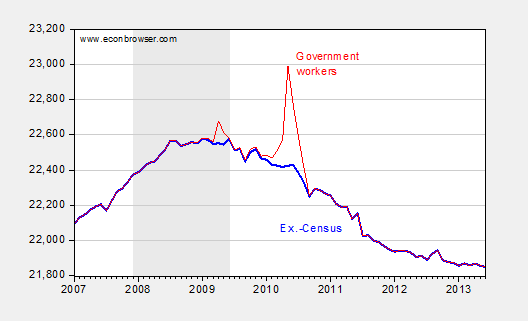
Figure 1: Government employment, all levels, seasonally adjusted (red), and excluding temporary Census workers (blue bold). NBER defined recession dates shaded gray. Source: BLS, June 2013 employment situation release, and author’s calculations.
They don’t care, their kids are in private school. Public schools (where most of this decline happened) are just more government intrusion and waste, from the standpoint of the “productive class.” After all, how much education do you need for a McJob? Besides, if we taught the kids they’d be able to read the graph in your post. They don’t need to do that, Faux News will tell them all they need to know about the out-of-control government spending growth which is taking money out of their pockets so they can’t afford gasoline.
P.S. I’m presuming the left axis is in thousands but I don’t see any indication to that effect.
It *is* shrinking as long as you don’t separate federal from state and local, and exclude federal contractors.
More NSA analysts, fewer teachers.
Air Traffic Controllers = Too Elite To Furlough – Congress (both parties) and the White House overnight rescued air traffic control jobs when their 1% masters complained about the sequester intruding into their lives. Instead, government sacrificed more airport infrastructure jobs than planned so Congress could continue “borrowing” their benefactors’ private jets to go on vacation. Who says government doesn’t work when it wants to?
Can you break this down by Federal and State and other (municipal, etc.)?
Thank you,
Jon
If you start breaking things down, then you have to look specifically at Homeland Security – and the VA as well – because that has grown while other areas have shrunk. (Haven’t you posted about this?) The argument that government has expanded is particularly exasperating in its cynicism: the areas that have expanded are those pushed for by the people complaining that government employment has expanded. Note that the GOP insisted on a massive increase in Homeland Security (Border Patrol et al) as part of the immigration compromise. I believe they insisted on 22k in additional guards to militarize the border. Then they’ll complain that government is getting bigger.
Jonathan I agree the cynicism is almost as astounding as the innumeracy.
Jon Eckhardt The breakdown is available at St Louis Fed FRED, as well as BLS.
http://research.stlouisfed.org/fredgraph.png?g=klu
Gov’t employment has only recently begun to “catch down” to private employment after exceeding the comparative growth of private employment for over 30 years from the 1960s.
http://research.stlouisfed.org/fredgraph.png?g=klv
http://research.stlouisfed.org/fredgraph.png?g=klw
Full-time private and public employment per capita is at the level of 30-35 years ago.
http://research.stlouisfed.org/fredgraph.png?g=klx
Private employment per capita is at the levels of 20-25 years ago.
http://research.stlouisfed.org/fredgraph.png?g=kly
Real private wages per capita are at the level of 1998.
http://research.stlouisfed.org/fredgraph.png?g=klz
http://research.stlouisfed.org/fredgraph.png?g=klA
The real median house price is again exceeding real wages per capita in terms of price and annual change rate, i.e., echo bubble.
The US economy no longer creates net new full-time, private employment per capita, and now even public employment per capita is declining.
http://research.stlouisfed.org/fredgraph.png?g=klB
Thus, it’s not a coincidence that real GDP per capita has not grown in 5-7 years.
Structural drag effects from high energy, payroll tax, and medical insurance costs combined with unprecedented public and private debt to GDP, offshoring of production and employment, and Boomer demographics preclude growth of real GDP per capita indefinitely hereafter.
Asset bubbles encouraged by bank reserve printing and leveraged rentier speculation do not constitute growth of “wealth” but rather are evidence of gross wealth and income concentration to the top 0.1-1% of households and resulting missallocation of savings, credit, and scarce resources, imposing ever larger compounding interest claims on wages, profits, and gov’t receipts in perpetuity.
Jon Eckhardt,
This may help you understand where the declines in government personnel are being felt the most.
From the Office of Personnel Management
2008
Executive Branch 2,692k
Uniform Military personnel 1,450k
Legislative Branch 64k
Total 4,206
2011
Executive Branch 2,756k
Uniform Military personnel 1,583k
Legislative Branch 64k
Total 4,403
% Increase
Executive Branch 2.4%
Uniform Military personnel 9.2%
Legislative Branch 0.0%
Total 4.7%
It is interesting that even with all the claims by the Obama administration the uniform military is higher than any time during the Bush administration and higher than any time since 1994 with the exception of 2009 and 2010.
The bottom line is that the states have been reducing government employment and, without doing the study, my conjecture is that those states with the greatest government employment decline are probably the ones in economic recovery. I will leave it to others to either refute or confirm my conjecture.
I like CR’s graphs: http://www.calculatedriskblog.com/2013/07/public-and-private-sector-payroll-jobs.html
I’m not sure what the point of this is other than to build a strawman. “See the other side is so wrong because they can’t even read graphs!” The problem with this tactic is that in the end you end up with no argument and a poorly labeled graph.
Texas has seen its total number of state and local employees increase during the recovery.
Steve
This problem is a Washington problem, and specifically, a GOP House problem.
State (50 little Hoovers) and local austerity is a fact of life in economic downturns. The big difference this time is the failure of the feds to blunt that with sufficient support for maintaining local spending and with trend increases in federal employment.
Ricardo Increases in the number of uniformed services don’t just happen overnight. Those increases were requested by the Administration and authorized by Congress during the Bush years. It takes many years to incorporate higher troop levels into the Future Years Defense Plan, identify which military occupational specialties will see increases, adjust Tables of Organization & Equipment, establish and fund training, etc. Back in the mid-2000s the increase in troop levels was accepted on both sides of the political aisle. And in case you hadn’t noticed, last week the Army announced that it was planning on a crash reduction:
http://www.defense.gov/releases/release.aspx?releaseid=16114
The Army will be reducing its troop strength by 80,000 soldiers and will go from 45 brigades to 33 brigades.
Not included probably is the shift to consultants and charter schools etc. Other examples would be private trash collection and so forth. All the contract type employment which offers great efficiency if done right. So even including these, employment probably has fallen but that is not necessarily a bad thing if inefficient employees are being let go. Better in a social welfare sense to pay them unemployment or SSI and allow them to consume leisure than to have them working at dead end useless jobs.
Looking back from the future for Slug.
The year is 2025 and President Obama has just completed his State of the Union address after being elected for his unprecedented 5th term.
The economy has not been in a recession since 2009 as the definition is changed every year to accomodate various undefined fiscaL shocks.
GDP is up to 2.5% as government spending tops 90% of GDP.
Unemployment just hit 7% as the workforce participation rate was adjusted up to 10%.
The Federal Reserves has just announced QE 18 and has submitted a new plan to end QE just as soon as the unemplyment rate hits 6.5% or the participation rate hits 0% which ever comes first.
The media is full of praise for President Obama as he just completed the shortest State of the Union Address of all time. The address is now required recitation by all public school students each morning immediately before school starts.
QUOTE:“It is all Bush’s fault.”
LOL NAILED IT RICARDO
Bill McBride weighs in:
http://www.calculatedriskblog.com/2013/07/public-and-private-sector-payroll-jobs.html
Menzie Chinn,
Understand the argument and graph accordingly. If the criticism is against the president growing government employment, then you need to only look at federal. As such, via FRED:
100,000 * (CES9091100001/POP) = # of federal workers per hundred thousand U.S. persons.
While federal employment per 100k capita is currently falling, it’s still above when Obama took office by about 6. That’s roughly a growth in the federal work force of 18.5k federal workers.
More related to the criticism is growth in government bureaucracy and the army of bureaucrats. So if you can strip out military, postal, and temp census workers (which I don’t have time to do myself at the moment), you’d get an even more accurate graph to either validate or contradict the argument.
So, in the future, more mental and elbow grease, please.
Ricardo,
It would be great if you would use some facts for a change. For example, here are the state rankings for growth in state government employment January 2008, to April 2012: (Labor Dept. seasonally adjusted data)
Wyoming 13.07%
Colorado 11.92%
Utah 7.19%
Arkansas 6.52%
Oregon 6.52%
West Virginia 6.25%
South Dakota 5.68%
Massachusetts 5.50%
North Dakota 5.13%
Maryland 4.33%
Michigan 4.26%
Oklahoma 3.82%
Nebraska 3.23%
Montana 2.39%
Alaska 2.37%
Minnesota 2.16%
Tennessee 1.93%
New York 1.50%
Virginia 1.43%
Hawaii 1.21%
Texas 0.06%
The majority of states increasing state government employees (13) are GOP states (as in Romney states).
And as for local government employees (look at the second percentage):
Wyoming 13.07% 7.51%
Alaska 2.37% 6.77%
Utah 7.19% 6.72%
West Virginia 6.25% 4.92%
Louisiana -8.14% 4.79%
Arkansas 6.52% 4.36%
Oklahoma 3.82% 4.29%
Tennessee 1.93% 4.06%
Delaware -1.24% 3.59%
North Dakota 5.13% 3.24%
Nebraska 3.23% 2.41%
South Dakota 5.68% 1.92%
Virginia 1.43% 1.62%
Kentucky -2.16% 1.24%
Hawaii 1.21% 1.10%
Mississippi -1.01% 0.75%
Texas 0.06% 0.61%
Colorado 11.92% 0.58%
Idaho -6.14% 0.53%
Iowa -5.30% 0.30%
Here of all the states that increased local government employment from January 2008 to April 2012 all but 4 of 20 states are GOP states.
One might be able to claim that these states started with such low levels of government workers that they were able to hire loads of them, but doesn’t that go against the whole small government “thang”? Why would Wyoming be the top state in both categories do they lack commitment to real conservatism; are they RINOs?
J.D.: Why would one ever want to strip out state and local? I believe I heard lots of criticisms by various individuals in high office in Wisconsin that there were too many state employees (and also too many local). So, not certain where you’re going with this. Maybe you want to focus on Federal, but in this instance, don’t. (From a macroeconomic standpoint, I don’t see the rationale either — please elaborate).
On a separate matter, why should I strip out defense? There are bureaucrats there too.
Ricardo: Looks like you have a future in science fiction. Beats the fiction you’ve been writing up to now. Take up the new challenge. Please!
You don’t really expect Ricardo to depend on facts, do you? They are so inconvenient. Ideology trumps facts any day. Just look at how the communists under Stalin believed in Lysenkoin the face of scientific evidence.
Ricardo QUOTE:”It is all Bush’s fault.”
What part of “the increase in troop levels was accepted on both sides of the political aisle” did you not understand?
Dr. Morbius
The majority of states increasing state government employees (13) are GOP states
Perhaps the fact that red states, in general, have more rapid growth than blue states explains it. Or perhaps some “red states” have growth inhibiting blue legislatures. All Ricardo is saying is that Progressives lurch from one short run “fix” to another and never seem to be able to follow through on long term commitments. When was the last time Progressives proposed a long run solution that didn’t fall apart after implementation? (Obamacare as the most recent example.)
Texas, Red States Beat Blue States On Jobs, Growth
By JOHN MERLINE, INVESTOR’S BUSINESS DAILY
Posted 05/23/2013 08:02 AM ET
Perhaps greater proportional federal transfers to red states explain it, since these are effectively blue-state to red-state transfers. Red-staters are so cute they think they wouldn’t be Spain if they were in the EU instead of the U.S.
Dr. Morbius,
Thanks for the information.
If your base years is 2010 (the year of the Tea Party Revolution) the numbers are different. The top four states cutting state employmnet are LA, FLA, KS, and AL. Florida is dramatic cutting 8.1%. Before the cuts the unemployment rate in Florida was higher than the national average. Now it is below the national average.
You will notice in my earlier post I stated that I did not know what the answer would be if the analysis was done. The reason I stated this is because in periods of prosperity state employment in positive services does increase. There is an increase in teachers, law enforcement, and other protective services. That is a good thing. But in most states there is a bloated bureaucracy so reductions in employment are a good thing. Florida for example has not had siginificant cuts in teachers or law enforcement, but has in administrative employment.
Also note that the most Fascist states are seeing siginifcant declines in tax revenue. That is the forced austerity of consequence requiring the cut in state employment.
Dr, Morbius,
I would suggest that you are overstating the dominance of red states over blue states in those with growing state govt employment. If one IDs a state as one or the other by having both senators, a majority of House reps, the governor and both houses of the legislature controlled by one party or the other, I see it as coming down to 6 red vs 4 blue, which is not overwhelming. By my count (possibly off by one or two), the reds are Wyoming, Utah, South Dakota, Oklahoma, Nebraska, and Texas, while the blues are Massachusetts, Maryland, Minnesota, and Hawaii.
Barkley
The top 50 states for doing business as ranked by CNBC using 51 metrics, the National Association of Manufacturers and the Council for Competitiveness.
1.South Dakota (Red)
2.Texas (Red)
4.Nebraska (Red)
5.Utah (Red)
9.Wyoming (Red)
25.Oklahoma(Red)
15.Minnesota(Blue)
16.Massachusetts(Blue)
40.Maryland(Blue)
50.Hawaii(Blue)
http://www.cnbc.com/id/100824779
The issue the “red” states never can address is that they have lower incomes & receive more in “redistribution” money aimed at alleviating poverty. They also are behind on nearly all other measures, from infant mortality and obesity to educational achievement to percentage of children without medical coverage, etc.
I’ve been hearing about the model for growth – which is now “red state model”, I suppose – since I was a kid. In the same period of time, entire countries have lifted themselves out of poverty.
Jonathan
The issue the “red” states never can address is that they have lower incomes & receive more in “redistribution” money aimed at alleviating poverty.
Your bias is showing. Inspection of the facts suggests the blue states, with their big brained Jonathons, are getting too much from Uncle Sam, while the Forrest Gump red states are getting too little. According to your logic, the top 10 states below should be all blue and the bottom 10 all red.
Here are the top 10 and bottom 10 states in terms of per capita receipts of direct federal payments to individuals and grants (i.e. block grants). The other categories that are not part of the ranking are Retirement and Disability, Procurement, Salaries and wages.
Top 10 based on 2010 data:
Dist. of Columbia (Blue)
Connecticut (Blue)
North Dakota (Red)
Massachusetts (Blue)
Alaska (Red)
New York (Blue)
Louisiana (Red)
Maryland (Blue)
Rhode Island (Blue)
South Dakota (Red)
Bottom 10:
Kansas (Red)
South Carolina (Red)
Utah (Red)
Texas (Red)
Georgia (Red)
Idaho (Red)
New Hampshire (Blue)
Colorado (Purple)
Virginia (Purple)
Nevada (Purple)
data –
http://www.census.gov/prod/2011pubs/cffr-10.pdf
Red state blue state based on last 4 presidential elections – https://en.wikipedia.org/wiki/File:Red_state,_blue_state.svg
In the same period of time, entire countries have lifted themselves out of poverty.
And entire Blue states like California, Michigan, Illinois, etc are nearly bankrupt.
Jonathon I thought you referred to yourself as an “Independent”? Obviously I was wrong.
Prosperity breeds liberalism which destroys prosperity. This is why california, Illinois, Detroit, Baltimore, Birmingham, and other liberal utopias rise and fall.
What has happened to employment in government service and regulation through employment of people working for subcontractors (such as SAIC and Booz-Allen-Hamilton?)
This development probably gives government agencies flexibility, but we need to understand this change in order to understand the structure of employment.
edit- According to your logic, the top 10 states should all be red and the bottom 10 all blue.
tj I think you are misinterpreting the Census data. The blue states are indeed getting the most federal dollars per capita; but that does not mean income is being redistributed from red states to blue states. Quite the contrary. Blue states get more dollars per capita because they generate the most tax revenue per capita. But if you look at the ratio of dollars received versus dollars paid in taxes (i.e., a measure of redistribution), then it’s pretty clear that the red states are moochers. The top 10 moochers are (according to the non-partisan Tax Foundation):
1. New Mexico
2. Mississippi
3. Alaska
4. Louisiana
5. West Virginia
6. North Dakota
7. Alabama
8. South Dakota
9. Virginia
10. Kentucky
The top 10 states that give more than they receive are:
1. New Jersey
2. Nevada
3. Connecticut
4. New Hampshire
5. Minnesota
6. Illinois
7. Delaware
8. California
9. New York
10. Colorado
http://www.slate.com/blogs/the_reckoning/2012/10/25/blue_state_red_face_guess_who_benefits_more_from_your_taxes.html
“Why would one ever want to strip out state and local?” Because they aren’t hired under federal authority. You can’t wish away the fact that there’s a difference between who hires state & local vis-à-vis federal employees.
“I believe I heard lots of criticisms by various individuals in high office in Wisconsin that there were too many state employees (and also too many local).” Which is criticism of state governments, not the President. This isn’t macro. You don’t get aggregate government employees simply because you want to.
“So, not certain where you’re going with this.” This is the most disappointing thing you’ve said, since I spelled that out in my first post: when a person claims that the president has grown govt, it’s a claim about the size of the FEDERAL govt, and clearly NOT both federal and state.
If you believe they meant what you assume they did, then the burden of persuasion falls to you to prove they actual meant what you think you heard against what is manifestly obvious to anyone who’s taken Poli. Sci. 101. The federal government and the states are not the same entities.
“Maybe you want to focus on Federal, but in this instance, don’t. (From a macroeconomic standpoint, I don’t see the rationale either — please elaborate).” You don’t see the rationale because you don’t understand their argument. See above.
“On a separate matter, why should I strip out defense? There are bureaucrats there too.” By military, I meant actual service members, not the military bureaucracy around them. Also, the point in stripping them out was to see it isn’t what you might call “constitutional staples” where the growth has occurred, but in areas regarding regulation of the lives of private citizens.