Newly developed indicators suggest eroding international competitiveness.
The standard measure of competitiveness is the real effective exchange rate,
r = e + p – p*
Where e is the log nominal exchange rate (in foreign currency units per home currency), and p is the price level (foreign denoted by *), measured by the price of output.
This bilateral measure, examined in several previous posts (e.g., [1]), makes sense if domestic factors of production are solely used to goods that are exported. However, intermediate goods make an increasing share of world trade (net trade is 70-75% of gross goods trade, according to Johnson).
Bems and Johnson (2012) argue that one should examine the relative price of the output that is actually traded – that is the value added incorporated by a given country. An alternative view, propounded by Bayoumi, Saito and Turunen (2013), holds that trade in goods is relevant, and so one is interested in the price of the final good that is traded, taking into cost savings that arise from offshoring. In both cases, it turns out that taking into account the trade in intermediate goods is important.
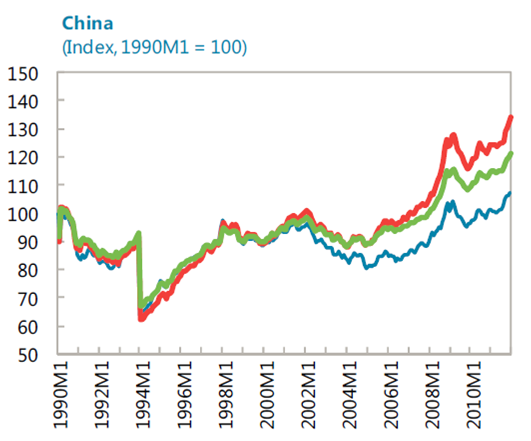
Figure 1: Real effective exchange rates for China, standard IMF (blue), approximation to Bems-Johnson (red), and trade in goods (green), defined so up is an appreciation. Not exact formulation as weights do not vary by year, as in Bems-Johnson. Source: Bayoumi, Saito, Turunen (2013).
The trade in tasks approach yields roughly a 45% appreciation of the CNY by sample end, as opposed to about 22% by the conventional approach (caveat: “eyeballed” from the graph). The trade in goods approach, taking into account the decrease in prices of imported inputs, shows a lower amount of appreciation versus the trade is tasks approach – about 33%.
Which one is a more relevant measure? I don’t think there is a clear cut answer. If one is concerned about the amount of valued added output being imported from a given country, then the Bems-Johnson approach appears more relevant. However, if for some reason one were particularly interested in the goods that happened to have the final stage of production take place in a given country, then the “trade in goods” approach takes on more prominence.
It happens that according to both measures, the yuan has appreciated. It remains unclear whether that appreciation is sufficient to effect global rebalancing of aggregate demand toward the advanced economies, despite the fact the degree of appreciation is more pronounced than conveyed by the conventional real effective exchange rate indicator. That being said, the reduction in the Chinese trade balance is suggestive [1].
I’ve been wondering about how these trade models account for growing internal wealth and consumption. That could get complicated if the economy is relatively closed, either due to explicit trade restrictions, the kind of implicit restrictions you find in many countries (like Japan, where the legal requirements act as trade restrictions), etc. Is there a perfect exchange assumption in which rise in your McDonald’s index or whatever translates internally? Or is there a more complicated modeling?
In other words, if China has reached a point where it can consume more then it can be less competitive internationally on a pure cost basis as it rebalances toward fulfilling its domestic requirements. I suppose we’d see that in more value-added – meaning Bems and Johnson – as markers of increasing sophistication, increasing wealth, etc.
This analysis fits the broader picture of China that we see on an anecdotal basis.
A broader analysis of China’s economic prospects would be welcome.
In the BST paper the three measures for China and the US all track together fairly closely for about halfway through the series and then begin to diverge. For Japan the divergence occurs earlier. But the interesting case is Germany, which shows a relatively fixed gap from the beginning to the end of the time series. I expected a more explicit discussion of these differences.
Not a new result. Fahle, Thomas, and Marquez, the gold standard in this literature, already showed the chained of Penn shows a depreciation for the US relative to CPI. Their paper is not cited in either of the references — these people have not even been reading Econbrowser!
Thorstein Veblen: The Marquez etc. paper is a price level measure, at final goods prices. It has the advantage of being a price level. The Bems-Johnson measure is an index which deals with value added. They address different issues in the arena of exchange rate measurement.
Menzie — You do a real service with this blog and I’m a huge fan of your work.
However, the Marquez et al. paper uses the price level of GDP, from the PWT. The Bems-Johnson measure uses the price level of GDP, from the World Bank. I’ll confess I’m not an expert on what the difference between these two measures is, but the end result for the US looks similar and Marquez et al. are not cited.
*OK, I see the difference. The PWT should include import prices, while the GDP deflator should include export prices instead.
And, it looks like the ‘Chained of Penn’ from Marquez shows a bit more of a dollar depreciation than BJ. Still, I don’t see the results operating in a completely different literature. I suspect BJ didn’t see the Marquez et al. paper, which is certainly forgivable. Let’s see if they get cited in the final draft.
China has been a significant oil importer, and that dependency is growing. The country historically was self-sufficient in coal, but has growing dependency on coal imports, domestic production is likely to peak soon. The beginnings of increased dependence on gas imports (still a trivial fraction of national energy inputs) can be seen. It remains to be seen whether extremely aggressive nuclear and renewable growth can reverse these import trends. If it cannot, China’s rapid growth is doomed, given the relatively small size of the world energy trade with respect to China’s growth path.
In assessing the Chinese economy, one must always factor in bad data. My rule of thumb is to provide for a 20% margin of error. While one might thing trade, counted on both sides of the transaction, would be fairly difficult to fudge, it does happen.
[http://www.bloomberg.com/news/2013-03-26/hong-kong-trade-slides-with-imports-contradicting-china-data.html]
I’m reminded of a grad student, doing a dissertation on wine trade, who asked for my help with incomprehensible data. It seems Hong Kong was exporting more wine from China than China imported from the entire world.
Rice wine? No, grape.
Bulk shipments? No, 750m bottles.
Ah, bad data!