Messages from the external and government sectors
The second release of the 2013Q2 NIPA figures [0] suggests faster (2.5 ppts. versus the initially estimated 1.7 ppts.), albeit still modest growth. However, would be a mistake to conclude that fiscal drag is unimportant.
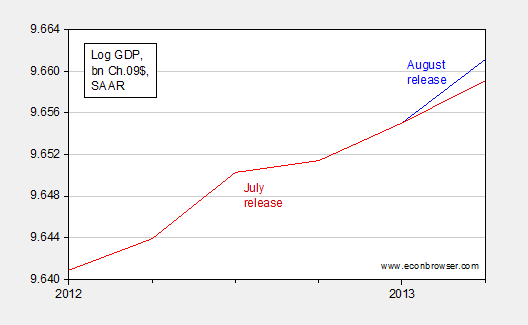
Figure 1: Log GDP, in bn. Ch.2009$, SAAR, July release (red), August release (blue). Source: BEA.
Now consider the fact that in fact the government spending (all levels) on goods and services declined even more than first estimated.
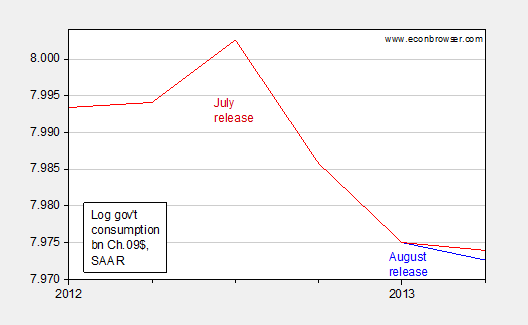
Figure 2: Log government consumption, in bn. Ch.2009$, SAAR, July release (red), August release (blue). Source: BEA.
With these revised figures, all levels of government continue to subtract from overall growth (in a mechanical sense) – although not as much in the two previous quarters. This is notable because the previous reading for 2013Q2 had indicated state and local spending had turned around to contribute to, rather than deduct from, growth.
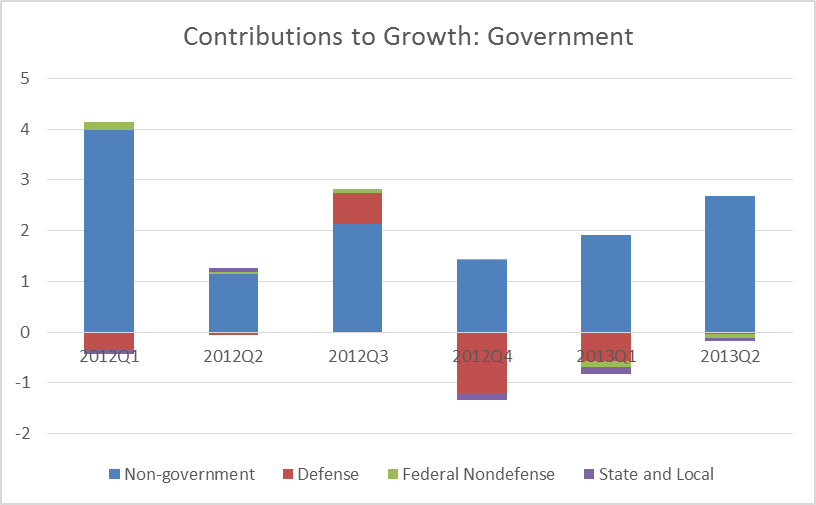
Figure 3: Contributions to real GDP growth, in percentage points, SAAR, of non-government sector (blue), defense (red), Federal nondefense (green), and state and local (purple). Source: BEA.
The external sector shifted from a contribution -0.81 ppts to zero, thus accounting (once again in a mechanical sense) for the entire increase in estimated growth.
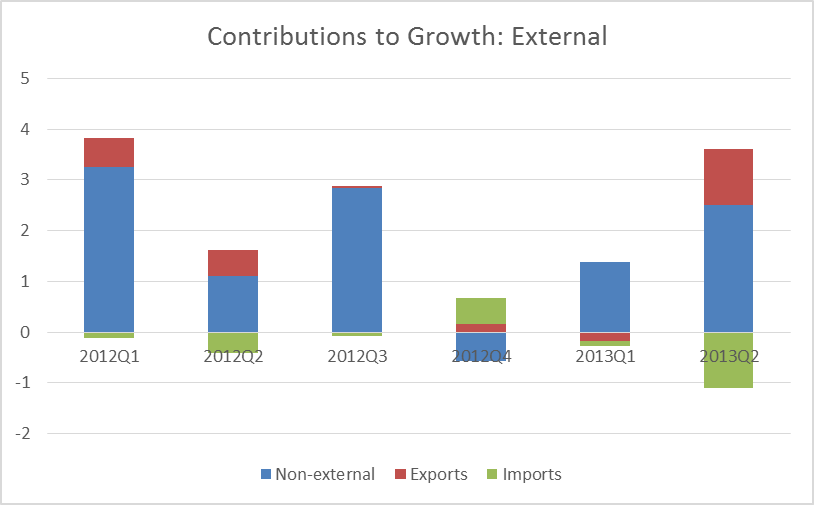
Figure 4: Contributions to real GDP growth, in percentage points, SAAR, of non-government sector (blue), defense (red), Federal nondefense (green), and state and local (purple). Source: BEA.
The revisions in exports and imports are shown in Figures 5 and 6.
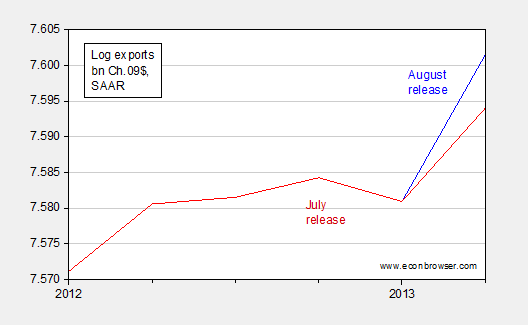
Figure 5: Log exports of goods and services, in bn. Ch.2009$, SAAR, July release (red), August release (blue). Source: BEA.
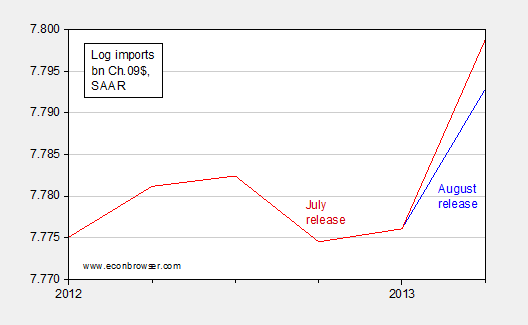
Figure 6: Log imports of goods and services, in bn. Ch.2009$, SAAR, July release (red), August release (blue). Source: BEA.
Lower imports contribute to current quarter growth, in an accounting sense. However, they can also signal slower GDP growth going forward, insofar as the marginal propensity to import is positive. One might also look to cues from certain types of imports. Capital goods are sensitive to expectations of future demand, so the fact that capital goods imports are flat is a bit troubling.
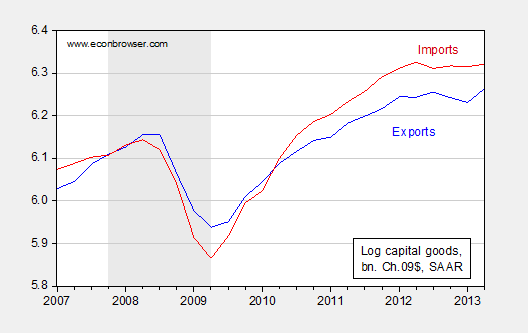
Figure 7: Log capital goods exports (blue), and imports (red), in bn. Ch.2009$, SAAR. NBER recession dates shaded gray. Source: BEA, and NBER.
Growth in capital goods exports (blue line) is encouraging, if only because of the low expectations for rest-of-world demand.
Returning to the government sector, it’s important to recall government spending on goods and services doesn’t summarize the entire effect of spending cuts. Transfers have also been reduced. Figure 8 illustrates the drag coming from a reduction in government expenditures (spending, transfers) relative to GDP.
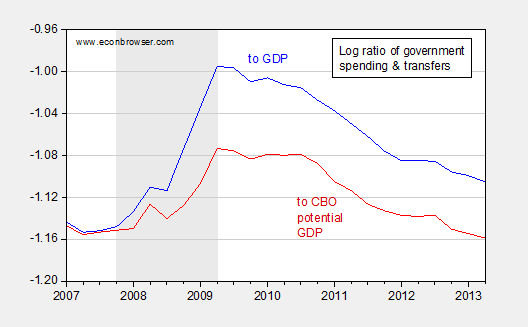
Figure 8: Log government total spending to GDP ratio (blue), and to potential GDP (red). Total spending measured as sum of real government consumption and nominal transfers deflated by personal consumption deflator. Potential GDP is February 2013 CBO measure in Ch.2005$, adjusted by the ratio of 2011 GDP measured in 2005 and 2009 units. NBER defined recession dates shaded gray. Source: BEA, second release, CBO Budget and Economic Outlook, NBER, and author’s calculations.
In sum, it’s a good thing that growth was revised up, but it could be yet faster with a sensible fiscal policy.
Is it fair to say that Obama is pursuing a stealth “starve the beast” policy or are we supposed to blame this all on the GOP?
Menzie, has there ever been a period when gov spending shrunk this fast???
Thanks
raskolnikov: Over the past 45 years, the blue series has taken on more negative changes than in the recent episode. However, the shift from growth to shrinkage is of record magnitude (over this period). It is likely with a longer sample (including post-WWII demobilization) one would get larger downshifts.
You also have to keep in mind that most of the major sequester cuts did not commence until 6 July, just outside of the 2013Q2 window. Most of 2013Q1 and 2013Q2 federal spending was set at the level mandated by continuing resolution glide paths. On the other hand, the 2013Q3 sequester effects won’t be quite as bad as originally feared because Congress quietly and effectively restored a lot of the funding…although that’s not what the Tea Party wingnuts will be telling their constituents during those summer recess townhalls. For example, Congress was out of town, which allowed OMB to make use of an obscure provision in the law that allows OMB to reprogram dollars across accounts as long as Congress doesn’t issue a “stop” order within five calendar days. There was a lot of that. And of course there were “unobligated” and “deobligated” prior year authorizations that were tapped into.
The big killer will be the debt ceiling issue in mid-October.
Professor Chinn,
As a learning point, if you (as an expert) were to estimate a curve fit of actual data for real GDP for the second quarter, what curve fit mean number would you calculate? I am not able to compute a number larger than $15,653 billion 2009 chained dollars, compared to the recent estimate of $15,681. The $15,653 amount is an increase at SAAR of about 1.8% compared to the recent estimate of 2.5%. The 2.5% number seems quite a bit better than the recent trend.
AS: Not sure I understand your question. Are you asking what trend can fit the data? If you run a regression of log GDP on constant and trend over 2011Q4-2013Q1, you’ll under-predict 2013Q2 GDP.
Professor Chinn,
I used a Box-Jenkins models to estimate real GDP.
Should say various Box-Jenkins models.
Huge miss on Q1 numbers. How can the government post a 1.7% GDP growth number, and then revise it to 2.5%? Dreadful and completely unacceptable.
2slugs: Do you feel like taking an off-the-cuff swag at an approximate magnitude of the sequester rollback? Is this mostly DOD or widespread? Does this mean that the remaining sequester actually is targeted on low-income constituencies? Is there any decent reportage on this? Is this something somebody like Stan CG&G might be interested in expanding on?
Does it strike anyone else as strange that as the government reduces spending that there is more evidence of recovery?
Menzie wrote: In sum, it’s a good thing that growth was revised up, but it could be yet faster with a sensible fiscal policy.
Could it be that the sensible fiscal policy Menzie is hinting at would be a greater reduction in government spending and fewer government wedges on the productive economy?
Mitch Daniels, anything but a Progressive spending advocate, has done an interesting analysis of Presidential spending.
Annualized Growth In Federal Spending (minus bailouts) 2011
1.5% Reagan
1.6% Clinton
2.8% Nixon
3.0% Carter
3.1% Bush 41
4.4% Bush 43
5.5% Obama
5.9% LBJ
Under Obama we will for the first time since the Korean War see two consecutive years of spending cuts. And the economy is stronger than when Obama was spending or imaginary shovel ready jobs.
Annualized Growth In Federal Spending (minus bailouts) 2012
1.6% Reagan
1.6% Clinton
2.3% Nixon
2.9% Obama
2.9% Carter
3.2% Bush 41
4.5% Bush 43
6.0% LBJ
Could it actually be that lower government spending produces recovery? What a novel thought!
Frank Hollenbeck, Professor at the International University of Geneva, writes that there are three types of austerity.
“There is the Keynesian-Krugman-Robert Reich form which promotes more government spending and higher taxes. There is the Angela Merkel form of less government spending and higher taxes, and there is the Austrian form of less spending and lower taxes. Of the three forms of austerity, only the third increases the size of the private sector relative to the public sector, frees up resources for private investment, and has actual evidence of success in boosting growth.”[emphasis added]