In a previous post, I compared economic outcomes in two states that implemented contrasting fiscal policies: California, which surged ahead while raising taxes and cutting spending, and Wisconsin, which lagged far behind as it slashed spending on education, and cut taxes. Latest estimates of current economic activity, and forecasted economic activity six months out, indicate continued lagging performance for Wisconsin.
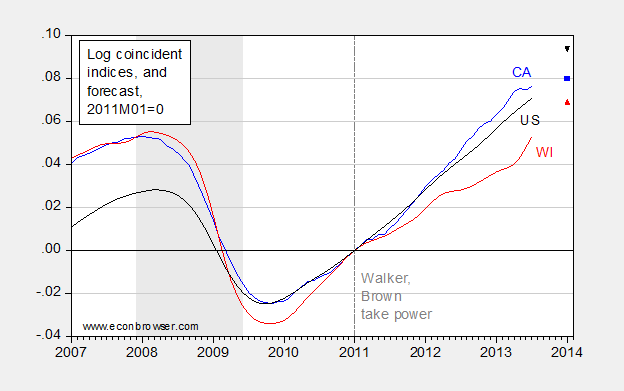
Figure 1: Log coincident indices, normalized to 2011M01=0, for Wisconsin (red), California (blue), and US (black), and forecasts for January 2014 coincident indices, using leading indices from August 29 release (WI = red triangle, CA = blue square, US = black inverted triangle). NBER national recession dates shaded gray. Source: Philadelphia Fed, NBER, author’s calculations.
If it is not obvious from the graph, note the persistent change in slope (flattening) for Wisconsin starting in January 2011. No such change is obvious in the other two series.
At the pace forecasted for the next six months, it will take about 3.5 years for Wisconsin to catch up with the US overall (a year to catch up with California). And if you were curious, never with Minnesota….
Additional Notes: These coincident indices are intended to summarize economic activity. Detailed information regarding some of the characteristics of these indices is here. Coincident index correlation with state GDP exceeds 0.85 for Wisconsin and California, and is between 0.70 and 0.85 for Minnesota (1980-2011). I calculated the correlation between four quarter changes in US GDP and the US coincident index at 0.85.
Update, 9/9, 1:15PM Pacific: Reader Drew asks how stupid I am to compare WI to CA. Well, compare WI to MN, and see what you think. To help him out, in case he doesn’t know how to download data from “the internets”, I will provide a graph for his edification.
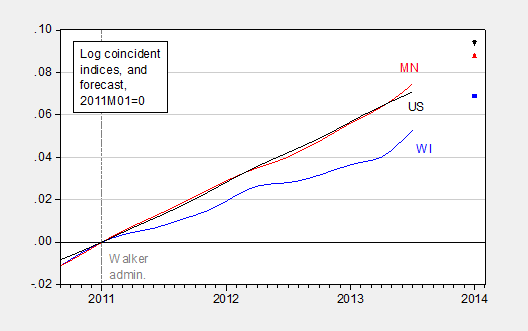
Figure 2: Log coincident indices, normalized to 2011M01=0, for Wisconsin (blue), Minnesota (red), and US (black), and forecasts for January 2014 coincident indices, using leading indices from August 29 release (MN = red triangle, WI = blue square, US = black inverted triangle). NBER national recession dates shaded gray. Source: Philadelphia Fed, NBER, author’s calculations.
Professor Chinn,
Can California’s and Wisconsin’s economies be reasonably compared? As an expert can you give us some indicators of economic diversity for each state and why policy actions in economies like CA and WI would be expected to provide the same results? The CA state product is about $1.9 million, million, while WI’s state product is about $249,000 million, according to http://state-facts.findthedata.org/compare/2-19/California-vs-Wisconsin. CA is #1 in state product and WI is #21.
Of course they can’t AS. Menzie is just trolling us for the lulz. You can’t even compare MN to WI, as MN has 19 fortune 500 companies, while all of Wisconsin has… 9.
But his brilliant economic analsys suggests if Wisconsin just raises taxes and gives raises to administrators in the education system, that the economy of WI will explode.
AS: All states are different. But you might wish to compare against Minnesota (a comparison Governor Walker has made himself); a time series plot of the relative performance is here (not too auspicious, if I might say). And as I mentioned, at the forecasted pace for the next 6 months, Wisconsin will catch up with Minnesota at t=infinity.
Anonymous: Oooh, WI and MN are sooo totally different they are incomparable. WI state domestic product in 2012 was 225 bn Ch05$, dwarfed(!) by MN state domestic product of…253 bn. Ch05$. [1] WI nonfarm payroll employment is 2814 thousands, while MN is 2775.4 thousands as of July 2013.[2] You cite Fortune 500 corporations. Why? I thought small businesses were the engines of employment growth.
I would say that CA’s tech and entertainment industries (not impacted as much by recession) make it a unique case. Oil & other resource extraction businesses are similar, so that when comparing states that are heavily involved in those industries, it is hard to determine what effects are due to policies, and what are due to those specific industries.
The comments to this blog represent cognitive dissonance at its finest. If you are running an experiment in the background, kudos on your method of data collection.
In just this short selection, we learn that policy doesn’t matter (unless of course you can claim victory) and that you can’t compare states (unless of course the state you favor looks better).
All this proves that humans are kind of like bugs: when you try to squash them, they wriggle around to get free. Try to show that GOP policies which promise huge things don’t deliver and they wriggle around so, well, you can’t really compare and, oh, there’s some other reason.
I go all the way back to Cain: when asked by God what he did, he evaded the question. He couldn’t say, “I whacked my brother. He’s lying there because of what I did.” And of course Cain learned that from his mom and dad: when asked what he did, Adam blames Eve and Eve blames the serpent. If the idea embedded in the very beginnings of the Bible are to become wise, then we fail the very first lesson because we can’t admit our mistakes and can’t admit what we’ve done. And we certainly can’t accept that our ideas are wrong or not particularly powerful.
Anonymous Wisconsin enjoys a lot of spillover economic activity from the very wealthy Lake County, Illinois side of the border. Think of rich Lake County residents going to Lake Geneva, WI for the weekend the way rich New Yorkers go to the Hamptons. For those not familiar with Illinois geography, Lake County is immediately north of Chicago. That probably counts for the equivalent of a few Fortune 500 companies. Minnesota gets spillover activity from…the Dakotas.
2slugbaits
Minnesota has Mall of America, which seems to be completely populated with out of state residents on Weekends – No & SoDak, Ia, Wi, Il
Changes to Tax policy would have an effect on the Lake Geneva/Dells and Hayward economies.
How stupid must menzie think his readers, and how disingenuous to lead with a state like CA with so many other variables at work?
How’s IL doing?
Don’t ask.
Drew: Thank you for your insightful remarks. For your benefit, I have added a new figure to the post.
Oh, and IL — well it’s 0.7 ppts above WI; the leading indicators indicate the gap will widen over the next six months. You really should learn how to use “the internets”; the links to the database were provided in the original post….
Menzie
What is the typical lag for tax policy decisions to show in the data?
There are 2 current taxes in MN that will have an effect on future growth – Warehouse tax (Red Wing is delaying a $20MM expansion) and the 2% increase in state income taxes on $150M Single/$250M Married.
JohnnyU: Well, if I put on my Chicago-Minnesota Rat-X hat on, I’d say “no lag”!
Well, if you wish to compare WI with other states, simply look at the aggregate for all US states (the black line). The combined US actually outperforms Walker’s austerity in WI. That further verifies his point, and gets around some of the idiosyncrasies of MN or CA etc.
I am not sure how much time you want to spend on this, but why not try a cross-sectional time-series regression model, with dummy variables for Wisconsin after Walker and CA after Brown? Maybe add other austerian Gov’s, such as Christie in NJ.
Menzie
As long as you apply your expectations consistently.
I would assume MN will see the impact of the current fiscal policies over then next 12-18 months
“Minnesota gets spillover activity from…the Dakotas”
You mean like the Bakken?? Spill away!
:^)