Newly exploited tight oil formations account for more than 100% of the increase in U.S. field production of crude oil since 2005. But that doesn’t mean it’s easy to make money getting oil out of the ground this way.
|
The Wall Street Journal reported last week:
Royal Dutch Shell (RDSA) plans to sell its stake in the Eagle Ford Shale in South Texas, following a $2 billion write-down of North American assets that the company announced in August.
Shell’s sale of leases on 106,000 acres in the oil-and-gas-rich region illustrates the struggles major oil companies have had in places where smaller energy firms have thrived.
Shell said the Eagle Ford holdings didn’t meet the company’s targets for size and profitability.
An August analysis by Reuters of the company’s write-downs cautioned:
However, writedowns by Shell and some other majors are a sign they came to the shale boom late in the day, overpaying for lower-quality and less well-explored assets– not that the shale revolution is stuttering.
The most successful company in the Eagle Ford has been EOG, which produced 94,000 barrels a day from the Eagle Ford in 2012. That’s almost a quarter of the 399,000 b/d that the Texas Railroad Commission reported was produced by all the Eagle Ford producers put together in 2012, and a 150% increase over EOG’s 2011 Eagle Ford production. But it’s interesting that even though EOG reported an average price received around $98/barrel in 2012 compared to $93 in 2011, the company’s operating income for the year was down 30% from 2011. Gains in revenue were outweighed by increases in marketing and depletion charges.
Conoco Phillips (COP) produced 89,000 b/d from the Eagle Ford in 2012:Q4, almost as much as EOG, and a 144% increase over what the company produced from Eagle Ford in 2011. Although there are lots of other factors besides Eagle Ford that matter for COP’s bottom line, operating income was basically flat year-to-year despite the success in the Eagle Ford. Chesapeake (CHK), another key Eagle Ford producer, reported a big operating loss for 2012.
 |
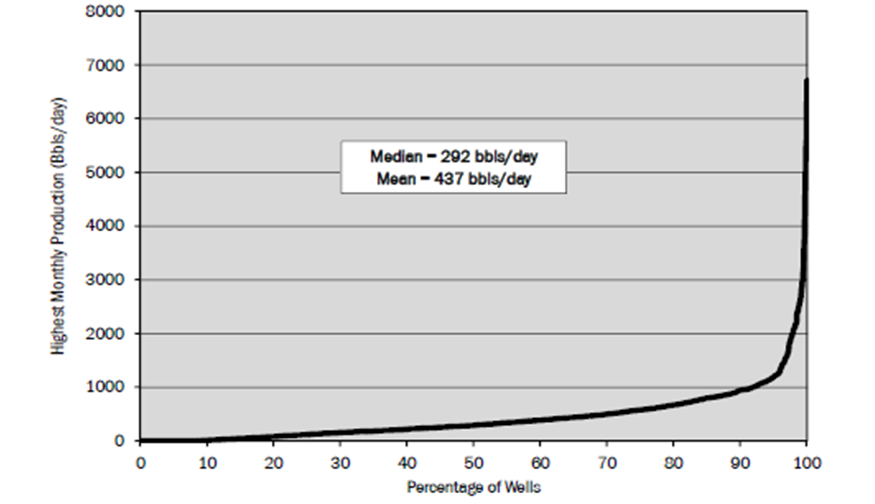
To be sure, other companies are still doing well with the Eagle Ford and other tight formations. But among the challenges to making ongoing profits at this game are the very rapid rates at which production flows decline after peaking and the fact that the vast majority of wells produce very little compared to those that receive the most publicity.
|
|
Getting oil from these sources is critical for America’s energy future. That makes it all the more sobering that a savvy company like Shell has decided it wants no part in it.
Given an ongoing production decline in an oil exporting country, unless they cut their consumption at the same rate as the rate of decline in production, or at a faster rate, the resulting net export decline rate will exceed the production decline rate, and the net export decline rate will accelerate with time. Furthermore, if the rate of increase in consumption exceeds the rate of increase in production, a net oil exporting country can become a net importer, prior to a production peak, e.g., the US and China. I have continued to be surprised at how much attention is given to the top line production number globally, and not to the bottom line net export number, especially as the developing countries, led by China, have (so far at least) consumed an increasing share of a declining post-2005 Global volume of Net Exports of oil (GNE*).
At the 2005 to 2012 rate of decline in the ratio of GNE to the Chindia Region’s Net Imports of oil (CNI), the GNE/CNI ratio would approach 1.0 in only 17 years, which means that China & India would theoretically be consuming 100% of GNE. For more info on “Net Export Math,” you can search for: Export Capacity Index.
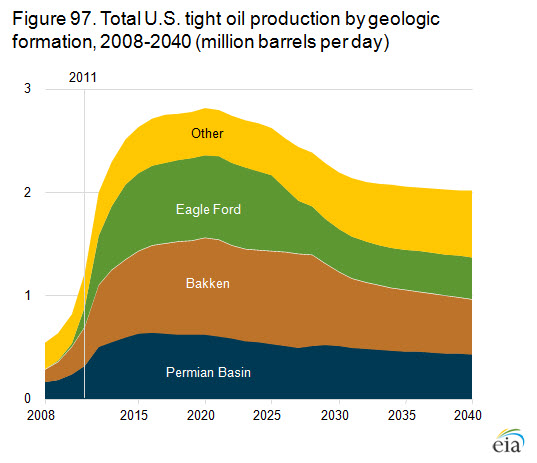
While currently increasing US crude oil production is very helpful, it is very likely that we will continue to show the post-1970 “Undulating Decline” pattern that we have seen in US crude oil production, as new sources of oil come on line, and then inevitably peak and decline (2013 annual US crude oil production will probably be about 22% below our 1970 peak rate).
The very slow increase in global crude oil production since 2005, combined with a material post-2005 decline in Global net oil exports, have provided considerable incentives for US oil companies to make money in tight/shale plays. But I think that the assertion by many in the Cornucopian camp that shale plays will result in a virtually infinite rate of increase in global crude oil production is wildly unrealistic.
We are facing high–and increasing–overall decline rates from existing oil wells in the US. At a 10%/year overall decline rate, which in my opinion is conservative, the US oil industry, in order to just maintain the 2013 crude oil production rate, would have to put online the productive equivalent of the current production from every oil field in the United States of America over the next 10 years, from the Gulf of Mexico to the Eagle Ford, to the Permian Basin, to the Bakken to Alaska. Or, at a 10%/year decline rate from existing wells**, we would need the current productive equivalent of 10 Bakken Plays over the next 10 years, just to maintain current production.
Note that the decline rate from existing production would be the percentage change in production from 2013 to 2014, if no new wells were completed in the US in 2014.
On the natural gas side, a recent Citi Research report (estimating a 24%/year decline rate in US natural gas production from existing wells), implies that the industry has to replace virtually 100% of current US gas production in four years, just to maintain a dry natural gas production rate of about 66 BCF/day. Or, at a 24%/year decline rate, we would need the productive equivalent of the peak production rate of 30 Barnett Shale Plays over the next 10 years, just to maintain current production.
Note that since the Shale Gas boom preceded the Shale Oil boom, the decline rate that Citi Research is seeing in US natural gas production is probably where the underling decline rate in US crude oil production is headed, as an increasing percentage of total US crude oil production comes from tight/shale plays.
*GNE = Combined net exports from Top 33 net exporters in 2005, EIA data
**Of course a 10%/year decline rate does not mean that production falls by 100% in 10 years, but I am stipulating an assumption of constant production, so at a 10%/year decline rate, we have to replace 10% of current production every year (times 10), in order to maintain constant current production for 10 years
Andy Hall over at Phibro has a nice chart showing the free cash flow of the 27 leading US oil and gas producers. It was a negative $42 bn in 2012.
But this is not the big story.
The big story is this.
Q2 and Q3 financials for the oil majors were dreadful. As a result, a number are announcing capex cut backs. TOTAL, for example, announced it was reducing capex by 14% over the next two years. IHS/CERA sees oil majors’ capex flat this year. GS sees Euro oil majors oil production down 4% this year.
Readers will recall my comments about capex compression. Well, it’s beginning. You’ll see capex reductions cascade through the industry now.
Here are some numbers:
For the publicly listed oil international oil companies,
in 2000:
capex was $50 bn, oil production was 13.9 mbpd.
in 2006
capex was $130 bn, oil production was 16.1 mbpd
in 2012
capex was $262 bn, oil production was 14.1 mbpd
for 2017, I am currently forecasting (first cut, provisional)
capex around $211 bn (current $), production 10.3 mbpd
To Steven Kopits:
Presumably this capex “compression” is happening because new marginal oil production is not profitable for these companies at current prices . What is your estimate of the price rise needed to result in a resumption of capex expansion?
We are now well advanced into the early decline/collapse phase of the “Seneca cliff” (Jeffrey’s work is an ongoing chronicle of the phenomenon) during which ~30% of available system reserves are extracted and consumed in an attempt to keep the previous exponential rate of growth going.
Of course, the problem occurs when the cost of extraction of the incremental 30% remaining reserves will not permit the overall growth of overall consumption per capita after price effects, i.e., real GDP per capita.
The final surge of reserve extraction and consumption occurs within a larger log-linear decline trajectory per capita from the all-time peak, leaving forever thereafter the costliest, least accessible reserves to be extracted at a decelerating rate, at lower profits, and eventually the inexorable contraction of extraction per capita and ongoing contraction of real GDP per capita. Two words: Peak Oil.
We cannot have profitable extraction of tight, deep, and tar oil AND grow real GDP per capita, i.e., another way of describing “Dutch Disease”.
The Seneca cliff is dead ahead, yet we have been persuaded by the mass media that the near doubling of extraction of costlier, low-quality US crude substitutes from the ’08 low at triple or more the average price is somehow sustainable and evidence that Peak Oil is dead.
Surreal.
P.S. Steven, I suspect your provisional forecast for capex and production is a reasonably good one, if not close enough to spot on, including my expectation of US production declining back to 5-6Mbbl/day during the next recession due during the period of your forecast.
P.S.S. The Seneca cliff will coincide with the secular debt-deflationary cycle of the Long Wave that has been postponed by desperate central bank reserve expansion and gov’t deficit spending, the peak Boomer demographic drag effects on housing and consumer spending, and growth of gov’t spending being capped by the limit bound constraint from public debt/GDP and net interest payments to receipts after social insurance receipts. The Limits to Growth (LTG) are occurring in numerous ways, including financial, exergetic/entropic per capita, fiscal, demographics, and imperial military overstretch.
If the decision is made to inflate out of the public and private debt to GDP, it will further destroy the purchasing power of real, after-tax wages, corporate profits, and gov’t receipts.
To some extent this is arguably the result of low interest rates. Cheap credit is supposed to encourage additional investment, which inevitably pushes down returns. You could say that in the case of oil and gas, low interest rates appear to be doing what they were meant to do.
Shale oil development is typically profitable only at higher oil prices. Higher oil prices are unsustainable economically given current consumption infrastructure and current economic conditions. Simple curtailment via price of lower utility uses will result in a significant drag on economic growth, given today’s consumption structure.
In the short to medium term, investment to increase the utility of oil consumed is necessary to increase the carrying capacity of the U.S. economy with respect to oil price, else economic growth, oil supply, and the ability of American oil demand to compete with higher utility demand elsewhere will be retarded. Numerous investments in conservation and fuel switching (not curtailment) are available with more oil per dollar available than via shale oil production. We are seriously underinvesting in this necessary infrastructure. Much of the underinvestment relates to market failures which are sometimes collectively referred to as the ‘energy gap.’ There are numerous aspects contributing to this gap. The biggest is probably simply imperfect information. Most oil consumption is by small end users with little knowledge of their options. Agency problems also contribute. Renters pay fuel bills but don’t have control of capital improvements (insulation, furnace replacement, etc). Truckers pay fuel bills (and pass on fuel costs to shippers as a class) but can’t easily discriminate (on price) between shipper owned trailers with good/bad aerodynamics. Used car buyers (the majority of Americans) find that their choices are constrained by the pool of vehicles selected years before by fuel price-insensitive first owners. Lack of capital access is another issue. Where end users understand their energy situation and don’t have agency issues, they still may well lack access to funds to make profitable efficiency investments. These are a few simple examples. There are many others, making market interventions a necessity if the economic drag of peak oil is to be minimized.
Joe –
Exploration and production costs have been rising at about 11% per year. Now, not all costs necessarily rise at that pace. And within this, there are industry specific factors that may be non-recurring. For example, Houston has been running a peak capacity, so prices of services and goods there have been very high. In addition, costs have increased as a result of both Hurricane Katrina and Macondo. For example, Shell’s Mars B platform, located in the same depth about a mile from the Mars A platform with the same capacity, weighs 2.3 times as much. About 30% of this increased mass is the result of regulatory changes associated with Katrina (ie, it can resist a bigger storm).
In addition, operators have become more risk averse, and project management, health safety and environment, and quality assurance costs have ballooned. Technip, a leading EPC, has noted that two different clients (oil companies) can pay $100 m or $500 m for the same service, depending on their management practices.
But underlying it all is deteriorating geology. No easier, no cheaper.
I would guess a 7-8% oil price increase per year would be enough for revenues to keep up with costs, although I’d note we have not run the numbers in detail.
Now, if you use a supply constrained model, as we do, then it has been apparent that oil prices would not rise much once they reached the global carrying capacity. So this outcome–capex compression–was readily predicted. The industry will continue to unravel.
For those interested, I’ll be presenting with Tony Yuen from Citi at the Woodrow Wilson School at Princeton on Oct. 24. It’s open to the public. I’d add that Citi uses a demand constrained model and represents the most pessimistic school of the outlook for oil prices. We represent virtually the other extreme (although we are obviously not the most bullish on prices), so it should be a lively debate.
Updated GNE/CNI Chart, from 2002 to 2012:
http://i1095.photobucket.com/albums/i475/westexas/Slide1_zps9ff3e76d.jpg
GNE = Combined net exports from Top 33 net oil exporters in 2005, EIA data, total petroleum liquids + other liquids
CNI = Chindia’s Net Imports
Sorry David but you seem to be missing the big picture. The fact that the majors are writing off their investments does not mean that they are any less capable than the small shale producers. From what I can tell the EURs that the small players use are too high and about half or less than what the actual production data is the reasonable recovery rate that should be used to depreciate the well costs. All this means is that the accounting is messed up (although perfectly legal) and that the small producers that you are touting are using the wrong schedules. This is why the 10-K filings are showing the need for more and more borrowing to fund operations and why producers that have been operating for many years have yet to pay dividends out of positive cash flows.
This game is not new. We saw the hardware producers in the 1990s report profit quarter after quarter only to see it all wiped away by massive ‘one-time’ write downs every two or three years. The trouble for the small players is that once a write down takes place the loans that are needed to stay afloat will go away and all shareholder equity will be wiped away. Shale gas and oil have been and remain a scam.
I am sorry, Professor Hamilton, but this narrative is simply a canard..
The Bankken and Ford Eagle play, are dominated by small E&P companies as the majors ignored these fields which do not represent the typical levels of desired production…
Let the major go to the Gulf of Mexico where they can have 10,ooo bpd from a single well..They are not interested in a well that produces at 5% of the number given above…
Mr Kopits, no firm will be cash flow positive when they are require to commit hundred of millions of dollars to bring a modest level of crude produce from zero..
Furthermore, many new start up businesses run in the red for an extended period of time…Start up like Google and others, had nothing but draw downs (spending money) for a number of years..
The head of the North Dakota Oil & Gas Commission publicly stated, that producers in his state requires only $50.oo pb to cover production costs of wells..
This accounting approach to profitability is simply wong and shortsighted..
Hans –
I can assure you that many in the oil and gas industry share Jim’s concerns about profitability and cash flow. It’s quite difficult, however, to understand the underlying financials due to the investment-to-cash flow cycle. Perhaps you are right. But if all this talk of 50-100% well irr’s were true, you would think that profitability would be high indeed. That’s not what we see.
The broader concern — for traditional high capex projects (not necessarily shale oil or gas) — is that costs are rising faster than revenues. That’s a straight-forward problem, with two solutions: reducing investment or passing along increased costs to consumers.
Now, if you are supply-constrained and the price has risen to carrying capacity, you cannot pass on price increases because, at that price, consumers would rather consume less than pay more. As a result, investment must be cut. And that’s what’s happening–but it’s happening in the context of continuing cost increases due to declining geological possibilities. (This is what peak oil is all about–its economics are not a like, say, a manufacturing process at this point.)
So the risk is that you enter a death spiral. Higher costs mean lower investment, but lower investment means lower oil production, and lower production means lower revenues, which in turn means lower capex, and from there to lower production again, and so on. We’ve now entered that spiral.
This is the big news in the industry. The key event was the defenestration of John Hess by Elliott Associates during the spring. In essence, financial (some might use the term “vulture”) investors forced an oil company to divest its refineries, retail stations, and materially restructure its portfolio. It was a frank recognition that big oil’s growth story had no legs, and that in the absence of growth, the industry would have to deliver cash.
And following Shell’s dreadful Q2 numbers, CEO Peter Voser acknowledged the same thing: that Shell would no longer provide forward production guidance and focus on increasing cash flow generation. In other words, Elliott had defeated Shell as well, not in an explicit battle, but in the battle of ideas about what oil companies can and should be. The Houston vision of the industry has capitulated to the Wall St. vision. And that’s a big, big deal.
An immediate causality is likely to be Alaska. Voser, in an FT interview yesterday stated that he didn’t know if “we’ll go back [into Alaskan waters] in 2014 or 2015.” That is a huge deal for Alaska, for its pre-sages the end of Alaska’s oil age by 2030, stranding some $2 trillion of hydrocarbons in the Chukchi and Beaufort Seas. (I’ll have an article on this in the Dec. 4 Oil and Gas Journal.)
Based on Steven’s numbers, for publicly listed international oil companies:
From 2000 to 2006, Capex increased at 16%/year, while oil production increased at 2.4%/year.
From 2006 to 2012, Capex increased at 12%/year, while oil production fell at 2.2%/year.
And of course, global crude oil production has shown a very slow rate of increase since 2005, with average production for 2006 to 2012 of about 74 mbpd, versus 74 mbpd in 2005.
The Cornucopians would argue that the shale revolution, applied globally, will turn these numbers around globally, but we really have an ideal shale play environment in the US, and as we have been discussing, the overall economics appear to be iffy at best, with a high, and increasing, decline rate from existing wells.
In my opinion, 90% of current oil wells in tight/shale plays will be plugged and abandoned or down to 10 bpd or less in 10 years. I just have a hard time believing that a collection of wells quickly headed toward stripper well status will power our way toward an indefinite rate of increase in global crude oil production.
Mr Kopits, if this is true, why are other firms spending billions?
“I can assure you that many in the oil and gas industry share Jim’s concerns about profitability and cash flow.”
“So the risk is that you enter a death spiral. Higher costs mean lower investment, but lower investment means lower oil production, and lower production means lower revenues, which in turn means lower capex, and from there to lower production again, and so on. We’ve now entered that spiral.”
What are you saying? A death spiral? It seems to me you are describing a type market cycle and when that cycle turns, you have just the opposite of what you described…
Mr Kopits, are you an Educational Specialist?
“Andy Hall over at Phibro has a nice chart showing the free cash flow of the 27 leading US oil and gas producers. It was a negative $42 bn in 2012.”
What matters to most, whether these “27” are in the red or black?
“This is the big news in the industry. The key event was the defenestration of John Hess by Elliott Associates during the spring. In essence, financial (some might use the term “vulture”) investors forced an oil company to divest its refineries, retail stations, and materially restructure its portfolio. It was a frank recognition that big oil’s growth story had no legs, and that in the absence of growth, the industry would have to deliver cash.”
Are you serious, Mr Kopits??????? Based on one, yes, a single, poorly operated integrated energy company you are condemning an entire industry? An industry that has been viable for over one hundred years!
The oil industry enjoys an average of 7% net margins, which is better than most by far…
You are horribly wrong and very misleading in your attempt to analyze the oil industry…I do not consider any of the information you have provided as being reliable in any sense..
This:
“and the fact that the vast majority of wells produce very little compared to those that receive the most publicity.”
and Hans’ comment.
I will leave it to those more familiar with the industry than I to debate, but it seems these two observations about the inherent nature of the fields are consistent with a small business industry structure no different than any other industry where elephant hunting does not make sense. Risky, but not unexpected.
VAngel, now you are carrying the saw old worn out message that you were delivering at mound of the American Enterprise Institute..
Everything you say is completely wrong, as these E&P company will be with us a decade from now, in good financial health despite your accounting treatment of the E&G industry…
BTW, is the AEI still banning posters for freely speaking their mind.?
I am not sure that comparing capex and production is valid. Investment in capes does not payoff immediately. If an industry that requires a high capital investment with a significant delay in increased production is expanding rapidly capex will always out-pace production in the early stages.
Looking at the professor’s first chart we see that production projections reaches a peak in 2020. That means that for the next 6 and 1/2 years production should be growing. But because of the profit spread there will continue to be a boom in capex so the ratio of capex to production will continue to be weighed in favor of capex.
Steven, what do you estimate is the normal lag between capex and production? I am not in the business, but I have heard it can range from 6 months to 2 years. I know our capital expenditures on major projects is easily 9 to 18 months depending on the complexity.
Speaking of AEI, they continue to have a different take on shale:
http://www.aei-ideas.org/topic/shale-revolution/
Thank you for the link, Mr Hall…
The Eagle Ford play, along with several others will in my opinion out produce even the great Bankken field..
Ricardo, excellent post indeed..We should NOT place any confidence in forward projects from the EIA..
DOE, is wholly incompetent…
Ricardo –
I’m not sure for shales, but I would guess 6-18 months. It’s pretty quick, really.
For high capex projects like deepwater, project development will typically run 7 years, with, say, 60-75% of the capex in the last three years or so.
For the Arctic, from initiation of development to first oil can be 20 years.
But to your point, yes, it’s difficult to distinguish between the ramping and the cash generation period for shale oil during the rapid growth period. And the companies themselves have every reason to hype their results.
For shale gas, it’s pretty clear that the profitability was not there–in part because over-supply killed pricing. The issue is not so clear for shale oil, which is priced globally with a discount for bottlenecks.
In any event, time will tell, and I would guess that Jim will be, at least in large measure, vindicated. He doesn’t tend to make mistakes in these sorts of things.
Everything Mark Perry at AEI says is, to the best of my knowledge, true.
But he’s talking about production volumes, not profits or free cash flow generation. Jim’s talking about various measures of profitability.
The delta between these two is external financing. If equity investors or lenders are willing to finance losses, then you don’t have to be profitable, only prolific.
“But if all this talk of 50-100% well irr’s were true”
Mr Kopits, please show me one E&P making this claim (100% IRR)(Internal Rate of Return).
The typical IRR that I have seen has been between 30% to 70%, depending where it was drill and what type of well construction…
From what I have read, it typically take a start up about five years to go into the black; that is how massive costs are.
There are those whom speak about depreciation and depletion rates as a means to justify their claim that the shale oil industry is not a long term viable industry.
This has no bearing on the truth, as it entails accounting applications and unsupported and speculative claims. Yes, depletion rates are indeed very frightful but 80 to 90% of the crude is left behind…
They are preserving future production for the next generation with the newest technology…
I may add, that well designs are improving; as are tighter chocks holes; and new and improved technology are increasing not only EUR (total well production) but also significantly reducing well drilling costs and time.
This is something that the distractors never speak about nor mention..
Shell and Royal Dutch, late to the shale oil game are not needed; they can go and find the headline plays..Pity for these slow and top heavy companies, as the shale oil plays will in due time produce Fortune 500 oil companies…
IRRs –
See, for example, Range Resources latest investor presentation: http://phx.corporate-ir.net/phoenix.zhtml?c=101196&p=irol-presentations.
See slides 16, 19, 22 and 57. If these irr’s were representative, I would think the company would be hugely profitable. Keep in mind, the decline rates are very high, so you should have most of your return within two years or so.
As I have periodically noted, Chesapeake, in 2007, claimed that their Barnett Shale wells on the DFW Airport Lease would produce for at least 50 years.
As of early 2013, 10 of the 21 wells completed on the DFW Airport Lease in 2007 were already plugged and abandoned, and production from the original group of 21 wells had fallen by 95% in about five years.
You would see similar declines for virtually any grouping of tight/shale wells over a five year period.
Jim Kramer was pumping up Pioneer Natural Resources stock on CNBC this morning. He suggested we might be energy independent in a “Couple of years.”
If we were able meet US refinery demand for crude oil of about 15 mbpd (versus a probable 2013 average US production rate of 7.5 mbpd), from booming tight/shale production, one would think that the underlying oil production decline rate from existing wells would be at least 20%/year (Citi Research puts the underlying natural gas production decline rate at about 24%/year).
In any case, at a theoretical production rate of 15 mbpd, with a 20%/year decline rate, we would need 3 mbpd of new production every year to maintain said 15 mbpd production rate. So, in round numbers all we would need to to in order to maintain a production rate of 15 mbpd would be to put on line the current crude oil production of Saudi Arabia about every three years.
This thread, Mr Kopits, is discussing crude oil and not natural gas…
The 100% plus IRR you gave was solely for NG production…
Furthermore, is Range saying ALL of their natty production is returning over 100% or just this particular field?
Again, I will wait for crude only or a mix of production of 70/30 or 80/20 or more of crude and natty, with your suggest high rate of returns…
Mr Brown, the fact that natty is selling for $3.70 is an indication of a vast over supply of this energy..
Hans –
Continental Resources, on p. 17 of their Oct. 1 investor presentation is showing a 65% irr for their Bakken production.
But you’re right, I was mostly commenting on the shale gas producers since you had referenced US E&Ps. Many of the US independents have mixed production of gas, oil, and NGLs. CR is a relatively clean oil producer. Pretty decent financials.
But I did not claim the shale oil producers were not profitable. Here’s what I said:
“…it’s difficult to distinguish between the ramping and the cash generation period for shale oil during the rapid growth period. And the companies themselves have every reason to hype their results.
“For shale gas, it’s pretty clear that the profitability was not there–in part because over-supply killed pricing. The issue is not so clear for shale oil, which is priced globally with a discount for bottlenecks.”
All I said was that it’s not entirely clear to me whether the shale oil sector as a whole is making money, keeping in mind that many of the US E&Ps have gas, oil and NGL production combined in their financials.
Sorry, small correction: Jim Cramer was pumping up Pioneer Natural Resources stock on CNBC this morning. He suggested we might be energy independent in a “Couple of years.”
Hans,
I agree that spot natural gas price is only up 90% from the April, 2012 low, although we remain well below the 2008 price level. And of course, as of 2012, we remained a net natural gas importer.
However, that doesn’t address the point I was making about enormous decline rates. The 2007 vintage Barnett Shale wells–with about a 95% decline in production–provide an example of the kind of five year declines we see in shale plays. But perhaps Chesapeake meant to say that the wells would last for at least 50 months, and not 50 years.
Steven,
Thanks for the confirmation that my thoughts about the capex timeline were about right. I respect your ananlysis greatly.
Hans, thanks for being such a voice of reason.
The Shale Gas Boom: Energy’s ‘Big Lie’ Of The Century?
http://seekingalpha.com/article/1735262-the-shale-gas-boom-energys-big-lie-of-the-century?source=email_macro_view&ifp=0
My comments:
As noted above, since the shale gas boom preceded the shale oil boom, total US natural gas production, with an estimated underlying decline rate of about 24%/year*, is where total US crude oil production is headed, as an increasing percentage of total US crude oil production comes from very high decline rate tight/shale plays.
*Citi Research
WSJ: U.S. Refiners Export More Fuel Than Ever
American Companies Export Energy Boom World-Wide
Excerpt follows. You can usually find the article by doing a Google Search for the title.
My comments:
Curiously, no mention in the article of the fact that the US is currently dependent on imports for half of the crude oil processed daily in US refineries. The reality is that the developed net oil importing countries like the US are gradually being shut out of the global market for exported oil, via price rationing, as the developing countries, led by China, have (so far at least) consumed an increasing share of a post-2005 declining volume of Global Net Exports of oil.
An item in support of the DFW Airport Lease case history I cited, showing a 95% decline in production in five years (for 21 wells on the lease completed in 2007). Note that this five year production decline was for overall production from the 2007 vintage wells. As of early 2013, about half of the 2007 vintage wells had already been plugged and abandoned.
http://www.resilience.org/stories/2013-10-09/snake-oil-chapter-3-a-treadmill-to-hell
SNAKE OIL: Chapter 3 – A Treadmill to Hell
by Richard Heinberg, originally published by Resilience.org
Here’s Art Berman on the shale plays. Well worth watching.
http://www.youtube.com/watch?v=DHkKa4Zj_94