From Torsten Slok at Deutsche Bank:
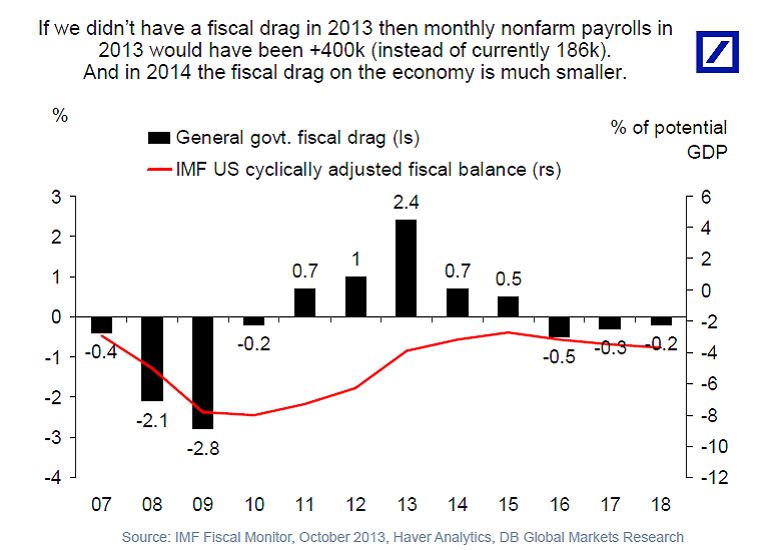
[F]iscal drag in 2013 is 2.4%, ie if GDP growth in 2013 ends up being 1.7% then if we had not had the fiscal drag then GDP growth would instead have been 4.1% (=1.7% + 2.4%). ..
…Translated into nonfarm payrolls this means that instead of having nonfarm payrolls at 186k – the average monthly number so far for this year – then nonfarm payrolls would have been more than 400k…
Moreover, the fiscal drag is likely to persist given that US public debt to GDP has reached the cumulative differential order of exponential magnitude, and thus debt cannot grow faster than GDP hereafter. During the next recession, any incremental net deficit spending will go to food stamps, unemployment payments, disability, and Medicaid and ACA, leaving little if any net “stimulus” for anything else in excess of net interest. Add another imperial war or two and there will be less for everything else in excess of net interest payments.
Also, the net fiscal drag as a share of GDP effectively cancels out the modest contribution of residential investment as a share of GDP.
As for private debt, non-financial corporate debt to GDP is now at a record high going back to 1929-30, as well as also having achieved the cumulative differential order of exponential magnitude to GDP since the 1950s. And a growing share of new corporate debt issuances has been to buy back shares to reduce float and pad earnings per share, increasing the debt and debt service to trend growth of revenues, cash flow, and shareholder equity in the process, increasing the likelihood of large-scale consolidation of capacity and job cuts during the next recession.
The primary takeaway is that total public and private debt to GDP has reached the cumulative differential order of exponential magnitude, as occurred in 1929-30 and Japan in 1990-94, which will be a binding constraint on growth of debt to GDP and real GDP per capita hereafter.
The high public and private debt-to-GDP constraint not coincidentally occurs historically with high equity cap to GDP and a high Q ratio, which in turn reflects the extreme wealth and income concentration to the top 0.1-1% to 10%, i.e., hoarding of financial assets at no velocity.
Therefore, the fiscal constraint is not a cause of slower growth of real GDP per capita per se but a RESULT of having reached the private debt constraint, exacerbated by extreme wealth and income concentration, which in turn reduces growth of private investment, production, employment, tax receipts, and overall real GDP per capita.
In a debt-money-based, fractional reserve banking system in which private debt-money is lent into existence at perpetual compounding interest in perpetuity to be circulated for value-added economic exchange, it follows that the public and private debt constraint on GDP prohibits accelerating growth of assumption of debt by households and firms hereafter, thereby precluding acceleration of growth of real GDP per capita indefinitely.
But few economists are trained (or paid) to acknowledge the potential for, or existence of, structural public and private debt constraints to growth of real GDP per capita and gov’t spending.
It’s been a lifetime since economists in the 1930s were forced by circumstances to deal with the obvious structural impediments from too much debt, insufficient growth of employment, wages, and purchasing power, credit and asset bubbles, asset mispricing and overvaluation, and the resulting severe constraints from extreme wealth and income concentration.
A bubble in bank reserves and equity and junk bond prices and deficits of 5-10% of GDP will not relieve the structurally binding constraints from too much debt and insufficient purchasing power of labor.
Now these issues are back and must be dealt with rather than conveniently ignored or denied for ideological reasons.
2.4% of total government expenditures? Or GDP? This is confusing for readers that don’t know how to calculate fiscal drag.
Either way, by the sound of it what this report is saying is that if the government was going further in debt than unemployment would be lower (correct me if I’m wrong).
However, presumably someone has to payback all of our debt, so by having more fiscal drag now we are actually increasing employment in the future. Sounds fair to me: we should pay for things we value, and if unemployment is higher becaue we are only buying things we are willing to pay for than so be it…
“[F]iscal drag in 2013 is 2.4%, ie if GDP growth in 2013 ends up being 1.7% then if we had not had the fiscal drag then GDP growth would instead have been 4.1% (=1.7% + 2.4%)…”
There are two very large assumptions built into this overly simplistic statement:
1) The fiscal multiplier is precisely equal to 1 and that it occurs entirely during the year of impact.
2) The Fed would not have done anything different in the absence of the tax increases and sequestration.
In my opinion the Fed seems to be aiming for 2% real GDP growth and 200k payroll growth (for example see page 8 and Figure 1):
http://www.frbsf.org/news/speeches/2013/john-williams-0516.pdf
And hence I think the Fed is reasonably satisfied with what the rest of us quite rightly consider to be a mediocre outcome.
The problem is that there isn’t anything to reconcile the estimated counter-factual of 4.1% GDP growth. Both the CBO and the IMF certainly weren’t projecting anything near 4.1% growth for 2013 in 2012. Moreover, the 4.1% counter-factual looks even more ridiculous if you assume actual 2013 growth is greater than 1.7% (likely) or use the new GDP-plus figures. But I suppose doing this kind of math is too much to ask for someone who isn’t interested data that might challenge their viewpoint.
Mark: “[T]he Fed is reasonably satisfied with what the rest of us quite rightly consider to be a mediocre outcome.”
From my comments above, I strongly suspect Fed officials have little choice in the matter.
https://app.box.com/s/t4v5x4yr55qyu2alsw4t
https://app.box.com/s/e1ua4c3nkpbx84jjm846
https://app.box.com/s/pz76hmzmrh14shw4j4ki
Regarding corporate debt within the Long Wave debt-deflationary regime, it’s US 1936-37 and Japan 2000 deja vu “all over again”.
Public and private debt to GDP, wages, profits, investment, and gov’t receipts will be a structural drag for many years to come.
The debt-deflationary depressions of the 1830s-40s, 1890s, and 1930s-40s were resolved with the 30-50% wipeout of bad bank loans and state-sponsored debts for canals and railroads, and for private debt of railroads, banks, utilities, and industrial firms during those successive periods.
This time around, apart from a decline of 30-40% in large Japanese banks’ loans in the mid to late 1990s, the bad private debts did not deflate and have been transferred to public debts. Now the combined public and private debt to GDP is larger than before the debt-deflationary wipeouts of the 1830s-40s, 1890s, and 1930s-40s.
There is no historical precedent for the current global debt to GDP. Each successive debt-deflationary regime since the 1830s resulted in a depression larger in scale than its predecessor.
The “capitalist” global corporate-state will face its greatest challenge to survive, adapt, and evolve in its history in the years to come.
Keynesianism emerged from the 1929-33 crash and evolved during a bipolar economic world and the Cold War and MAD.
Supply-side and “trickle-down” grew out of the oil shocks, onset of deindustrialization and financialization, stagflation, and high interest rates of the 1970s-80s.
The current Long Wave depression now requires a radically new techo-economic world view and imagination of what is possible in order to create a new social contract and devise a division of labor (or non-labor), tax code, “money”, system of increasingly automated means of production and goods and services, alternative income and purchasing power creation and distribution, and values, expectations, and responsibilities that reflect an ecologically sustainable system to last another 60-70 years.
Reset and r-evolve.
anonymous,
“However, presumably someone has to payback all of our debt, so by having more fiscal drag now we are actually increasing employment in the future. ”
This statement is not true. Growth is compounded (ie it builds upon its current condition, not linearly from some previous baseline). hence when you invoke increases is immensely important over the long run. if you think this is not true, then would you rather have your pay raises occur every year, especially in your early years? or would you rather wait and have your pay raises all occur over you final couple of years of employment? compounding results are very powerful.
Thanks, Menzie.
This says general government, is it just federal or are state and local included?
Is the IMF assumption that there is no multiplier (1.0) of fiscal drag to GDP?
@Bruce,
“From my comments above, I strongly suspect Fed officials have little choice in the matter.
https://app.box.com/s/t4v5x4yr55qyu2alsw4t
https://app.box.com/s/e1ua4c3nkpbx84jjm846
https://app.box.com/s/pz76hmzmrh14shw4j4ki…”
The recent change in nonfinancial corporate debt is a lot less remarkable when you put it over a denominator such as GDP:
http://research.stlouisfed.org/fred2/graph/?graph_id=148225&category_id=0
It was higher in 1970, 1973-74, 1981, 1984-86, 1998-2000 and 2007.
I did the same thing for corporate bond and note issuance in the 1920s and 1930s:
http://research.stlouisfed.org/fred2/graph/?graph_id=148226&category_id=0
Yes there was an enormous spike in 1936Q2 but nonfinancial corporate leverage plunged in 1933-37.
Consider the debt levels:
Nominal Debt (Billion $)
Sector——-1933-% of GDP-1937-% of GDP
Government—40.6—-72.0—55.3—60.2
Nonfinancial-86.0—152.5—84.4—91.8
Household—-30.2—-53.5—31.2—33.9
Financial—-11.7—-20.7—11.3—12.3
Total——-168.5—298.8–182.2–198.3
NGDP———56.4———–91.9
Debt data can be found here (page 989):
http://www2.census.gov/prod2/statcomp/documents/CT1970p2-11.pdf
NGDP data is here:
http://www.bea.gov/iTable/iTableHtml.cfm?reqid=9&step=3&isuri=1&910=X&911=0&903=5&904=1933&905=1941&906
Note that debt as a percent of GDP declined in every single sector. Since the GDP implicit price deflator increased by about 12.5%, real debt declined in every sector except government. Nominal debt declined in every sector except government and household although household sector debt only increased by one billion dollars or about 3.3%. Examination of the subsector data reveals that household sector mortgage debt fell in nominal terms. The only kind of household debt that increased in nominal terms was consumer debt which increased from $3.9 billion to $6.9 billion over this period.
The 1937-38 recession was primarily caused by the decision to start sterilizing gold inflows in December 1936.
http://www.dartmouth.edu/~dirwin/1937.pdf
It had nothing to do with debt.
@benamery21,
“This says general government, is it just federal or are state and local included?”
The phrase “general government” means all levels of government.
“Is the IMF assumption that there is no multiplier (1.0) of fiscal drag to GDP?”
The IMF makes so such assumption. That is the assumption of Torsten Slok of Deutsche Bank.
http://www.youtube.com/watch?v=TErQbwHHh_w
Public and private debt gravity, stay the heck away from us; it’s taken better than men than we are (speaking for myself).
http://www.youtube.com/watch?v=Bn0NLQI-l08
http://www.youtube.com/watch?v=p1V4yNW3WeE
http://www.youtube.com/watch?v=20Ov0cDPZy8
Keep us “where the light is” while “we’re slow dancing in a burning room” and hoping to “stop this (runaway bubble) train” of QEternity and asset bubbles our grandchildren, should they exist, will wonder what the bloody hell we (the Fed/TBTE banksters) were thinking as we were “inked” and “free fallin'” (ht Tom Petty) and “sleep walkin’ in Hollywood”.
Pardon a big bird. Eat plants and give thanks that they evolved to breathe (consume our “spirit” and that of the microrganisms in the oceans) our waste and give us in return the breath (“spirit”) of life. They’re us. We’re them. We can’t “be” without them.
http://www.youtube.com/watch?v=5uNDhLRzPCQ
http://www.youtube.com/watch?v=xh-ACkYmdc4
There ain’t no “us and them”. We’re all “it”: “One”.
I am absolutely certain as I am alive and typing this that we, including economists :-), all want a political economy that does that and gets on with it.
Now we even have a Pope/Padre who is permitted to “get it” and be a “Christian” (GASP!) brother/sister (and by extension a J_w, Muslim, Buddhist, Hindu, Jain, Sikh, animist, atheist, and your humanist choice, or not, of “ist”).
There’s yet a chance for the human ape species on this finite spherical Spaceship Earth caressed by an impossibly thin blanket of ozone, protected from the cold, black infinitude of space and fatal cosmic solar radiation.
Peace and “One” love, “carrying each other”, for the holiday(s). Let’s be that; it’s all we ever can be.
Hmmm, 4 years into the “recovery” and we’re discussing “fiscal drag.” How about “policy drag?”
Any comments on the UK? Which just cut a mortgage support scheme. But the UK shouldn’t be worried about overheating, should it? Damnable austerity there too.
And they don’t even have little Paul Krugman to lead them out of the wilderness.
Woe, woe – output gap, fiscal drag – suffer the people.
And Happy Thanksgiving!
The most beautiful thing about a claim like this is that there’s no way it can be disproved. That’s bulletproof economics for you!
Two more charts to illustrate that the US is in a slow-motion economic depression, not unlike the deflationary depressions of the 1830s-40s, 1880s-90s, 1930s-40s, and Japan since the 1990s:
https://app.box.com/s/g1qd63k4cq7vxpu6ojic
https://app.box.com/s/4ccj1how2oy9hw3h9s09
Too much public and private debt to GDP and wages.
Extreme wealth and income concentration to the top 0.1-1% to 10%, resulting in massive asset bubbles to GDP and savings hoarded at no velocity in the form of grossly overvalued corporate equities of the Fortune 100-500 firms.
Labor’s share of GDP crushed for 30-40 years and the emerging peak demographic cohort experiencing worsening labor underutilization.
Peak Oil causing structural constraints on net energy per capita and real GDP per capita.
Peak Boomer demographic drag effects persisting into late decade to the early 2020s, risking a permanent downshift in potential real GDP per capita to well below 1% vs. the long-term 2% average.
So-called “health care” costs now at $9,200 per capita and an unspeakable equivalent of $24,000 per household, risking bankruptcy of households, small firms, and gov’ts.
An economy that has not created a net new full-time private sector payroll job per capita in 30-35 years.
A U rate at 7% that would otherwise be 10-11% had the labor force participation rate not fallen from 66% to 62%.
Reset and r-evolve.
http://www.cepr.net/index.php/op-eds-&-columns/op-eds-&-columns/the-path-to-renewed-growth
Speaking of depressions, Japan is due a MODEST demographic tailwind into ’16-’19, which could result in a MODEST acceleration of real GDP per capita from close to 0% to close to 1% during the period.
However, were the acceleration of economic activity to occur, it will happen coincident with the US, EU, and China facing demographic headwinds even slower growth of real GDP per capita, and it will have next to nothing to do with “Abenomics”, inflation targeting by the BOJ, currency devaluation, or any such silliness.
There is the possibility, however, that the larger structural (permanent) demographic forces in Japan will overwhelm the MODEST tailwind from peak Japanese echo boomers.
Regardless, after ’19, Japan’s economy and society will descend permanently into structural decline.
Mark, thanks so much for taking the time to compile and share the information. Excellent.
What is left out of the gold sterilization narrative (or only tangentially suggested) is WHY gold inflows were occurring (What was happening in Europe and Asia in 1936-37?) and what effect the inflows had on the equity and corporate bond markets in 1934-37. WHY did the inflows occur? Was it warranted on the basis of fundamentals? Or was it a result of post-crash, liquidity-induced speculative activities that resulted in a financial market vulnerable to even the hint of liquidity slowdown or withdraw? Sound familiar?
Might not a “taper” by the Fed/banks have the same effect on the monetary base/bank cash assets as gold sterilization? Might reducing or eliminating interest on reserves have a similar effect?
But what if the risk from the “taper” or sterilization is because of the excessive bank reserve expansion that encouraged and then entrained another massive financial asset bubble with no demonstrable “wealth effect”?
https://app.box.com/s/fggfwopcl28zdx27ddrq
https://app.box.com/s/hhb65d0yv3rh2xt7lxlp
Also, like today, bank deposits less bank cash assets began contracting in early 1937 coincident with the gold sterilization, an equity market peak, and the onset of a decline in bank lending. Today, bank lending is no higher than in 2007-08 (after the 50% decline in 1930-35, it took until 1940-41 for bank loans to return to the 1929 and 1919 highs) and at or below recessionary rates of the past, coincident with deposits or M2+ and large time deposits contracting yoy after bank cash assets.
IOW, we have a similar condition today without a coincident gold sterilization-like event or “taper” on bank reserves and the monetary base from policy actions by the Treasury or central bank. Why? Might it be because revenues and employment wage gains after taxes and price inflation are barely growing, if at all, even with the massive bank reserve/monetary base expansion?
The Fed can print bank “assets” and marginal profits but not private savings, capital stock, investment, revenue, and wage and purchasing power gains.
What happens to an economy with so much debt to GDP and slow trend real GDP per capita that then experiences another equity and corporate bond bubble from massive liquidity injection in the banking system by the central bank/banks?
That’s where we are today. If the Fed/banks continue expanding reserves at $1 trillion a year indefinitely, how much further will corporate debt and market cap expand as a share of GDP? How much more stretched will equity prices become compared to long-term earnings and trend nominal and real GDP? What risks are posed from increasingly overvalued equity and corporate bond prices? Are these risks recognized? Being ignored?
I contend that we have reached the similar debt/GDP constraint at echo bubble equity and corporate bond valuations and decelerating real GDP per capita as occurred in 1936-37 and Japan in 1999-2000. A further liquidity-induced rise in equity prices and corporate debt to GDP only increases the scale of misallocation and the debt-deflationary contraction when it eventually occurs. Fat-tail risks rise with increasing leverage and complacency. And, boy, do we EVER have leverage and complacency today.
Short of a debt-deflationary contraction, the unprecedented public and private debt/GDP and associated wealth and income concentration and effect of hoarding overvalued assets at no velocity will be a hard constraint on trend real GDP per capita growth of less than 1% indefinitely hereafter.
If another crash occurs, it won’t be “because of” a “taper” or “sterilization” but because of excessive central bank/bank liquidity that encouraged and enabled increasingly leveraged and extreme speculative activities that resulted in yet ANOTHER episode of massive financial asset bubbles (unanimously denied) that ALWAYS burst.
We will soon find out if the decline in bank deposits/M2+ less bank cash assets is a coincident indicator of a 1937-like setup for a crash and recession. But this time we can’t afford a Lend-Lease Act, mobilization for a world war, and gov’t takeover of the economy and 8 years of unprecedented war production and mass destruction of our military and economic competitors.
Or can we . . . ?
Does anyone find it the least bit plausible that GDP growth was poised to more than double in 2013? Were leading indicators telling us so? Come off it.
It’s frustrating that deficit doves are so ideologically hidebound that when the country pulls off a large fiscal consolidation with very little growth slowdown, they decide we must have somehow missed that growth was poised to dramatically accelerate had the consolidation not happened. Disingenuous hogwash.
I’m not denying the power of fiscal drag, but let’s face it, this time for various reasons we felt quite little. One reason is that part of the consolidation was illusory: about $100bn squeezed out of Fannie and Freddie, financed mainly by the Fed. Another reason is that a large part of the consolidation was in military spending. A third reason is that people generally reacted to the payroll tax hike by reducing savings rather than spending. Spending levels seem to have some stickiness in the face of tax hikes. You’d think Keynesians would be all over that story, but alas, they’re too deep in the ideological trenches to explore anything new.